In the July 2023 Jobs Report we take a detailed look at job market trends for supply and demand by industry sector, open postings aging, and posting volume. The pandemic drove a chronic shortage of workers in hospitality and retail. Any companies that had jobs involving face-to-face communication had problems getting people to work. I remember going to a Wendy’s and a worker telling me jokingly that she “had all the power”. Finally, the balance of supply and demand for these types of jobs has evened out.
Supply/Demand – Accommodation and Food Services Reach Parity 😀
The supply and demand graph below highlights surplus, and deficit of workers related to job postings. The inner black bar graph displays the job postings and the outer colored bar is the number of active resumés. Red indicates a shortage of job seekers compared to postings, and the green bar indicates job seekers exceeding job postings.
Despite an abundance of job seekers in customer-facing industries they had been largely sitting on the sidelines. In July, the Accommodation and Food Services sector reached parity where the number of job seekers essentially matched the number of job postings. The Retail sector showed improvement as well.
The situation in these industries has always been temporary. Compensation increases, improved working conditions, and the risk decline from the pandemic have all contributed to a return to normality.
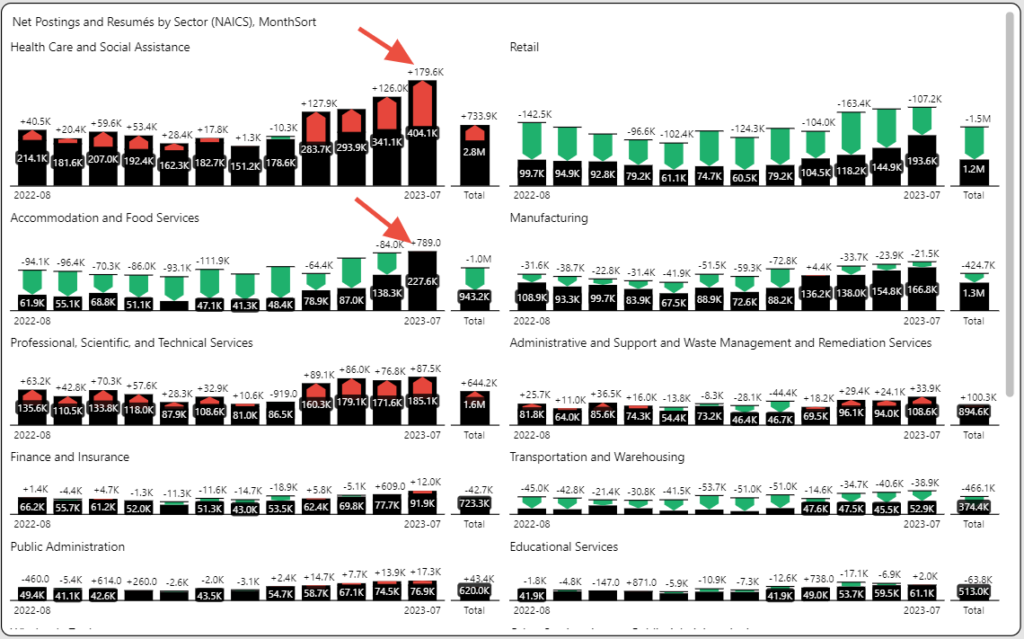
Unfortunately, the supply/demand imbalance in health care is not a short-term problem. Job seekers identified through resumé updates is twenty percent behind job posting activity. In July, that number reached thirty percent. Health care worker shortages are wide reaching across practitioner and support roles.
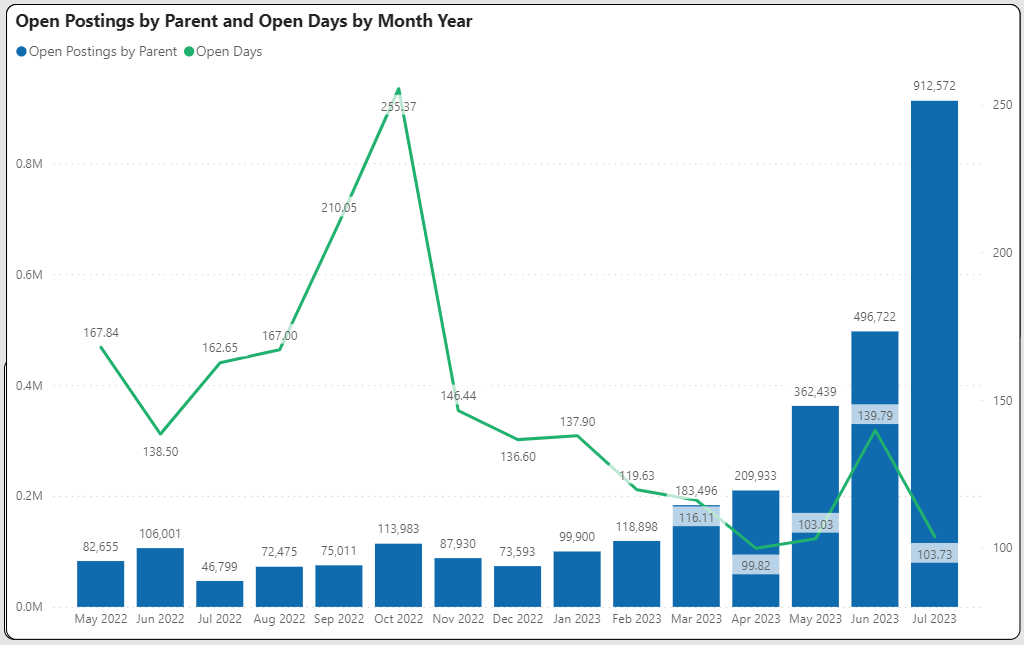
Open Postings Aging – Down 26% vs. June 😀
In July, open postings were flat compared to June. The average age of open postings stands at just over four months. This was a small victory as open posting age had increased substantially over the summer months.
The graph below shows the composition of open postings. The age of a posting is based upon the first date of a job posting (the parent posting date). June open postings open days were nearly 140 days, and July open days dropped to 104 days.
The second quarter weeded out some overhang in older postings as the average estimated fill days jumped to 65 days. This was the highest average since the fourth quarter of 2021.
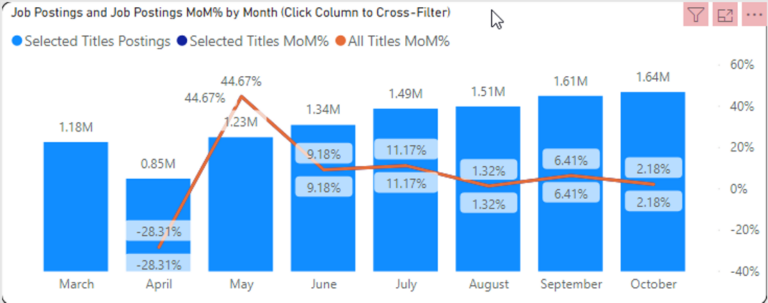
Posting Volumes – Flat vs. June 😐
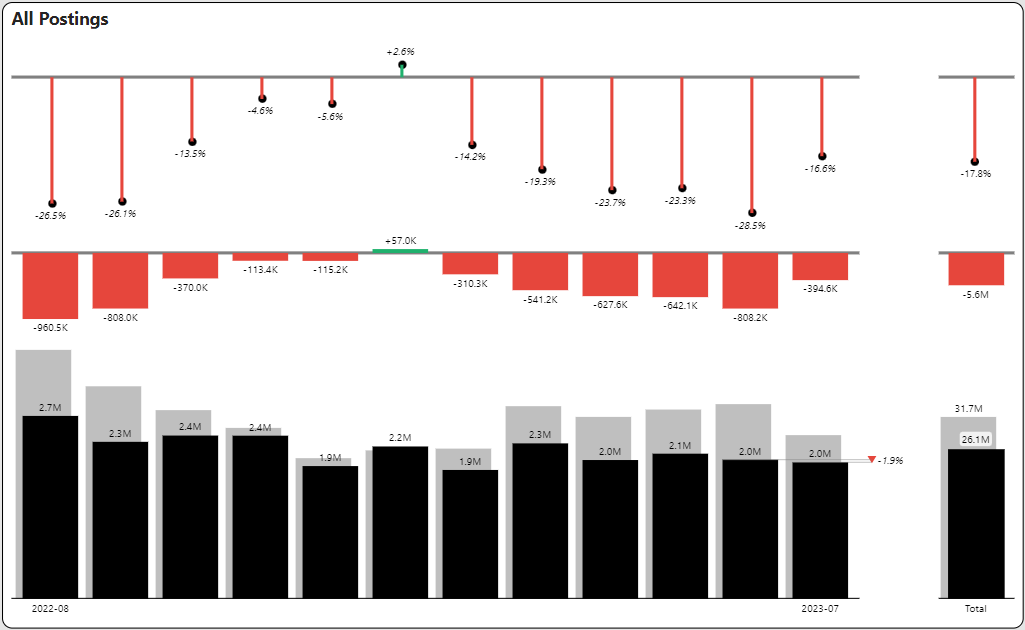
Job postings have shown mostly double-digit declines for the past twelve months. July was no exception. Job postings declined 16.6 percent from the prior year. Job postings were flat from June to July. The graph below shows the current year volume (black bar) superimposed against the prior year volume (gray bar). The red column bars show the volume differences, and the red vertical lines show the percentage differences.
The sluggishness of the market defies the number of job openings that are surveyed from the BLS JOLTS survey. Even though job openings are down from historic highs, they are still 33% above pre-pandemic levels.
Get More July 2023 Jobs Report Insights
Sign up to watch our Jobs Report Video for even greater insights on this topic and receive supplemental reports and market data every month.
What is TalentView?
These insights were generated from our TalentView job market data and analytics solution. Integrate our job market data into your application, or use our self-service analytics platform. Learn how TalentView can help with talent sourcing and business growth and watch a demo.