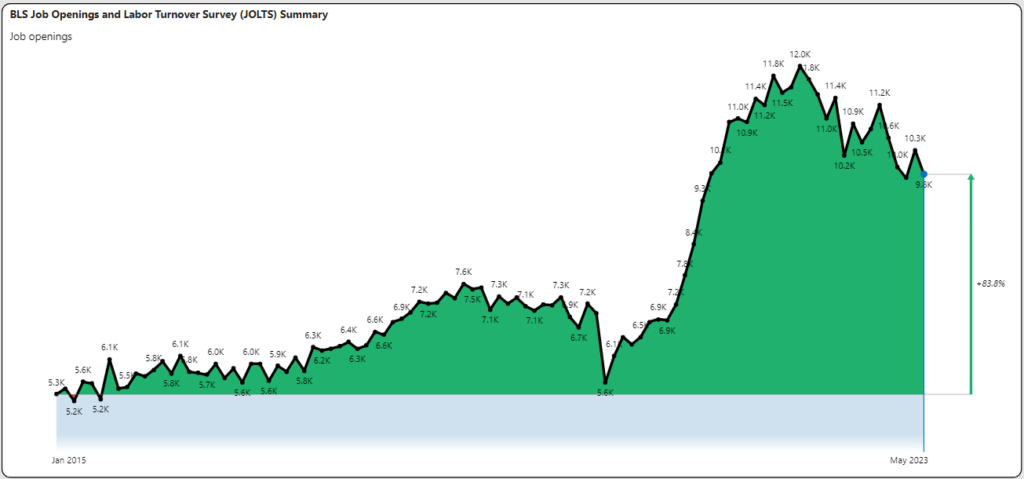
In the June 2023 Jobs Report we take a holistic view of job and labor stats and the disconnects that exist. We use the words “new normal” to describe a lot these days. In the post-pandemic era we may have to apply it to many aspects of today’s labor market. Employers (through surveys) maintain that there are 9.8 million job openings in this country. This number is 36% above pre-pandemic levels and nearly double what it was in 2015.
The Disconnect in Job Openings
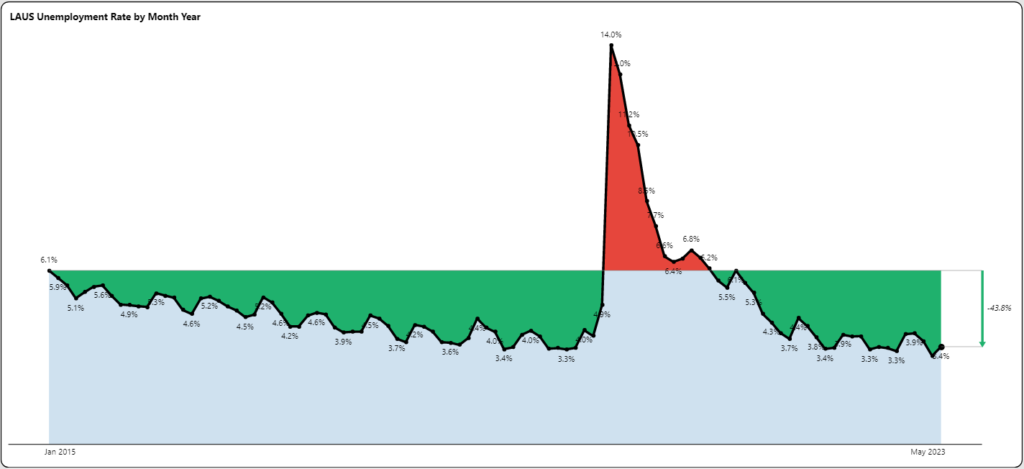
This is despite historically low unemployment rates as shown below.
Layoffs and discharges also remain extremely low and in fact continue to decline in an inflationary economy.
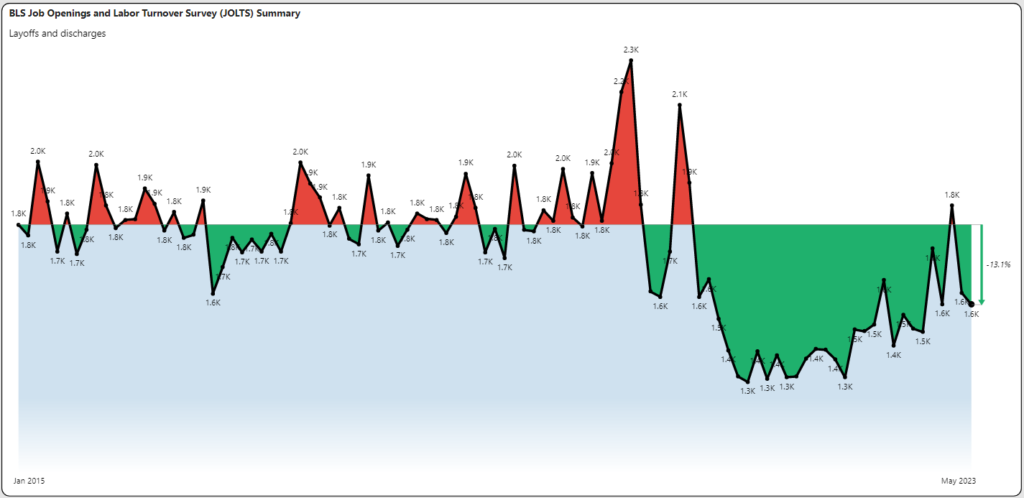
This all sounds like great news. Record job openings plus historically low unemployment plus extremely low layoffs are all good metrics. Except in the new normal, maybe they aren’t.
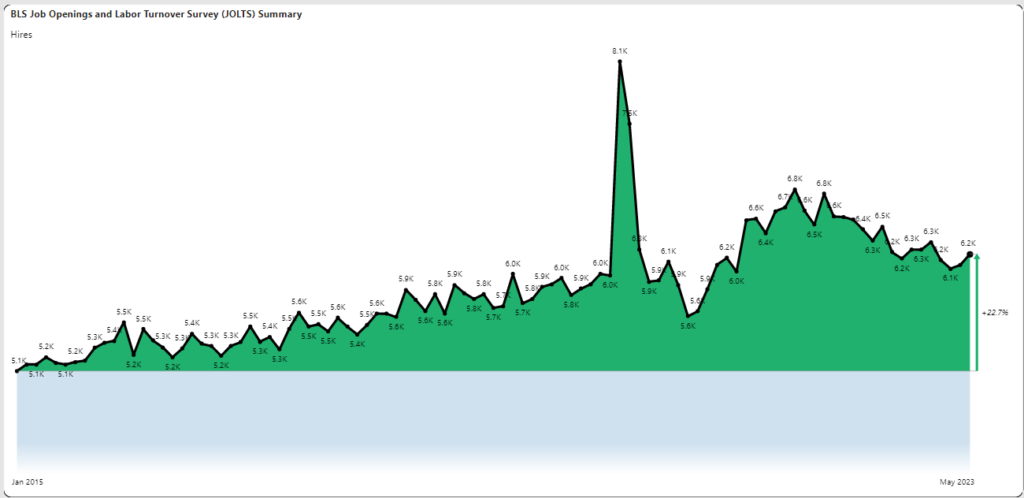
New Hires are Flat and Postings are Declining
Hiring (according to the BLS) while increasing steadily over the past 10 years is only now on par with pre-pandemic levels.
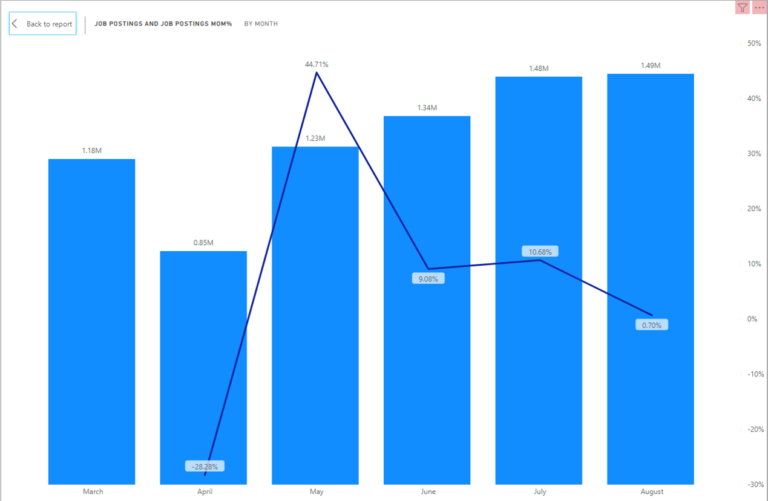
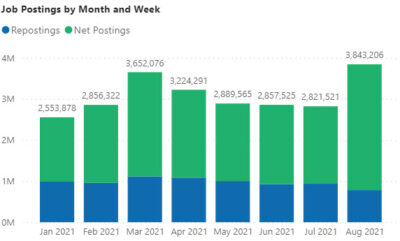
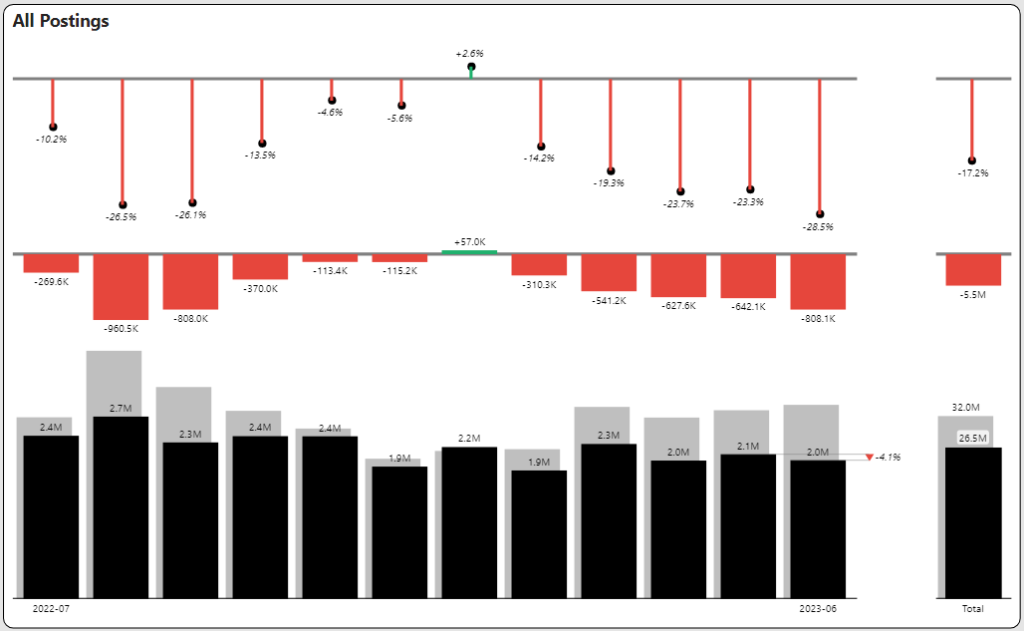
In the graph below, we see that posting volumes are 23-28% below last year. June’s job postings were down 4% compared to May. In eleven out of the past twelve months (all but January), job postings have declined and nine of those months were double-digit declines.
There remains a disconnect between what we are seeing as job openings, and what we are seeing in actual hiring and job ads.
Open Days Suggests Continual Challenges
Job posting turnover tells a different story. We measure estimated fill dates based on ad expiration or removal. Average fill days for job postings over the past four quarters have increased from 51 days in the comparable periods in 2022 to 59 days. This may seem like cause for concern, but it doesn’t tell the whole story. When we look at the average age of open job postings for the past fifteen months, we find that the average age is now 126 days, which has increased from 108 days for the previous month.
The graph below shows the average aging of open postings by month. We construct the aging dates from the first (or parent) posting.
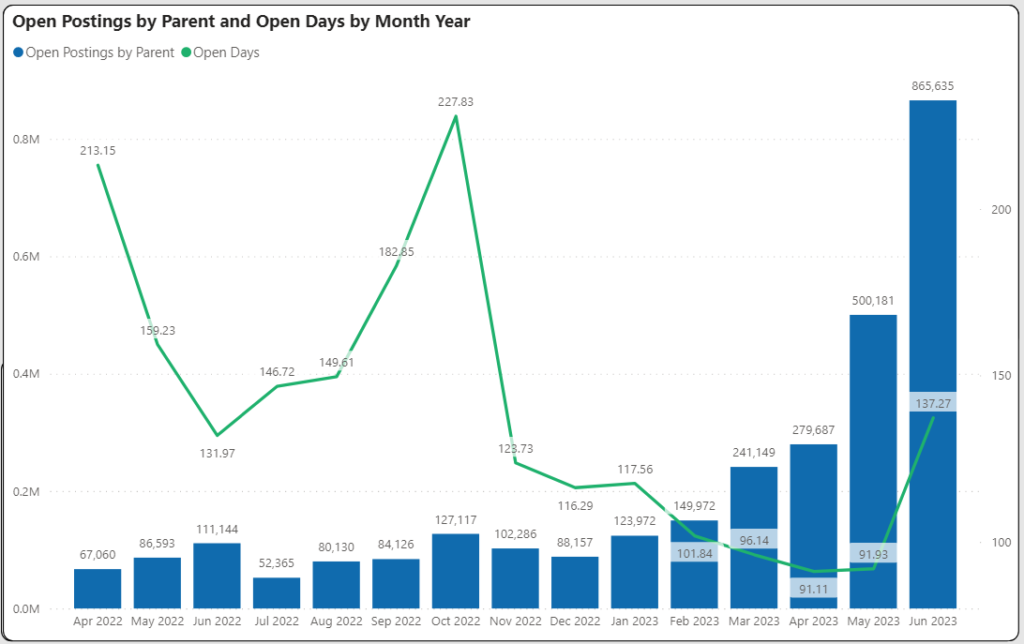
June open postings are substantially older than May and April respectively. Simply put, 20% of postings go unfilled. This is similar to the large number of job openings out of step with posting volume.
Labor Force Participation is the Key
Labor force participation is basically the number of people who want to work (employed and unemployed people) divided by the eligible population of those who could work (total working-age population 16 and over less institutionalized and armed forces). This number has slowly climbed out of the hole since the pandemic and is now equal to pre-pandemic levels at 63%. Further, this rate is now pretty much where it was in 2015.
The challenge is that this number HAS to get bigger. First, it is still historically low. The graph below shows the long-term labor participation rate since 1948.
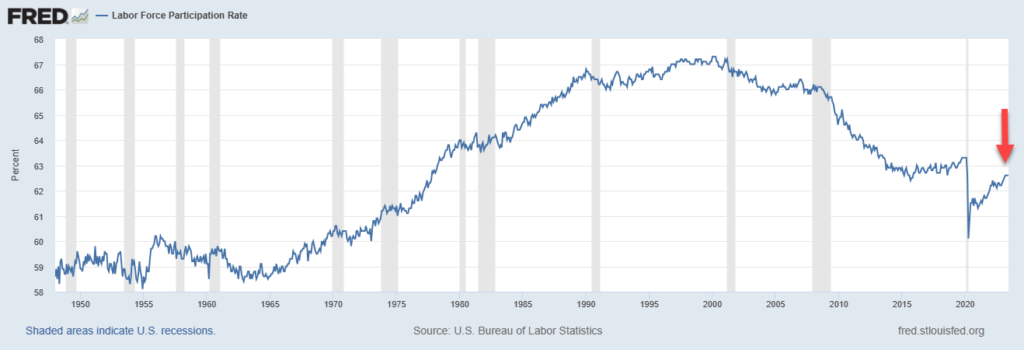
The rates now are roughly equivalent to where they were in the mid to late 1970’s. Small differences mean a lot. For example, if labor force participation increased from 63 to 67%, the number of new entrants into the labor market would go up TEN million. This is enough to wipe out the current job openings that have been captured in surveys for several years now.
Labor Force Participation By State
There are many different ways to look at labor pools. This month we focused on regional pools of talent. The table below ranks low to high state labor force participation rates from early 2020 to June 2023.
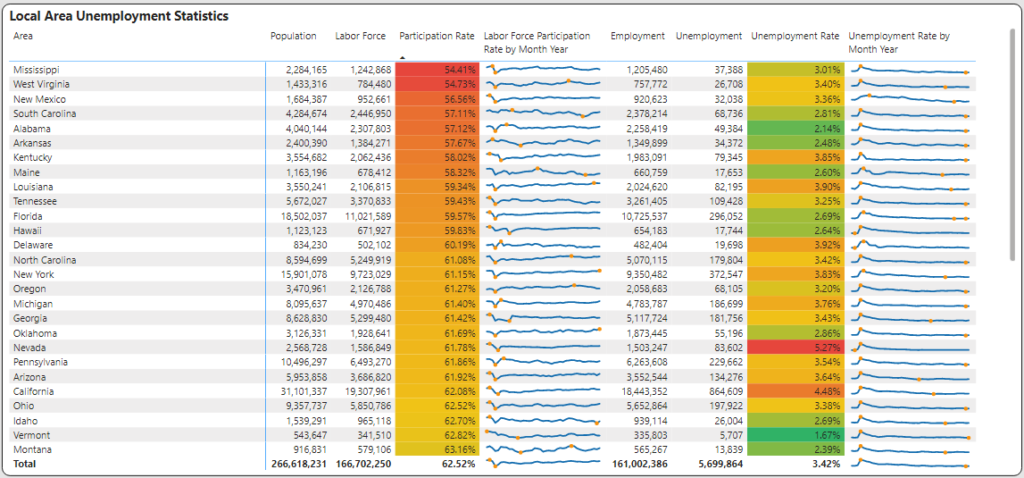
The sparkline graph is helpful because it time-phases the participation rate. The two orange dots represent the high and the low value. Mississippi and West Virginia have labor force participation rates that are approaching 50% despite extremely low unemployment. In other words, half of the population (in theory) could work, but choose not to work. Further, the low participation rate reached during the pandemic has never been fully recovered.
In the graph below we show the states where the opportunities lie.
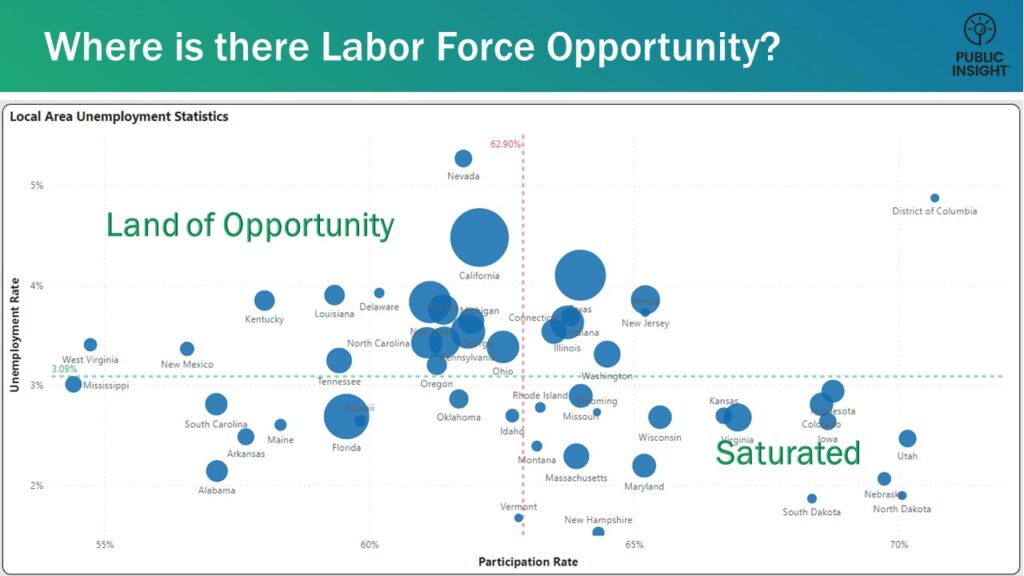
States in the lower right quadrant have high participation rates (X-axis) compared to the rest of the country and low unemployment rates (Y axis). We have labeled these states “Saturated”.
States in the upper left quadrant have low participation rates and comparably high unemployment (although still low by historical standards). We have labeled these states “Land of Opportunity”.
Getting more people to work requires identifying who they are and how might they be motivated to enter or re-enter the work force. We will cover this in future blog posts.
Get More June 2023 Jobs Report Insights
Sign up to watch our Jobs Report Video for even greater insights on this topic and receive supplemental reports and market data every month.
What is TalentView?
These insights were generated from our TalentView job market data and analytics solution. Integrate our job market data into your application, or use our self-service analytics platform. Learn more and watch a demo.