Our September 2023 Jobs Report indicates we are seeing moderation in compensation levels as inflation has also moderated. On a composite basis, wages were flat from Q2 2023 to Q3 2023. However, this moderation was not uniform across occupations. Some occupations in fact experienced declining wages as we discuss below.
In this month’s report, we also look at:
- Posting volumes continue to show declines despite BLS increase in job openings.
- Q3 fill days thus far are at 50 days, a marked improvement over the 66 days in Q2.
- The average open posting aging shows continued improvement at 90 days.
- Supply/demand showed some improvement in health care, but challenges remain.
Moderating Compensation
Compensation showed resilience in 2022 in keeping pace with inflation, and continued into 2023 with increases typically in the 7-8% range. With inflation moderating, we took a fresh look at the most recent compensation levels from the past six months. Compensation across occupation major groups is uneven.
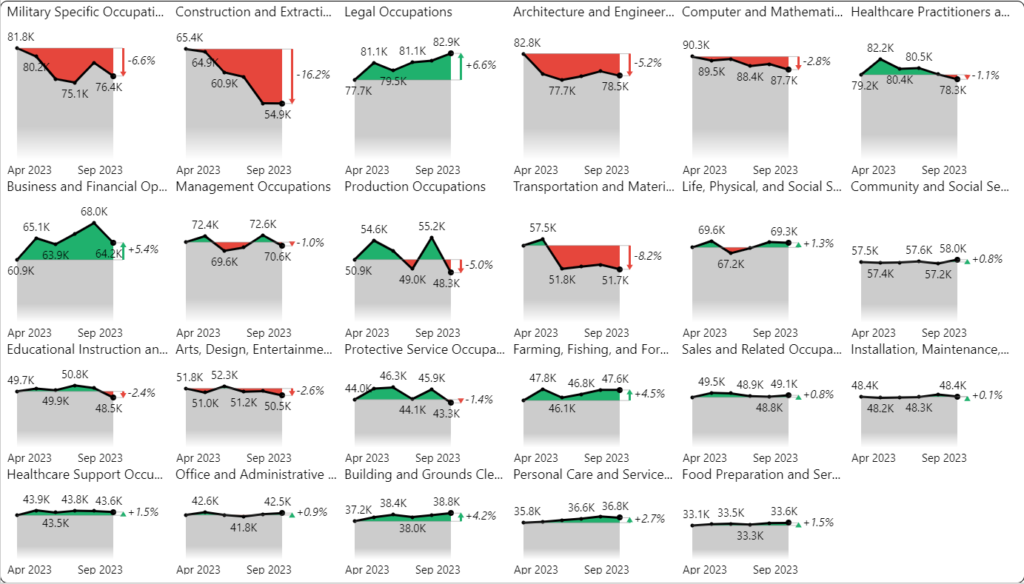
- Construction and Transportation declined, but these occupations are highly cyclical.
- Architectural and Engineering and Computer and Math occupations declined, but this is likely due to layoffs during the summer.
- Entry level occupations such as Personal Care and Food Preparation experienced nominal increases, which were below the current level of inflation.
- Healthcare Practitioners and Healthcare Support occupations were essentially flat during the period.
- Legal, Business and Financial Operations experienced the largest increases.
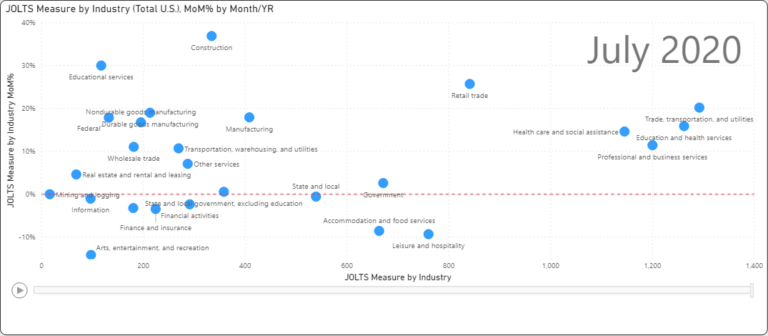
Posting Volume Continues Slide
The BLS JOLTS August job openings surprised many people coming in at 9.6 million, an increase of 8% after several months of decline. Job openings remain 25% above pre-pandemic levels. The increase in openings appear largely due to a reversal of recent layoffs in the Professional and Business Services and Financial Activities sectors.
Job postings declined 10% in September and 19% on a year-over-year basis. Posting volumes have declined between 15 and 20% over much of 2023. Urgent rates (percentage of jobs flagged as urgent) increased from 12% to 16% in the third quarter. Reposting rates also have improved thus far in the third quarter declining to 31%.
Open Days Continues Improvement
Over the course of the pandemic recovery, job postings’ open days have been steadily rising. Starting in July we began to see improvement, which continued into August with a slight increase in September, but still less than June.
The following chart analyzes the composition of the 2.9 million open job postings as of September. Approximately 1/3 of the open postings are from the most recent month of September. The line graph (in red) represents open days and is calculated based on the first occurrence of the postings or the “parent” job postings.
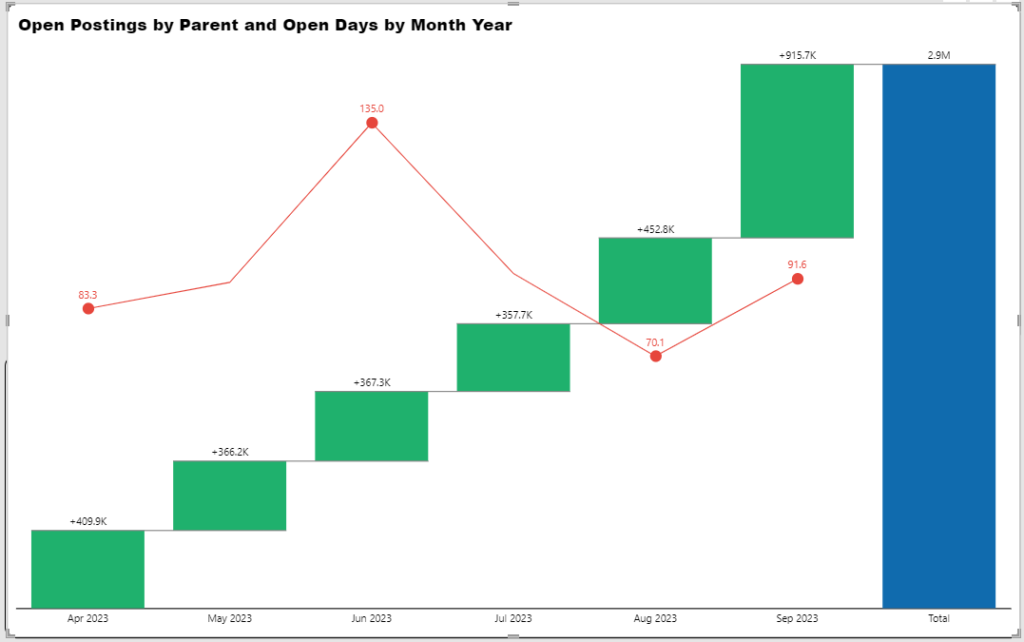
Open days has moderated in recent months after months of escalation. The age of the trailing six months as a composite is 92.7 days over all the months and 91.6 days for September, the most recent month.
Fill days in the third quarter also improved to 50 days in the quarter from 66 days in the second quarter.
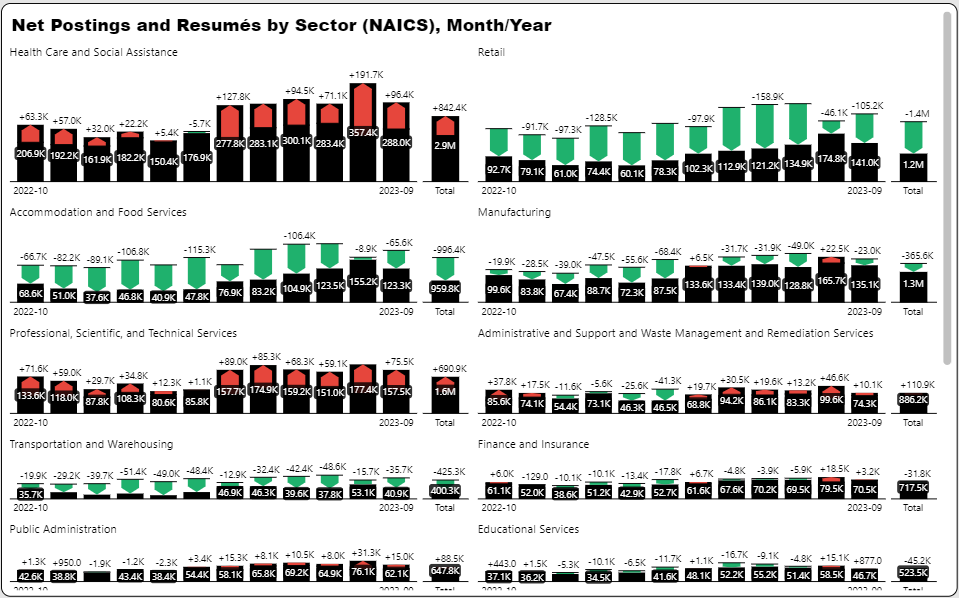
Supply/Demand Challenges Continue
Health Care showed some improvement in supply/demand, but still noticeably stressed. In the graph below the inner black bar graph represents job postings and the outer colored bar is the number of active resumés. Red indicates a shortage of job seekers compared to postings and green indicates job seekers exceeding job postings. Our time horizon here is the past 12 months.
For the past twelve months, there is over 30% less resumés than job postings in Health Care. An influx of job seekers in Accommodation and Food Services boosted the twelve-month supply twice as high as job postings. Despite recent layoffs, the Professional, Scientific, and Technical Services sector continues to have a substantial shortfall of workers. Finance and Insurance on the other hand is at parity (job seekers = job postings).
Get More September 2023 Jobs Report Insights
Sign up to watch our Jobs Report Video for even greater insights on this topic and receive supplemental reports and job and talent market data every month.
In this video, learn more about: Jolts insights, Detailed Quarterly Postings Summary, and Talent Migration Trends
What is TalentView?
These insights were generated from our TalentView talent market intelligence solution. Integrate our market data into your application, or use our self-service analytics platform. Learn how TalentView can help with talent sourcing, competitive benchmarks, employer brand measurement and business development and watch a demo.