Workforce Analytics
Unique workforce analytics – migration insights identify workforce shifts and new talent pools. This helps optimize talent acquisition and workforce development strategies.
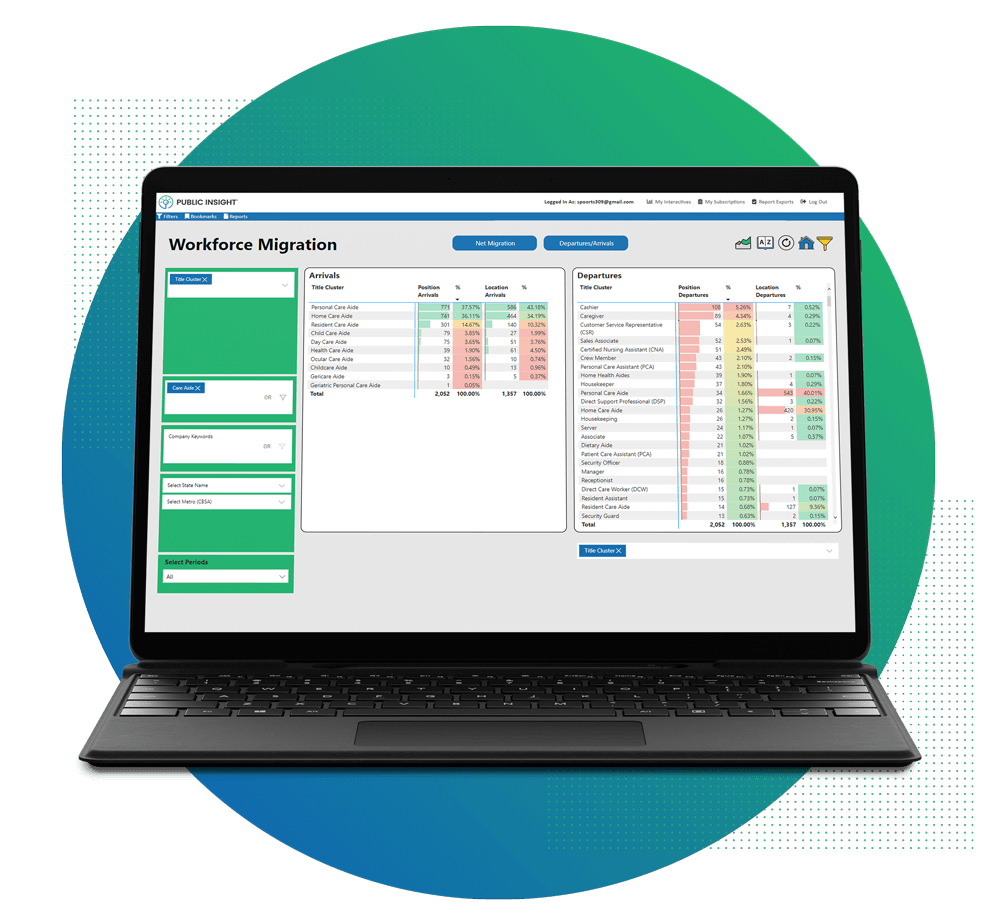
Workforce Analytics – Migration Insights
Workforce analytics – migration insights enable targeted analysis to see worker movement for specific companies, titles, and regions.
It can also be used for broader labor market insights such as understanding workforce shifts across industries and regions.
Job Seeker Movement
Job seeker bi-directional movement (arriving and departing) is captured via resumé changes and visualized across companies, regions, titles and education. This analysis uncovers new talent pools and identifies where specific employee titles at a company are moving. This is in addition to our net migration analysis, which shows the net change to a single category.
Use Case Examples:
- HR leaders can understand shifts and relocation trends from their former employees and their competitors’ employees.
- Combined with TalentView’s Supply and Demand Insights, recruiters can determine the most desirable locations where workers are migrating, and of these, which have the optimal supply and demand ratio.
- Recruiters can view which industries and locations have lost workers in order to target alternate sources of workers.
- Workforce and economic development organizations can utilize insights such as industry and location shifts to help develop policies, resources and programs.
Active Resumé Counts
View current and former employee active resumé counts by company, job title and location.
Use Case Examples:
- This can help employers understand where to proactively prevent talent from leaving.
- Employers can also benchmark their employee’s resumé activity against the competition and the broader industry.
Dashboard and Report Filtering
Instant analysis viewing using any combination of titles, occupations, colleges, and education levels. Over 150 job market metrics can be analyze and compared.
Customized Reports
Generate reports automatically with pre-curated dashboard visuals and dynamically applied filters.
User Management
Deploy and manage application access and usage across the enterprise.
By the Numbers
A wealth of data, curated and optimized for effortless usability.

60+ Million
Application Resumés
9 Million Resumés
Have changed from 2021 to 2022