Our March 2024 Jobs Report indicates we are still on a positive track this year. There are also some very interesting trends for March. Our TalentView solution generated the insights below. TalentView provides current talent/job market insights segmented by job title, employer/company, industry, location and more. Insights can be analyzed over time periods and benchmarked against competitors.
Key Postings Takeaways from the March 2024 Jobs Report
- Job postings increased 8.6% in March from the short month of February.
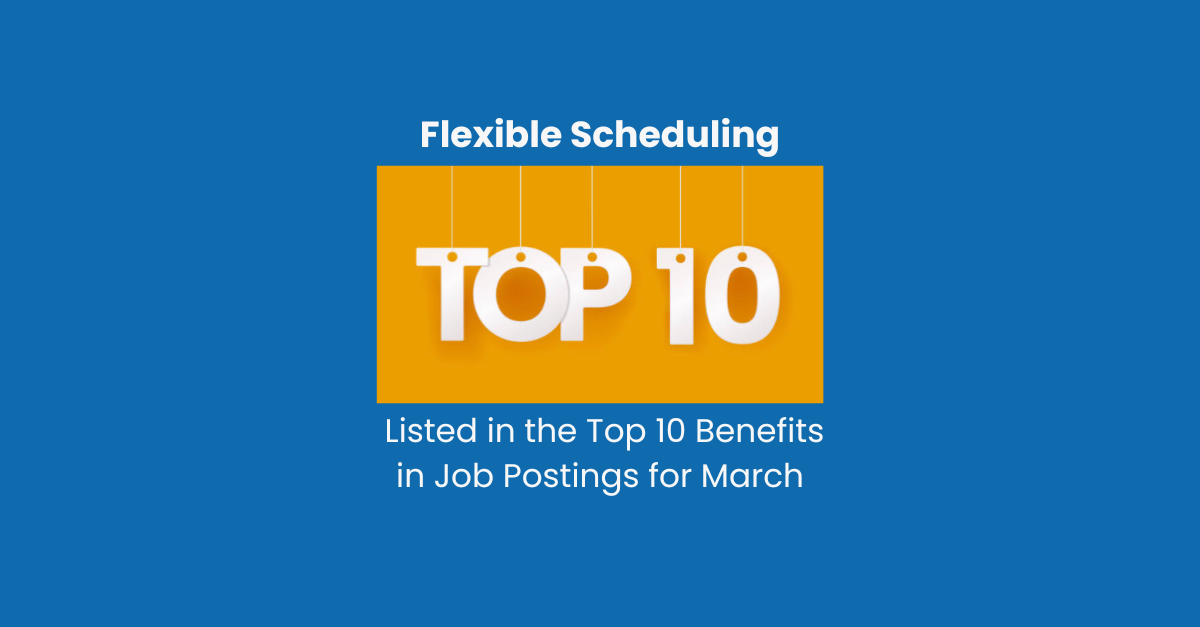
- Flexible scheduling is now in the top 10 benefit categories.
- Fair chance jobs soared 29% and now represent 3.3% of all jobs.
- Fill days and open days showed little change.
Flexible Scheduling Cracks the Top 10 Benefit Categories
Advertising flexible scheduling as a benefit in postings increased nearly 20% in March. This benefit category grew the highest of any other benefit category. It has now cracked the top ten most offered benefits as shown below passing bellwethers such as disability insurance and tuition reimbursement.

Fair Chance Jobs Show Strong Growth
We have been tracking Fair Chance jobs now since the beginning of 2023. These jobs provide opportunities for candidates that might otherwise be excluded because of a criminal record. These jobs started out like gangbusters last year and then flattened. However, March 2024 showed a considerable jump with these jobs increasing 29% and now at record highs. This is still a small percentage of the overall market at 3.3% but quickly gaining steam as employers look for ways to employ underserved populations.

Fill Days
We calculate fill days based on a presumptive hire date from when an ad is first posted (or the parent posting) to when it expires or is withdrawn. This metric is most applicable for months or quarters, which is the timeframe that most jobs are estimated to be filled.
The graph below shows the fill days by month along with the percentage of ads that have been filled. Obviously, the newer ads have a lower fill rate, but we can still draw some conclusions based on the ads that have been filled.
Fill days held steady in the mid-fifties based on the trailing 15 months of activity. The high point was 64 days and the low point in the summer was 43 days.

Open Days
Open days are postings that are still determined to be open. We track every job posting uniquely and ascertain its fill status on a weekly basis. Generally we have found that six to nine months to be a good time horizon to evaluate the open days. Older postings may distort the open days as they may represent “evergreen” postings. Open days as a composite for the last six months ticked up slightly from 82 to 83 days with 34.3% of the ads from that time period still open.

Compensation
Overall Compensation Composite
March shows a compensation decrease (on a composite basis) of 1.1% to $53,900 across all job postings. Compensation by and large has moderated as inflation has moderated. The trailing 12-month compensation change currently stands at 5.9%.

By Sector Compensation

Get More March 2024 Jobs Report Insights!
Sign up to view our complete March Jobs Report for even greater insights on comp, supply/demand, labor market trends and more and receive supplemental reports and talent market intelligence every month.
What is TalentView?
Public Insight develops TalentView, a talent market intelligence solution that generated these insights. We offer flexible insights delivery via data integration, self-service analytics platform and reports service. Learn how TalentView can help inform/justify recruiting decisions and ad budgets, benchmark competitors and identify sales opportunities for solution providers.
Schedule a meeting to discuss how you can leverage job/talent market insights.