The March 2023 Jobs Report gives us a glimmer of hope based on higher open posting volume and less average open days. I am a contrarian by nature. I very rarely accept things at face value without questioning their validity. I did not believe the record BLS job openings number when every other indicator seems to show a softening labor market. I also don’t believe the news of mass layoffs either as the data would also suggest otherwise.
So as a contrarian, I don’t see the news of job openings “easing” to 9.9 million as big news. The reality is that 9.9 million job openings would still be a record number pre-pandemic. There are other indicators however, that suggest a softening of the labor market, and then there are others that suggest that we are simply returning to the bounds of normal.
Job Postings are Indeed Soft
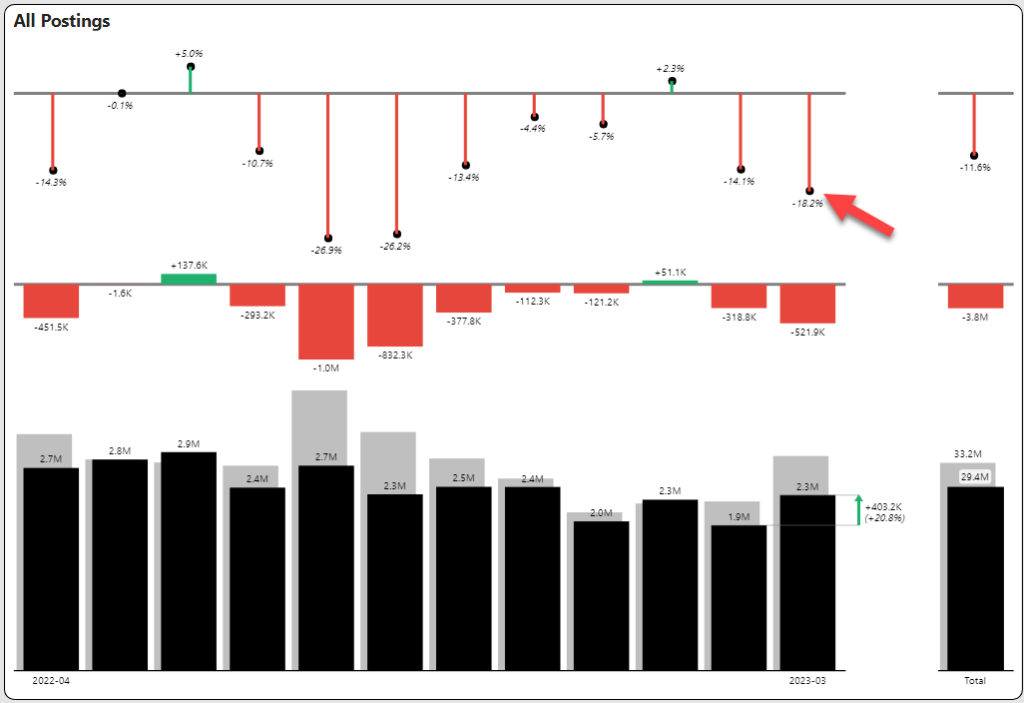
Job postings remain soft. Our assessment of job postings for March shows an 18% year-over-year decline as shown below (at the red arrow). Further, job postings have declined in nine of the past twelve months and six of those months have seen double digit declines. The top red line graph shows the year-over-year percentage declines, and the red bar graph shows the numbers. The bottom bar graph shows the current year (dark black) against the prior year (gray).
Improvement in Postings Quality is Reason for Optimism
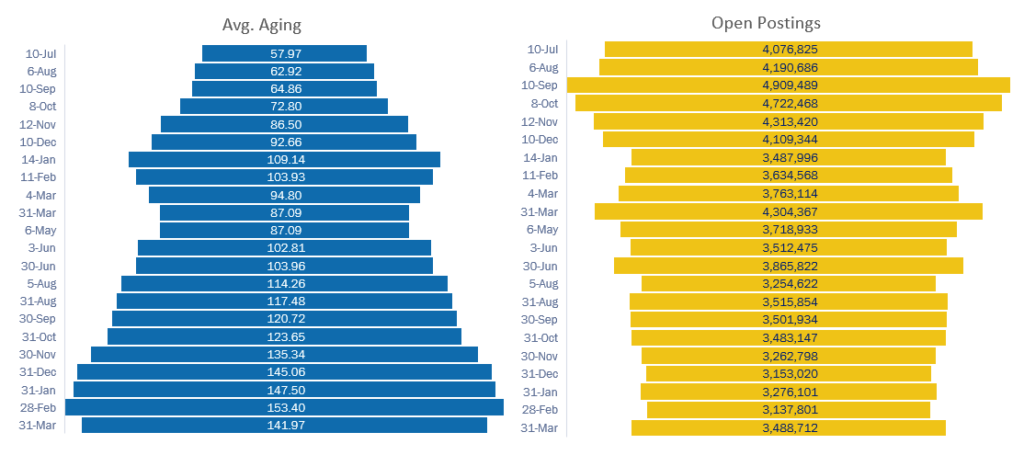
Prior to March, the average age of open postings had been in a freefall for many months. Further we have seen a trend over the past year where the age of open jobs has been steadily increasing since the pandemic. This accompanied by decline in open job postings is a double whammy, because both quantity and quality are eroding.
The March 2023 Jobs Report open job postings reversed that trend in that the number of average days in open postings declined to 142 days whereas the number of open postings increased to nearly 3.5 million. The funnel chart below shows the comparison of aging and the number of open postings.
How do we rationalize this with a decline in job openings from BLS?
Since openings come from surveys, the way I like to think about it is that job openings are what an employer would like to do, but job postings are what they are actually doing. The postings are a preliminary signal of where we think the market is going. We have seen postings and their quality decline for many months. There is now a glimmer of hope that we may be at the beginning stages of a return to normality of both posting volume and average open days. This is especially true when you consider that job openings were artificially inflated to unheard of levels.
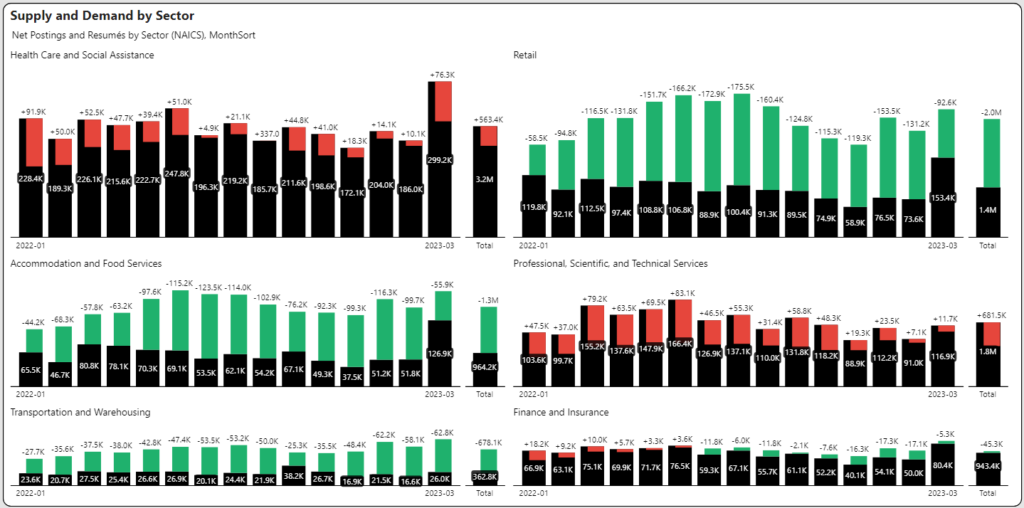
Supply/Demand Uneven Across Sectors
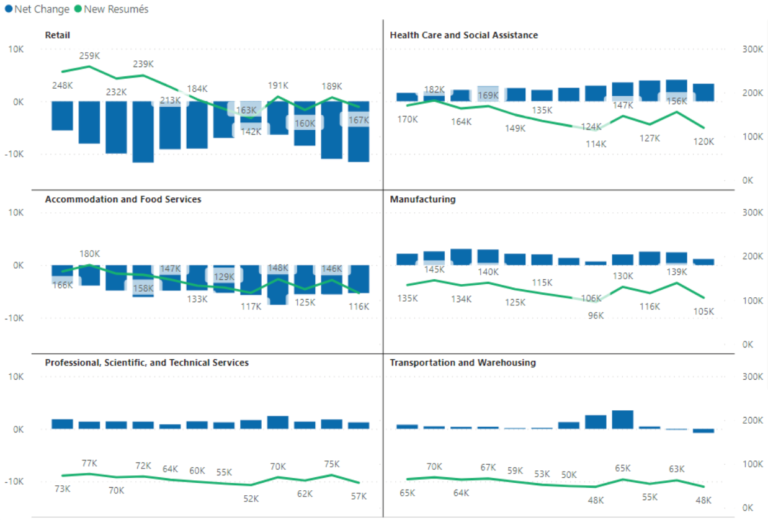
One of the measures of supply/demand is comparing job seekers (based on resumés) against job postings. The inline green bar below indicates the supply of job seekers exceeding demand (measured by job postings). There are still plenty of job seekers for entry level jobs in retail and accommodation and food services. On the other hand, the industries with a larger red inline bar (e.g., healthcare and professional services) have supply/demand that continues to be stressed with significantly more demand than there is supply.
Equilibrium is obtained when we see the total black column “balanced” to the outer column. In other words, we see little red or green. In this case, finance and insurance and professional, scientific, and technical appear to be approaching this equilibrium. There is still plenty of job seekers in retail and accommodation and food services, but the margin may be shrinking as employers are having better success filling these positions.
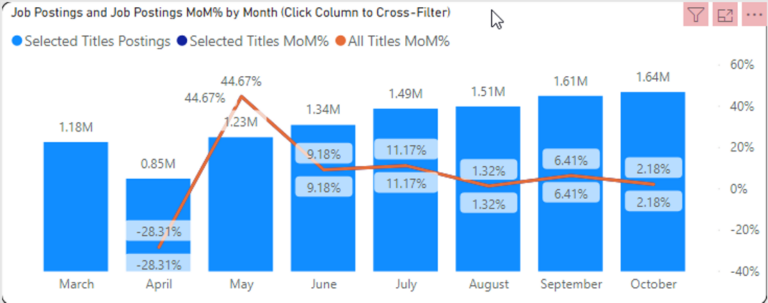
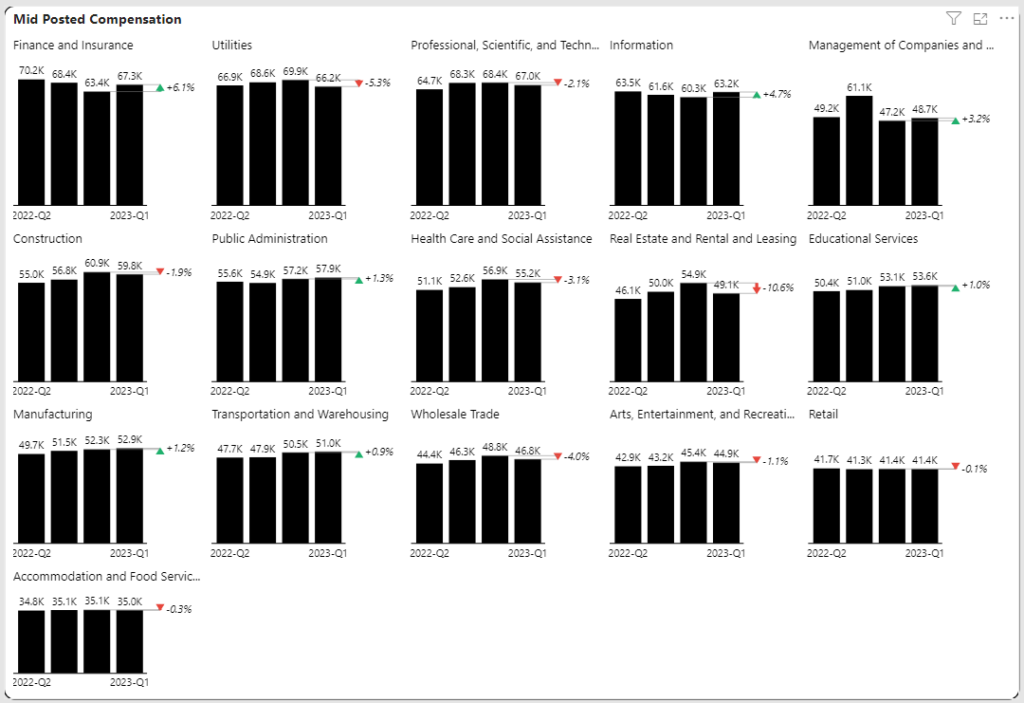
Compensation Increases are Moderating
Compensation seems (after quarter over quarter increases) to be leveling off. The percentages here show the increase or decrease in advertised wages for each of the past four quarters by industry. While wages as a whole have risen substantially to keep pace with inflation, the pace has noticeably leveled off.
The Pandemic Workplace Sentiment Penalty
The pandemic greatly impacted worker happiness. We measure workplace sentiment in our TalentView platform using net promoter score (or NPS) based on reviews. Net promoter score is calculated based on the percentage of positive over negative reviews. Neutral or mixed reviews are not factored into this calculation. A typical NPS score that is 20 is good and over 50 is exceptional. Prior to the pandemic, we hovered in the low twenties. The pandemic caused a precipitous hole that we have been climbing out of ever since. The graph below shows the impact of the pandemic in red.
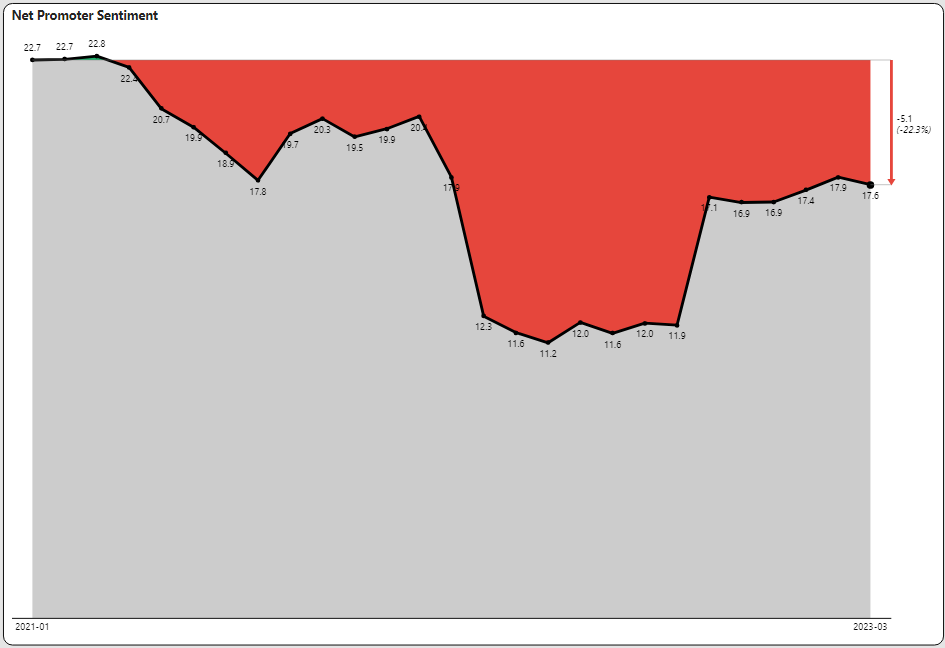
The problem is that we may never get out of that hole. Right now, we have a 22% pandemic penalty tax on workplace sentiment. How will employers get out of this hole is to look carefully at what is driving that declining sentiment. This is where opinion mining can help, because it lends actionable insights to this number. For example, work-life balance may be more important than compensation. Communication, culture and management are always hot topics.
Get More March 2023 Jobs Report Insights
Sign up to watch our Jobs Report Video for even greater insights on this topic and receive supplemental reports and market data every month.