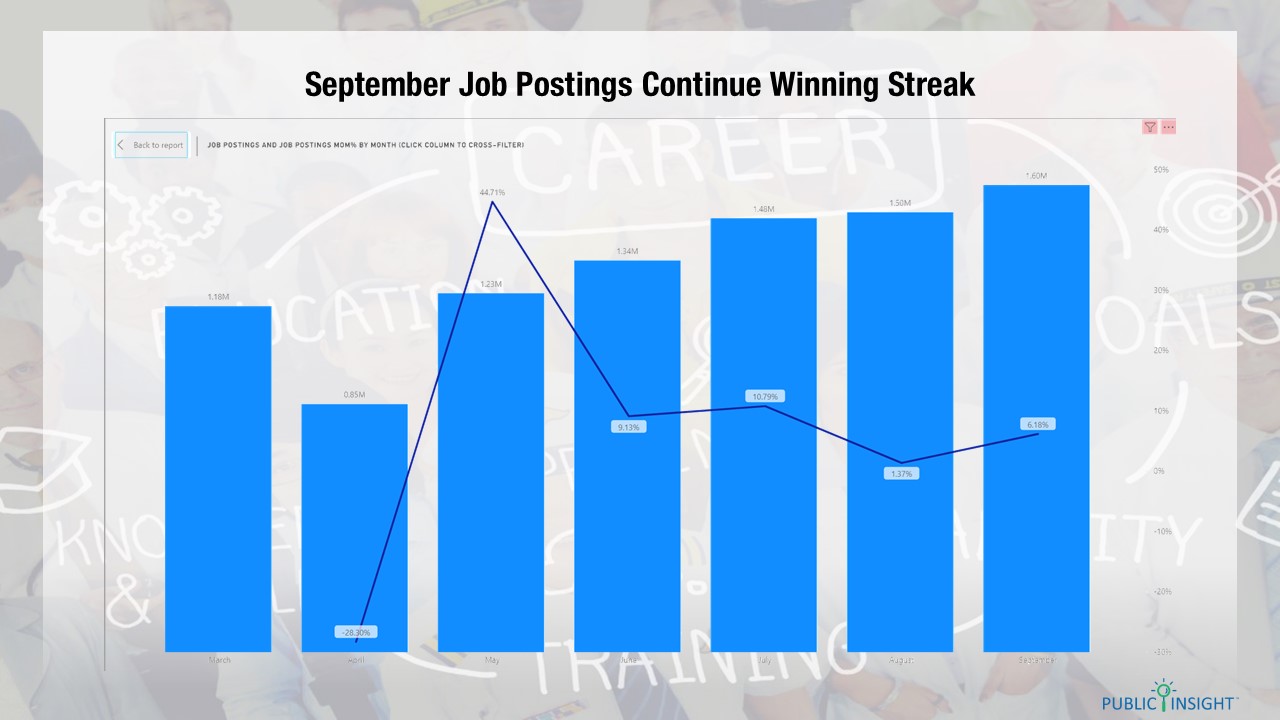
Job Postings Up 6.2%, Yet Challenges Remain

September Indeed job posting activity sustained a now five-month winning streak as job postings increased 6.2% during the month. Indeed job postings for the month of September were 1.6 million compared to 1.5 million in August and are now at pre-pandemic levels. View our complete summary findings that were part of the September Labor Market Webinar presented by Public Insight on October 8, 2020.
This data is included in the Insight for Work self-service jobs and labor analysis application.
Sign Up for Monthly Webinar
Job Posting Activity By Weekday
The postings by weekday seem to suggest that the strength continued into October. Postings are cyclical by day and when examining growth during the month, it is helpful to look at it by the day of the week. The graph to the right shows the posting activity by weekday. The largest single posting day of the month occurred on Tuesday, September 29.

Food Service Finally Shows Growth
Occupational categories showed some growth in areas where there had been challenges.
- Food preparation and serving occupations finally showed some job posting growth in September after months of declines. These occupations have been severely impaired perhaps permanently, so this is good news.
- Office and administrative occupations showed strong growth and exceeded managerial occupations suggesting finally a return to office support workers.
- Transportation and material moving occupations finally declined after months of growth. We had seen substantial movement in delivery workers (“people moving stuff”) during the summer months.
- Construction occupations likewise had a strong summer and have come back down.

Dealing with the Pandemic Layoff Backlog
While it is cause for encouragement that job postings continue to increase, there will have to be significant forward momentum to cover the layoffs from March and April. The most recent data from the Bureau of Labor Statistics Job Openings and Labor Turnover Survey (JOLTS) indicates it will take many months of accelerated hiring to get employment back to pre-pandemic levels.
- As indicated in the following graph, in the months of March and April, nearly 24 million workers were either laid off or quit. This compares to normal separations levels of just under 11 million workers.
- This created a backlog of about 13 million displaced workers.

Like the foreclosures created by the housing crisis, there must be accelerated hiring activity to cover this shortfall. At this point, job openings and hires have barely made a dent in this backlog. The trailing twelve months of hiring and job postings indicate that hires are basically at pre-pandemic levels, but job openings are still lagging slightly behind pre-pandemic levels. Remember this data is one month behind job postings (September vs. August). Further, hires have surpassed job openings suggesting that existing workers are being called back to work as job openings are published jobs to the public.

Much of the existing job hiring activity is fueled by federal government hires which were up nearly 350% in August. August’s job openings were also strong in the manufacturing sector as shown in the scatterplot below. Retail trade and construction declined after strong summer growth.

About Insight for Work
Insight for Work is a self-service analysis platform for the labor market. It combines data from job postings, hiring company profiles and ratings, compensation and benefit surveys, applicant and resumé profiles, and government agency publications with the power of the Microsoft® Power BI business intelligence platform. Instantly analyze occupation, industry, and company opportunities and trends to evaluate strategies and programs and prioritize resources.