The jobs report 2023 year in review shows us last year was in many ways a reset year for the job market. The market has remained resilient despite the headwinds of inflation, slowing economy, and return to normal work patterns. We still have extremely low unemployment and solid job growth. Yet most people feel as though something is missing. It is hard to conclude that we are back to normal when we really do not know what normal is. What makes it therefore a reset year is the reshaping of what was previously normal work patterns. The agile employer will recognize the shifting landscape and adapt.
Our mission at Public Insight is to take all the noise in this market and turn it into meaningful, actionable insights. Each month we generate a job market report that provides insights into the previous month. Each year we attempt to look back on the previous year and see if there are observable themes. This paper summarizes the big-picture themes from 2023.
There is plenty to be encouraged about as we start out 2024:
- Unemployment is at multi-year lows
- Inflation has moderated and appears to be easing
- Job openings remain elevated
- Solid job growth continues
- Layoffs despite headlines are at multi-year lows
While consumer sentiment has improved in recent months, there is still a sense of pessimism in the air. There are persistent industry segments such as healthcare, professional, and financial where supply and demand is uneven at best. Workplace policies are shifting before our very eyes with no historical baseline. Most people recognize that the mandated work-from-home policies are past us, but the benefits remain attractive to employees.
Market analytics plays a huge role in understanding the pulse of an ever-changing market. Market analytics also serves to level set talent acquisition and employer reputation performance against peers and competitors. The job market can be properly understood and evaluated through this context setting.
Key Takeaways from Jobs Report 2023
- Labor market data suggests that employers still have a massive backlog of job openings on a shrinking labor pool, but 2023 posting activity does not back that up.
- Wages overall moderated during 2023, but certain in-demand roles continue to escalate.
- Imputed wages are now disappearing and wage transparency is the norm
- Supply/demand for entry-level jobs is now back to normal, pre-pandemic levels. However, there are still significant imbalances in selected sectors and positions.
- Worker sentiment has declined to levels below the worst point of the pandemic.
- Remote work as a form of workplace is moderating (hybrid) and declining (fully remote). Workplace policies that are fluid require effective communication and systems.
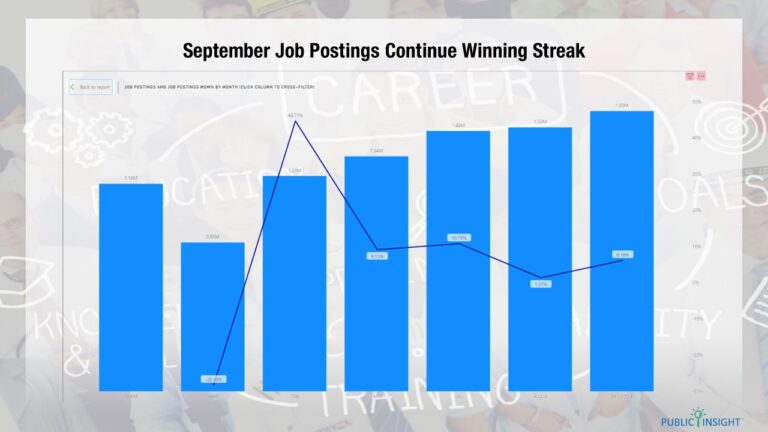
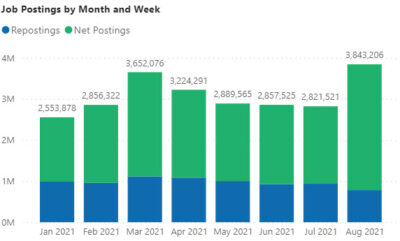
Job Posting Slows During Latter Half of 2023
Posting Volume Declines
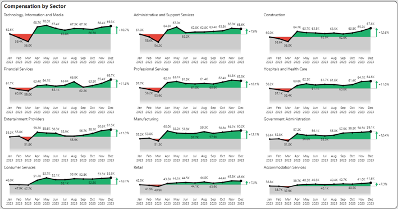
Postings started out strong in the spring and early summer only to peter out during the second half of 2023. Volumes declined on average 15-20% from the prior year. In the graph below the last nine months are shown. Posting volumes declined across sectors as shown below with the most notable declines in professional services and technology.
Moderating Compensation
Compensation increases were significant in the first half of 2023 and slowed in the latter part of 2023. Nevertheless rate increases over the course of 2023 ranged from 7-13%.
Job Posting Turnover
Job posting turnover measures how rapidly job postings are turning over. This consists of several key measures:
- Reposting rates indicate the percentage of jobs that are reposted, but do not factor in the number of times a job is reposted.
- Job posting intensity is a measure of how frequently a job is posted. For example, if the same job is posted twice, job posting intensity is two.
- Urgency indicators show the postings that are flagged as urgent. This is also a measure of the perceived need to fill the job.
- Estimated fill days (average) are based on the number of days from when an ad is first posted to when it expires or is withdrawn. This metric is most applicable for months or quarters, which is the timeframe that most jobs are estimated to be filled.
- Open days indicates the number of days a job posting has been open.
The following table shows the key posting metric statistics by quarter during 2023. The numbers have been adjusted to reflect consistency and comparability among the quarters.
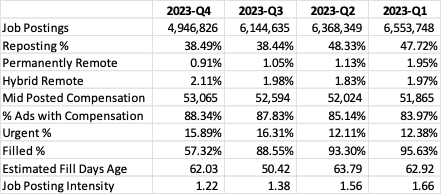
Reposting Rates and Job Posting Intensity
Reposting rates declined considerably in the third quarter and have remained in the 38% range, down from 48% earlier in the year. This reflects the slowing of postings. Further, job posting intensity, a measure of how often a job is posted, also declined.
Fill Days
Fill days ranged from 50 to 64 days during 2023. For the trailing 15 months approximately 82% of jobs have been filled.
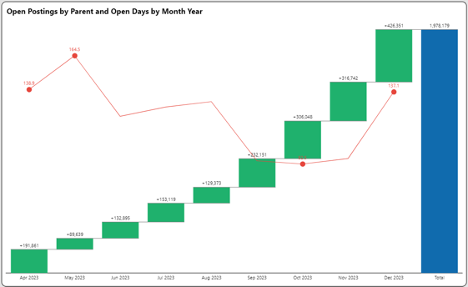
Open Days
The age of open postings for the trailing nine months of 2023 is 113 days. In the waterfall chart below, the columns show the composition of open postings whereas the line shows the age of the postings in each month. Keep in mind that this age is based on the first occurrence of the posting or the parent posting. The excess of postings in December for example are older postings as reflected in their 137-day age.
Pay Transparency is Here to Stay
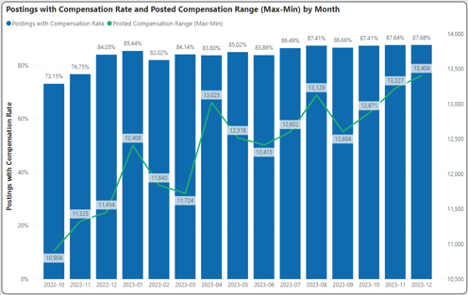
Hard to believe but at the end of 2021, only one in three job postings disclosed compensation. Pay transparency rapidly evolved because of state and local mandates, job board requirements, market pressures, and employer willingness.
Support for pay transparency is based on the desire to not only close pay gaps, but also to increase happiness, engagement and loyalty at work according to one survey from Indeed.
At the end of 2023, nine in ten jobs have pay disclosures on the Indeed® job platform. Further, it is a misnomer that employers will disclose jobs with a wide pay range. The graph below shows that the number of jobs with disclosed pay increased, and the compensation range (wage band) between high and low remained fairly level at $13,000. This is between 20-25% of the midpoint compensation.
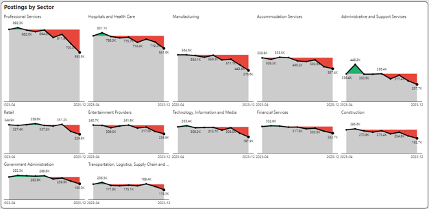
Supply/Demand Imbalances Moderate But Challenges Remain
Quit rates dramatically increased during the pandemic and workers changed roles, relocated, or even stood on the sidelines. As we emerged from the pandemic, quit rates have moderated and the mass exodus of workers has eased. That said, selective industries face acute shortages of workers to fill open positions.
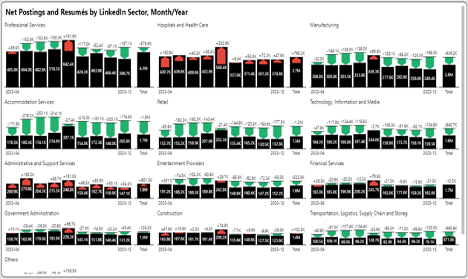
To highlight supply/demand imbalances, we superimpose job seekers based on resumés against net job postings (total postings less repostings). We can then look at this supply and demand in diverse ways. The graphs highlight supply surplus (more job seekers than net postings) shown in green. Supply shortage (less job seekers than net postings) are shown in red.
Want to read the rest of the insights?
Sign up for the Jobs Report 2023 Year in Review full report.
Get the full report and receive jobs reports and market data every month.