Endowments per Student Down in 2016

How financially fit is your institution? One of the measures that Forbes has used in assessing the financial fitness of postsecondary institutions is endowment assets per FTE. This metric takes the value of endowment assets at the end of the year and divides it by the number of FTE’s. In applying this data to over 2,000 institutions, we discovered that endowment per FTE decreased a little over 2% from 2015 to 2016. However, there are wide variations in and among institutions.


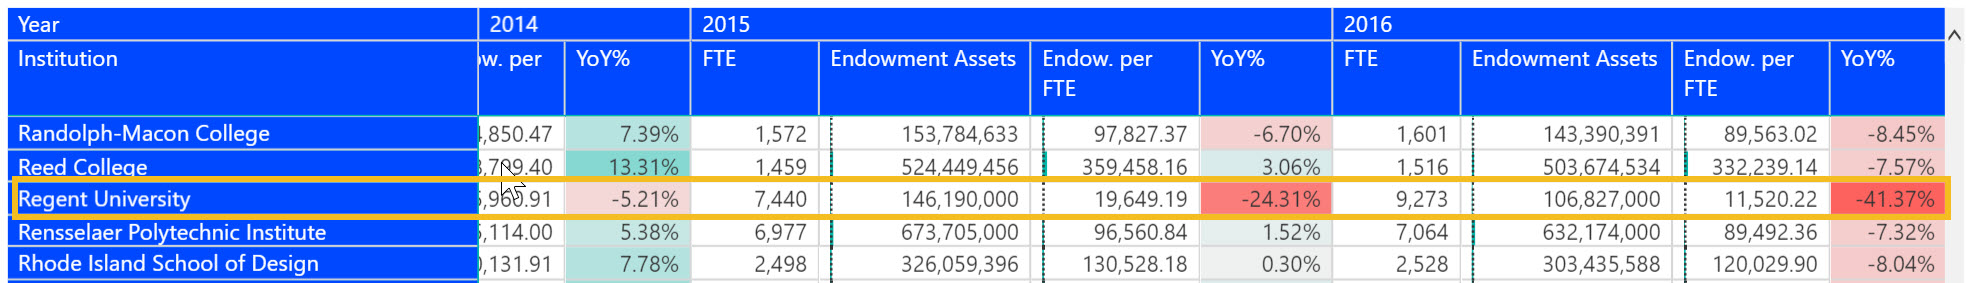
Clearly Ivy League schools can distort this metric. Princeton for example has an endowment per student of over $2 million. Endowments also can ebb and flow based on market returns. But discounting for this, you can see how an eroding endowment combined with a rising head count could have implications on financial margin. Regent University for example has had endowment assets decline to five year lows while FTE has actually gone up in 2016. This has resulted in an endowment per FTE decline of 41% and 21% over the past two years.


We recently updated the Finance Interactive to the most recent data released from IPEDS. This Interactive analyzes a whole host of financial metrics including endowments. You can purchase individual Interactives or license them under our Higher Education Institution library. Individual Interactives are priced between $195 and $295. 


We have also created a free Interactive that allows you to see what the trailing five year endowment per student is by institution.  You can individually select sectors or institutions and can also manipulate the thresholds of endowments and students. 

Share This Story

Similar Posts

  • Free-Lance Economy Continues Upward Climb

    Moonlighting used to be a term that described a minority of people. If you moonlighted, you were supplementing your income. You either did it for extra cash or because you had to just to pay the bills. The freelance economy and the growth of the personal transportation industry alone have…

  • Regional Variations in Opioid Prescribing Rates

    Given the state of the opioid crisis, any meaningful data is valuable. So when CMS released three years of Opioid Part D prescription data in November, we all rejoiced. CMS also released a mapping tool to analyze the data. While mapping tools can be effective, they can also get in…

  • The Race for Nurses

    There is a race that is brewing between millenials who are becoming registered nurses and the hiring that has started at U.S. hospitals. A Health Affairs study concluded that Millennials are becoming registered nurses at nearly twice the rate of baby boomers, but that still won’t necessarily prevent a nursing shortage…

  • Student Debt Continues to Rise – Repayments Flat

    Last week, the Government Accountability Offices announced that the federal government will forgive a whopping $108 billion in student loans in the coming years. Prognosticators project a coming economic doom as the student debt crisis approaches mortgage meltdown proportions.   Last week we focused on the earnings of students six…

  • What is the Newly Released Carnegie Data?

    The Carnegie Classification™ has been the major institutional framework for describing higher education institutions since 1970. This classification system comes out approximately every five years with the latest rendition released on February 1, 2016. This release represents the initial data provided by the Indiana University Bloomington Center for Postsecondary Research…

  • Outpatient Medicare Hospital Costs up 13%

    The 2016 outpatient procedure data shows overall hospital volume up 11% from 2015. Using data from the Outpatient Procedure Analysis Interactive, we also found that the volume times the average full cost (weighted average cost) on a procedure basis has increased 13.3%. We ran the numbers several ways – first…