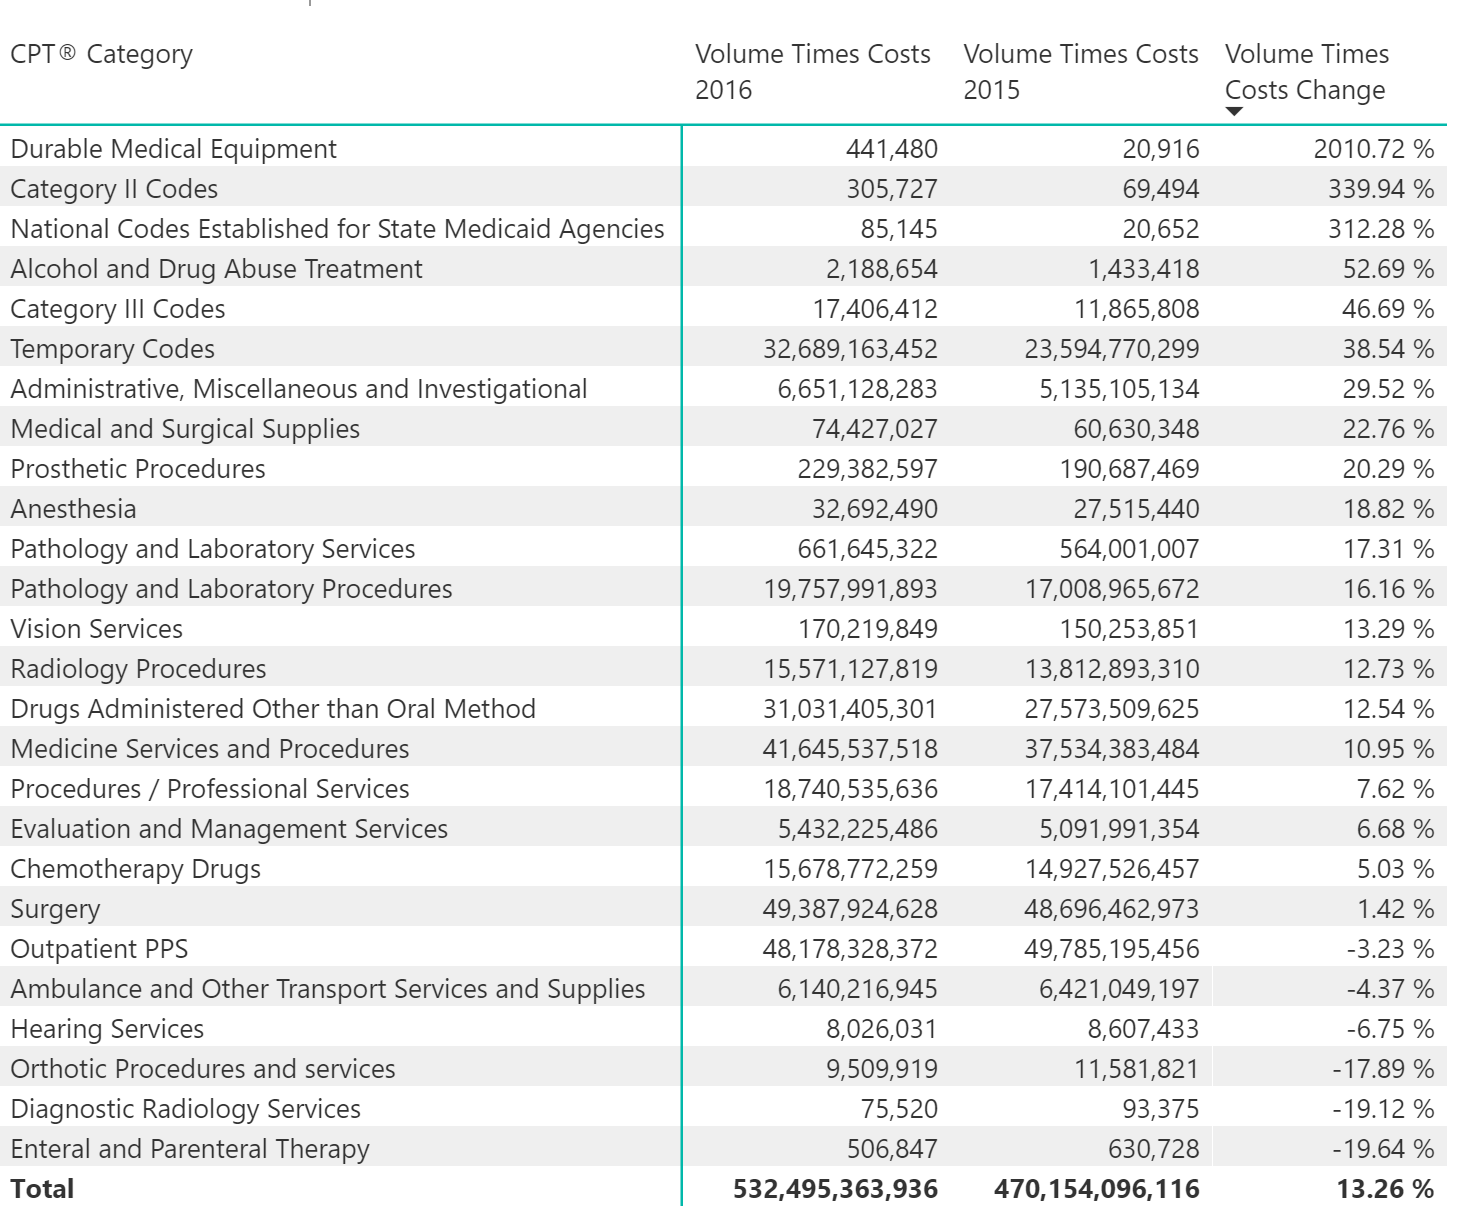
The 2016 outpatient procedure data shows overall hospital volume up 11% from 2015. Using data from the Outpatient Procedure Analysis Interactive, we also found that the volume times the average full cost (weighted average cost) on a procedure basis has increased 13.3%. We ran the numbers several ways – first by category of procedures as shown below. While the CPT® categories are not perfect, they reveal some interesting insights. Surgery for example, is relatively flat, but radiology costs are up nearly 13%. Pathology related procedures are up 17%.

We also ran the data by state to see what the dispersion in costs was geographically. Again, a pretty wide disparity with eight states experiencing cost changes above 20%.