Tuition Bears Increasing Brunt of Higher Ed. Revenue

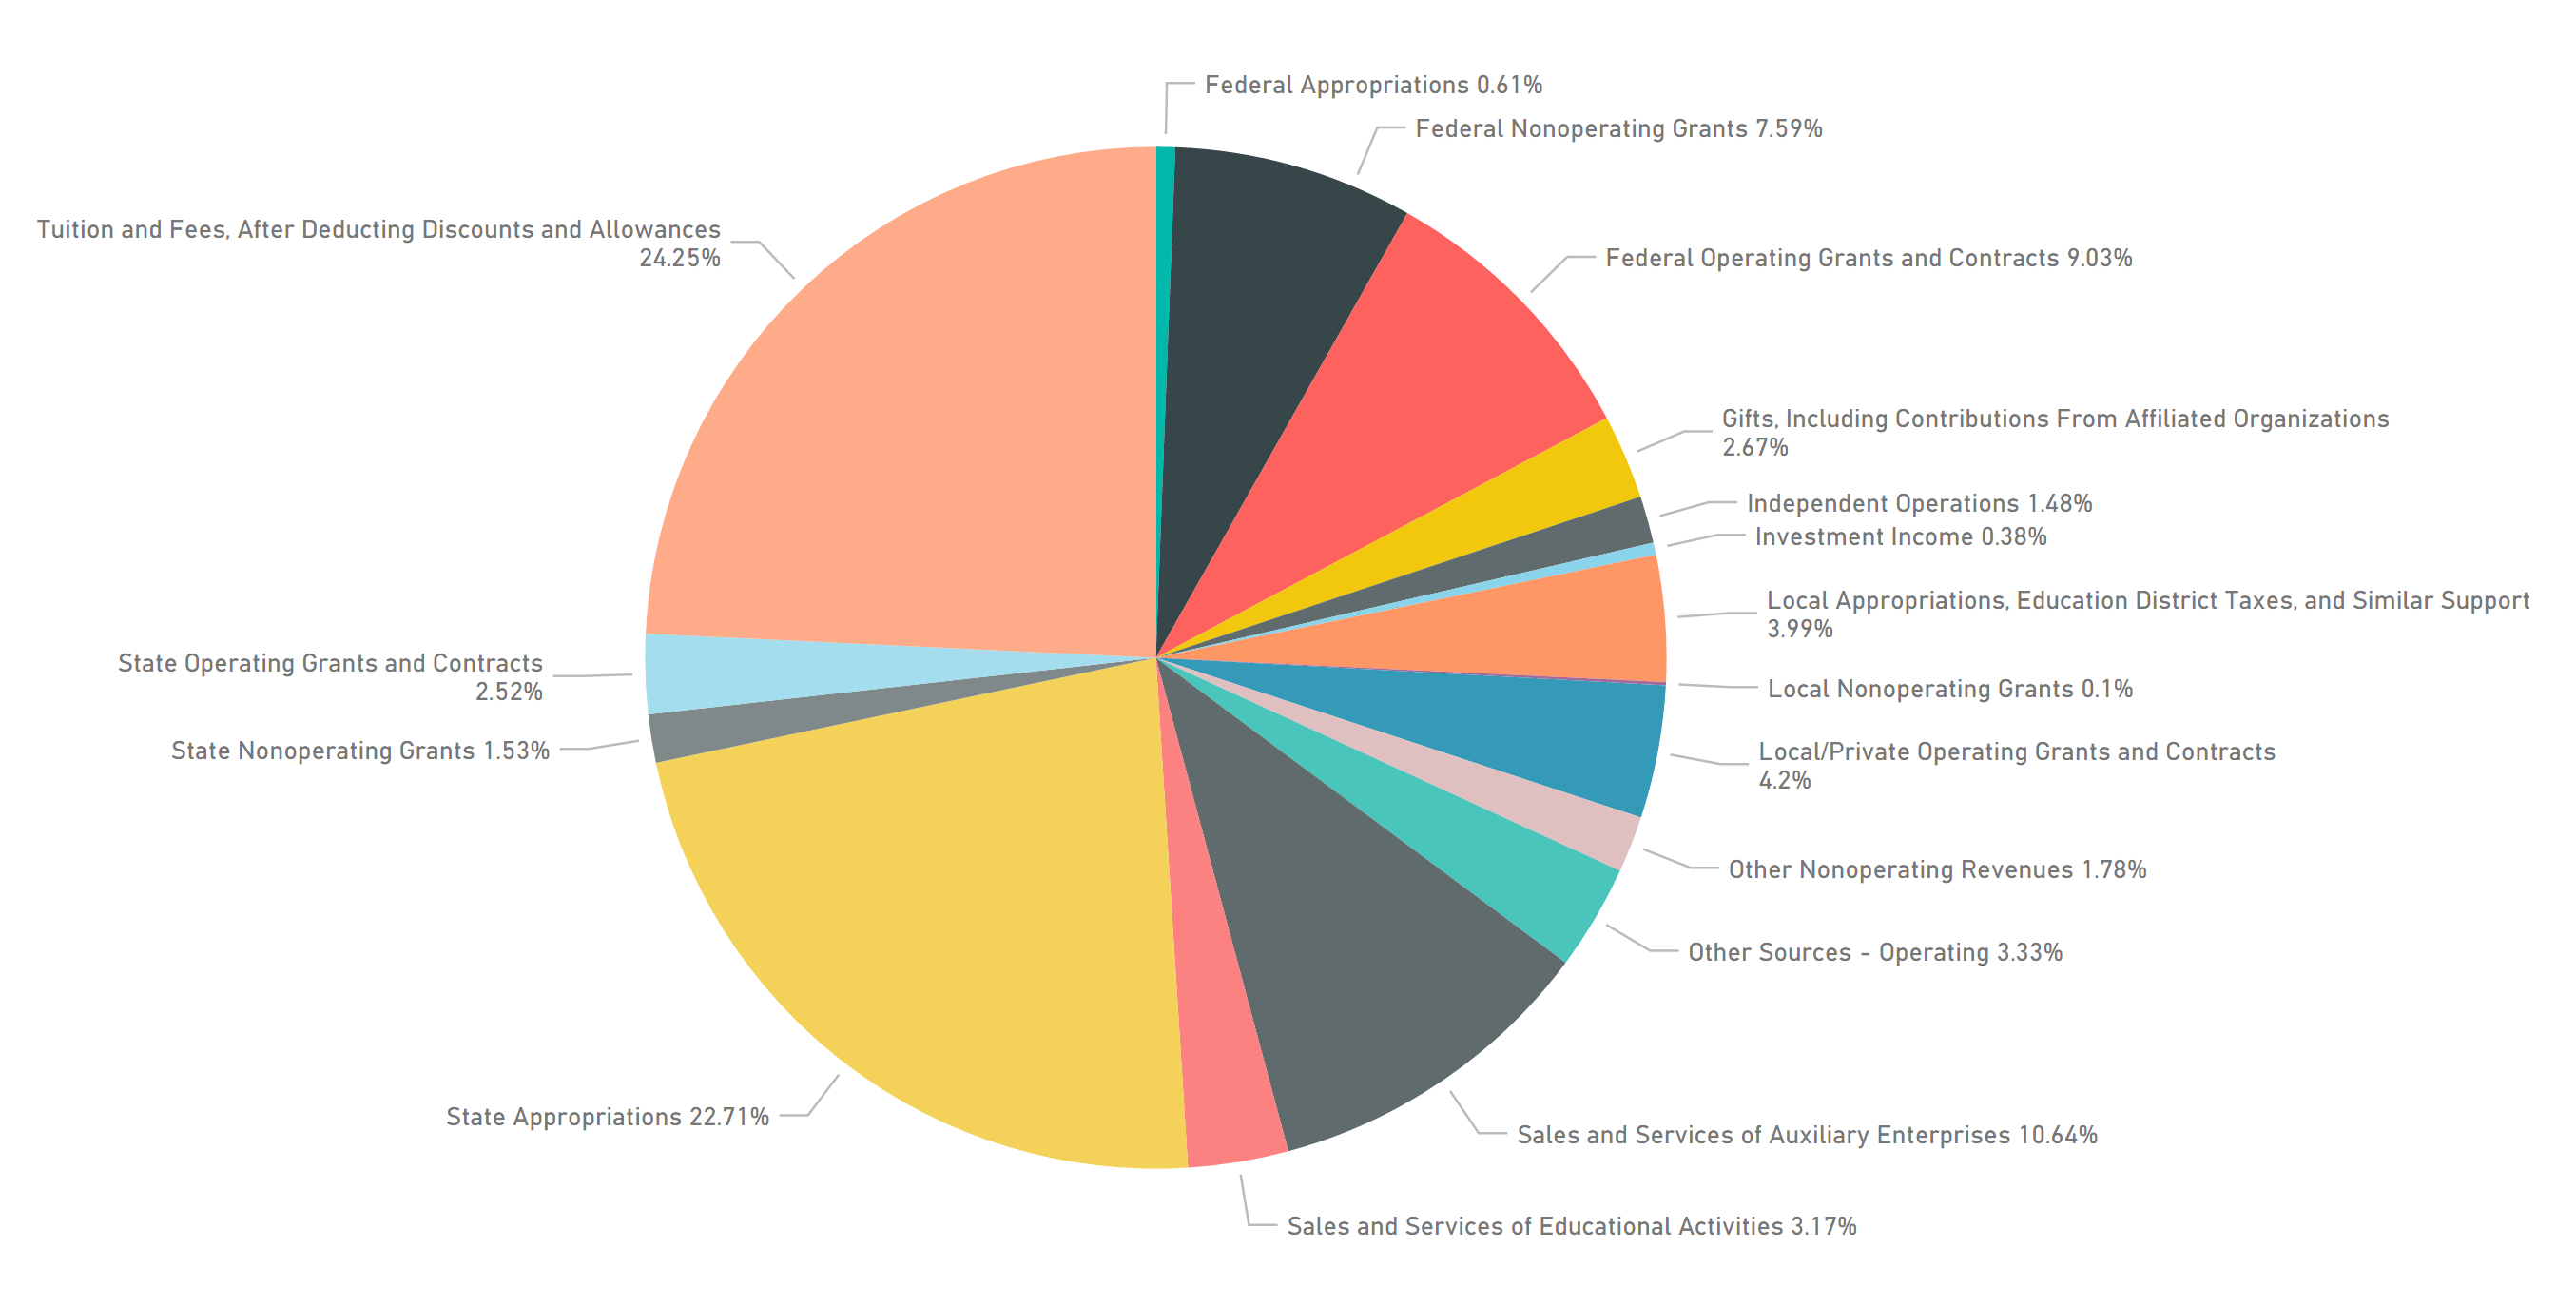
In 2011, Tuition and Fees represented 20.6% of public institutional revenue. In 2015, it has increased to 24.25%. Most of the reshuffling of revenue has come from federal operating grants and contracts as noted by the graphs below. Interestingly, state appropriations have remained relatively constant. Similarly, non-profit institutions have seen tuition as a percent of revenue increase from from just over 29% in 2011 to 34% in 2015. The Finance Interactive provided the glimpse of these revenue sources.


2015 Institutional Revenues


 2011 Institutional Revenues


Share This Story

Similar Posts

  • The States That Send Students Elsewhere

    IPEDS reports residency numbers for first-time undergraduates by state. This data can be challenging to work with from several perspectives. It is not collected every year by every institution and it does not summarize the students coming from out of the state of the institution.     The Enrollment Suite…

  • When is Free Tuition Really Free?

    The sticker pricing game has been in place a long time. No one ever pays full sticker price for items such as jewelry or cars. That is probably why University of Michigan came under scrutiny for its free tuition guarantee for families with income under $65,000. Cynics pointed this out…

  • Student Debt Rises 13%

    The newest College Scorecard data released several weeks ago reveals an ongoing trend in student debt. The median student debt increased 13.1% from 2015 to 2016. The median student debt has now more than doubled since 2007 as shown by the following graph. We calculated this using a weighted average…

  • Friendly Skies Just Got Friendlier

    Airlines have taken it on the chin in recent months for bad customer service. This despite the fact that overall customer service rankings of the airline industry are up. Flight attendants received nearly a 14% bump in pay based on a comparison of mean wage data from the 2016 Occupational…

  • Infection Procedures Top Inpatient Volume Growth

    While Medicare inpatient procedure volume has remained flat since 2013, infections are a significant area of high volume change. The treemap below from the Inpatient Procedure Analysis Interactive shows the inpatient volume growth by procedure with color coding by volume change from 2013-2015 using the Medicare Provider and Analysis Review…

  • Gainful Employment – Here Today, Gone Tomorrow

    The U.S. Department of Education announced yesterday the beginning of the process to rollback and rework Obama-era rules under the gainful employment regulations. These rules, which took years to enact, were designed to hold career-preparation programs accountable for the outcomes of their graduates. The announcement establishes rule making committees to…