Regional Disparities in Health Insurance

We all know that health insurance is a moving target. According to the most recent ACS survey data, the national uninsurance rate declined from 13.0% to 11.7% in 2016. Public insurance coverages increased slightly more than private coverages (increases of .9% and .6%) respectively. This change was short-lived as Gallup recently disclosed a significant rise in the uninsurance rate in 2017, a trend that is likely to continue. 


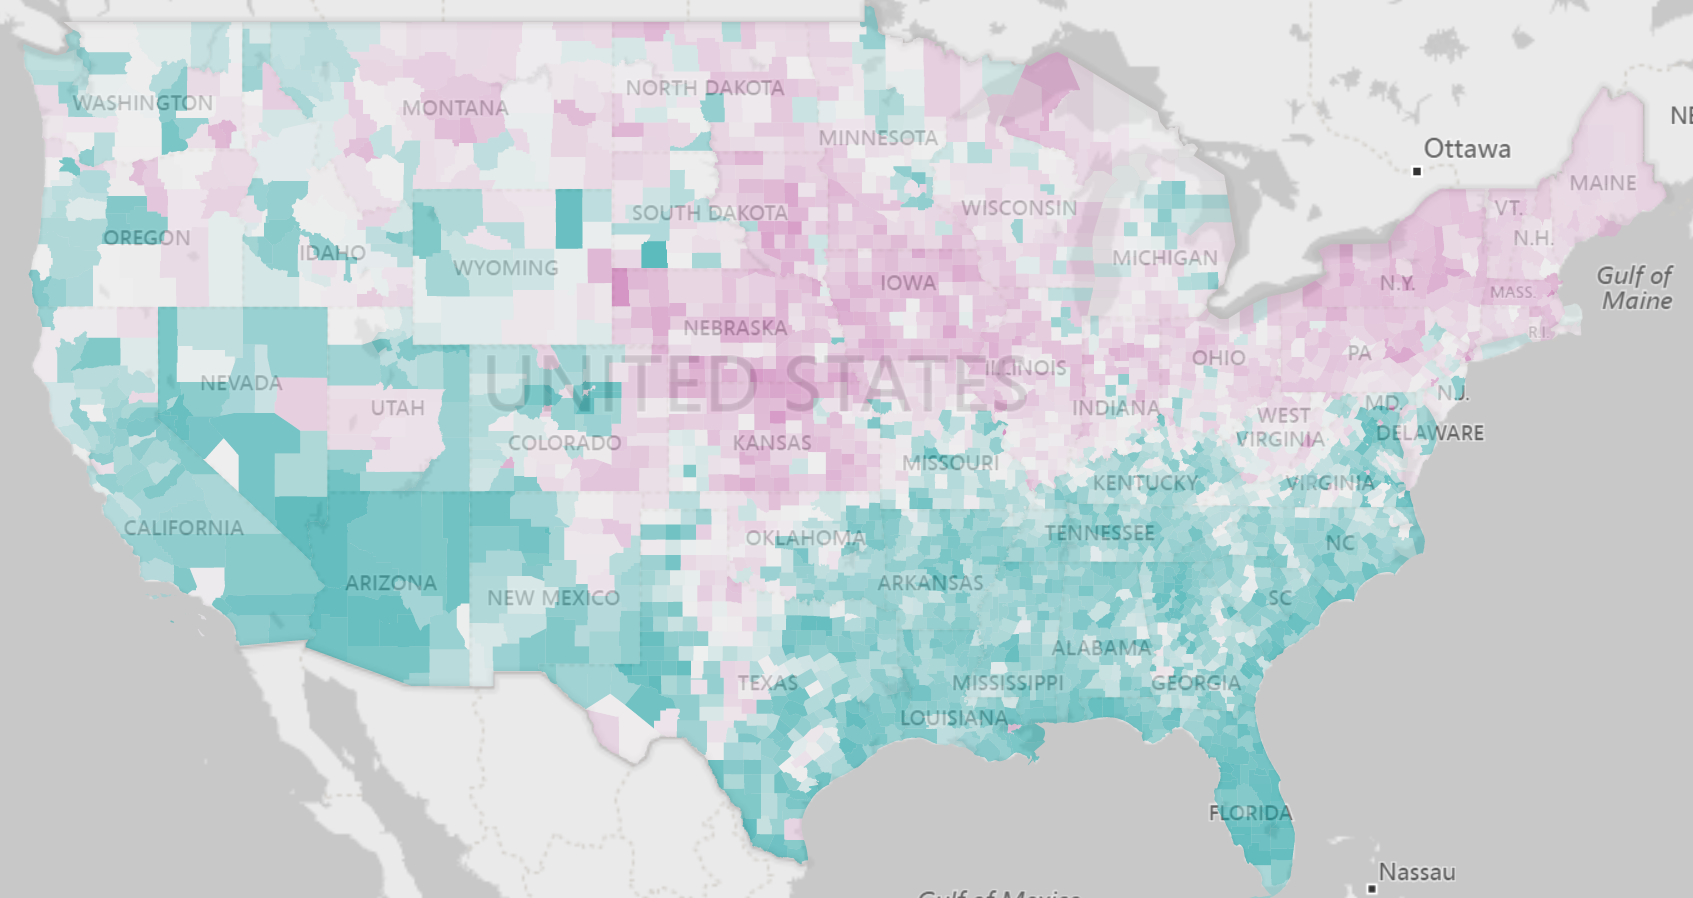
What is intriguing about the whole health insurance advance and retreat is the regional differences in health insurance coverage. Counties in the south are much less likely to be insured than counties in the north and, if they have health insurance coverage, tend to use the public health coverages. Using the Population Analysis Interactive, we found geographic concentrations where private health insurance has declined more than 3% in Texas and Georgia. We highlight these and other discoveries in the video blog


Share This Story

Similar Posts

  • The Race for Nurses

    There is a race that is brewing between millenials who are becoming registered nurses and the hiring that has started at U.S. hospitals. A Health Affairs study concluded that Millennials are becoming registered nurses at nearly twice the rate of baby boomers, but that still won’t necessarily prevent a nursing shortage…

  • Students Increasingly Opting for High Cost Debt

    Many prognosticators are projecting a coming economic crisis caused by student debt. This is typically focused around an inability to pay off the principal of the loan. But it really appears that we are also setting ourselves up for a real problem with the cost of debt.    Overall new…

  • Spring is Here! Which Counties are Physically Active

    I love spring!  As a warm weather person living in the Northeast, I can’t wait to get outside and be physically active. While many are like me, still 29% of the U.S. remains by and large physically inactive and it is very regionally concentrated. The County Health Rankings uses a measure…

  • Endowments per Student Down in 2016

    How financially fit is your institution? One of the measures that Forbes has used in assessing the financial fitness of postsecondary institutions is endowment assets per FTE. This metric takes the value of endowment assets at the end of the year and divides it by the number of FTE’s. In…

  • Powerball and Endowment Wealth per Student

    Large dollars tend to attract many of us. That is why the Powerball attracted so many people at the tidy sum of 1.3 billion. Yet the larger the number, the more people participate. Someone had the brilliant idea of distributing Powerball winnings to everyone in the country thinking it would…

  • Student Financial Aid up 6.2%

    Postsecondary institutions gave over $17 billion in financial aid in 2015. This represented a 3% increase from 2014. However, the number of student receiving the financial aid declined 3% so the average financial aid per student when looked at over the entire postsecondary landscape actually increased 6%. We used data…