Violence Against Women Offenses Up 9.5%

This is the third year that the Campus Safety and Security (CSS) data has released separate violence against women (VAW) offenses. This data captures three types of offenses; domestic violence, dating violence, and stalking and analyzes it for both on campus and off campus locations. Overall, there were 16,183 VAW offenses in 2016, an increase of 9.5% coming on the heels of a 20.8% increase in 2015.


As this data is new, it is still questionable to draw firm conclusions from it. Some have argued that an institution that has a culture of openness which encourages women to come forward actuall will report larger counts of VAW offenses. Consider Auburn University, which reported an increase of 85.4% in 2016, and which celebrates each April as Sexual Assault Awareness Month

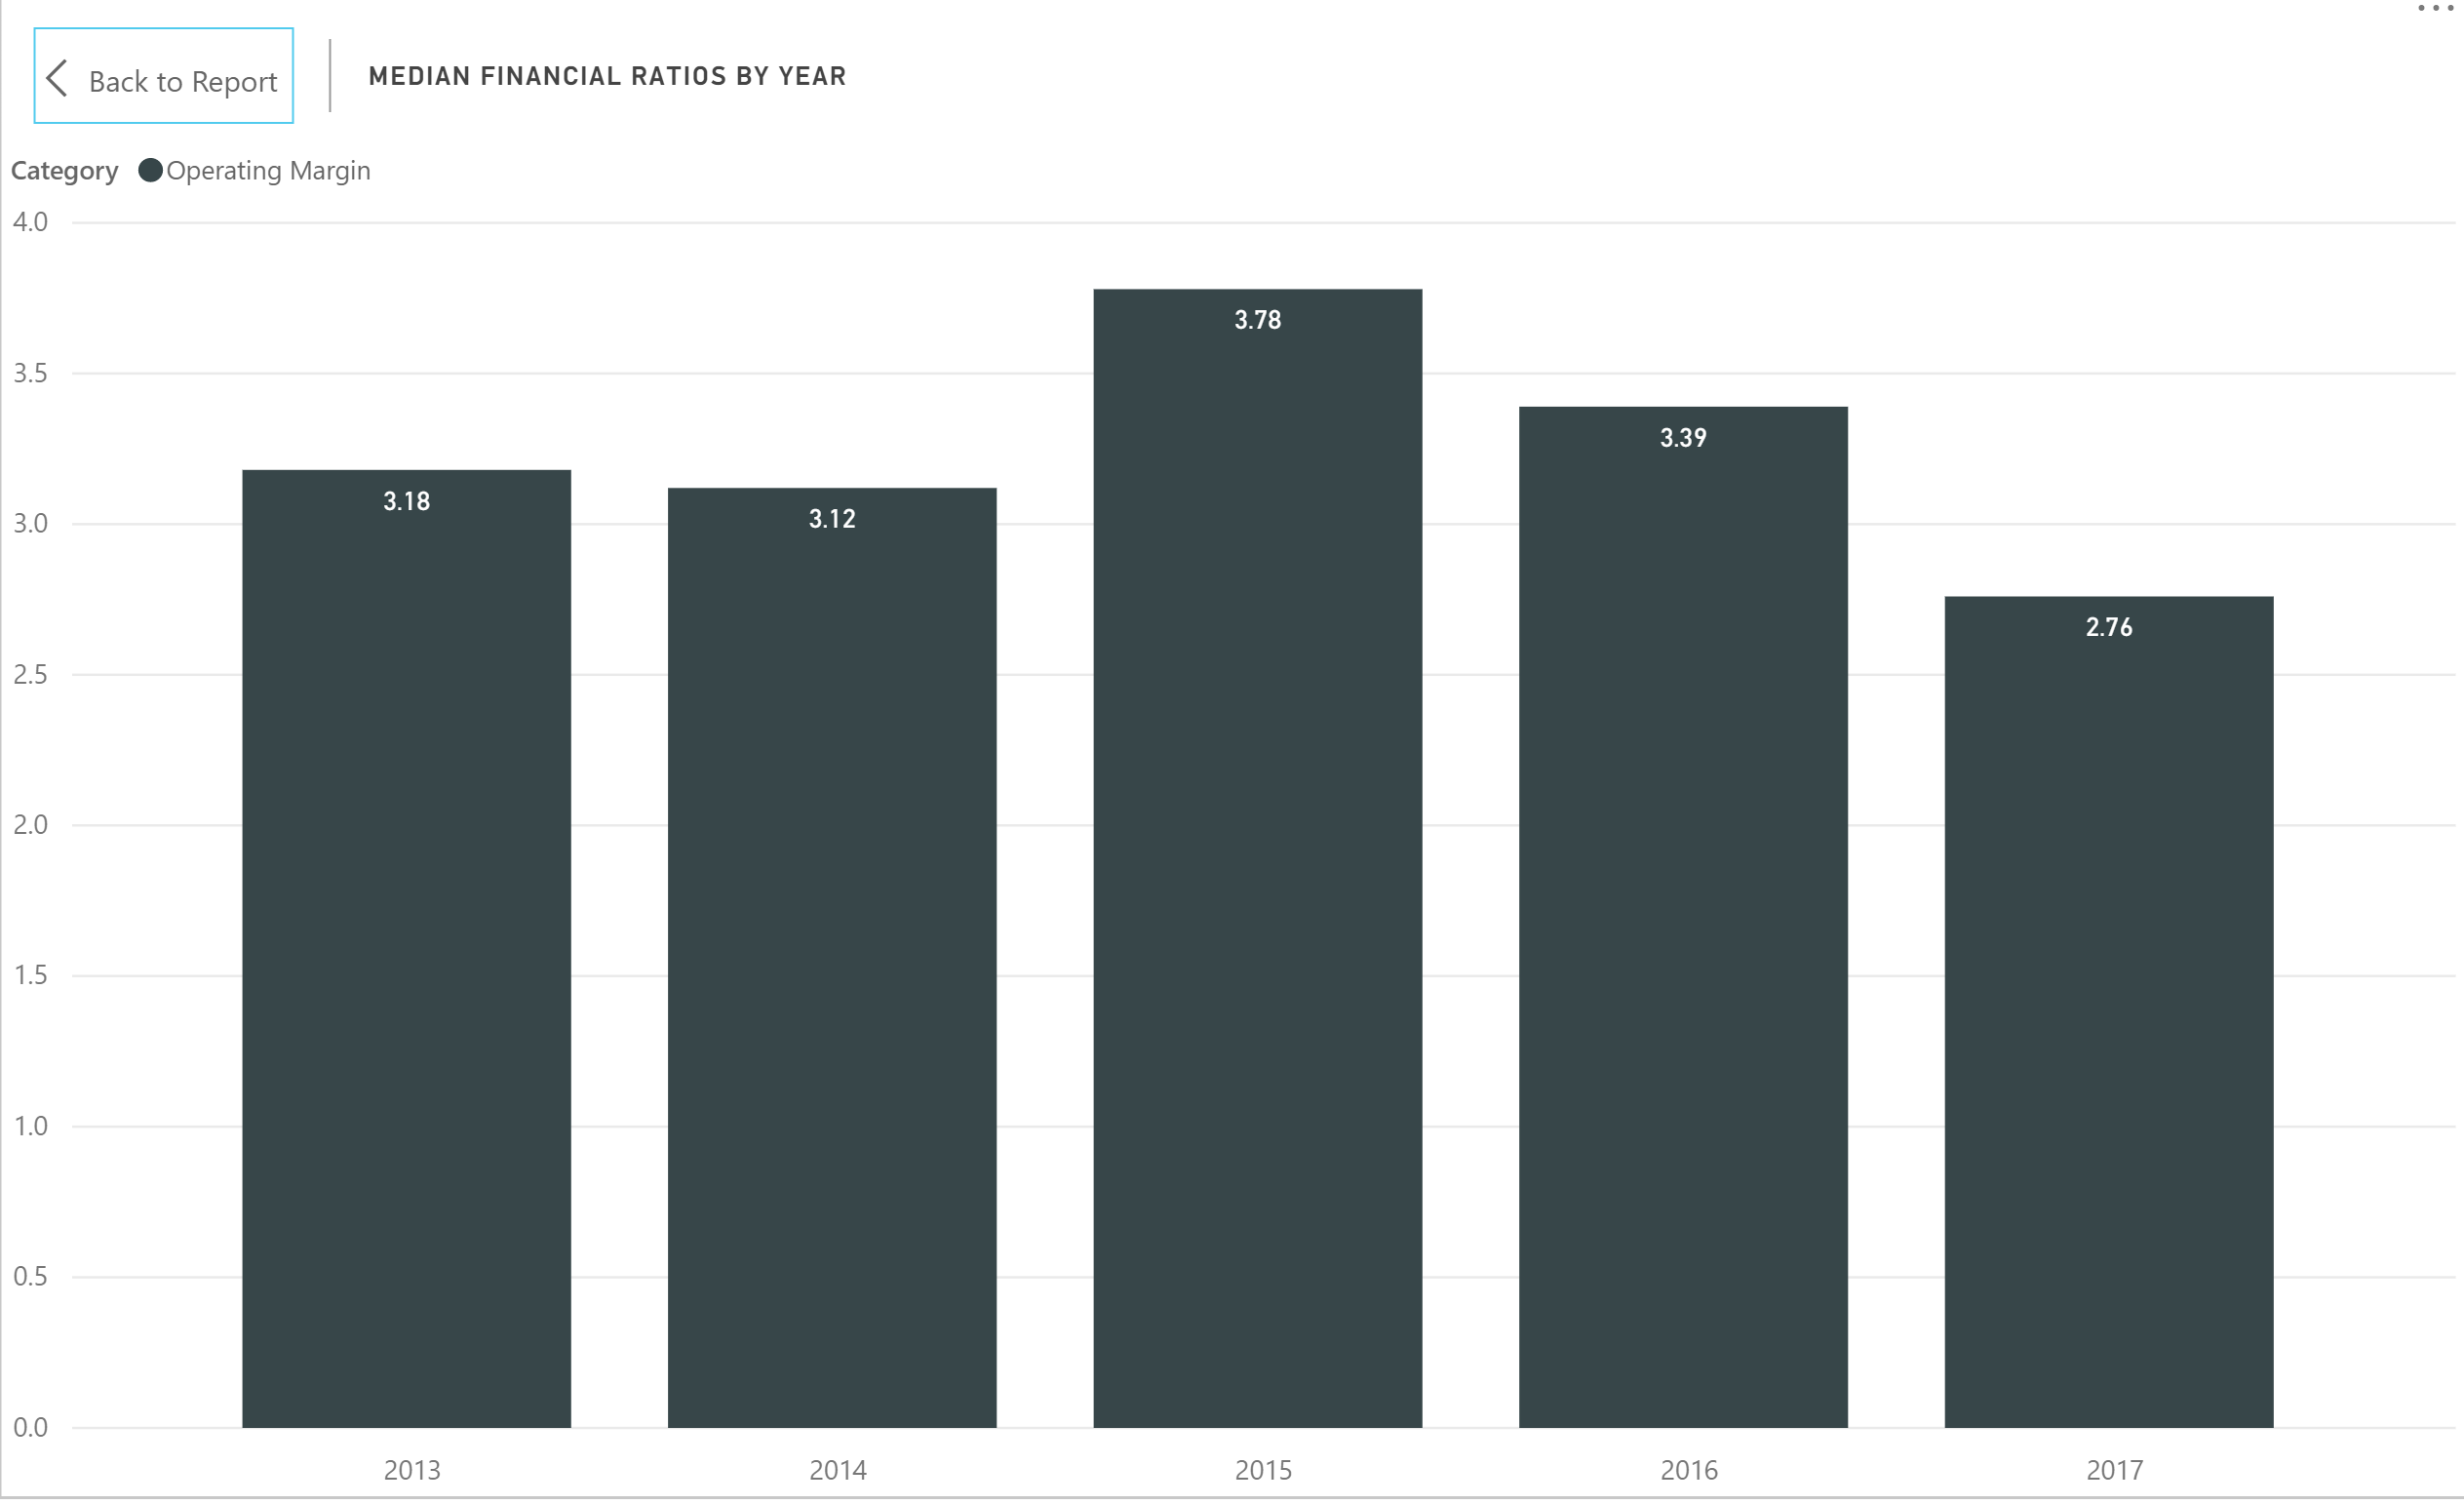
  • Of the types of offenses reported, stalking offenses increased 12.6% and dating violence increased 10.6% in 2016.

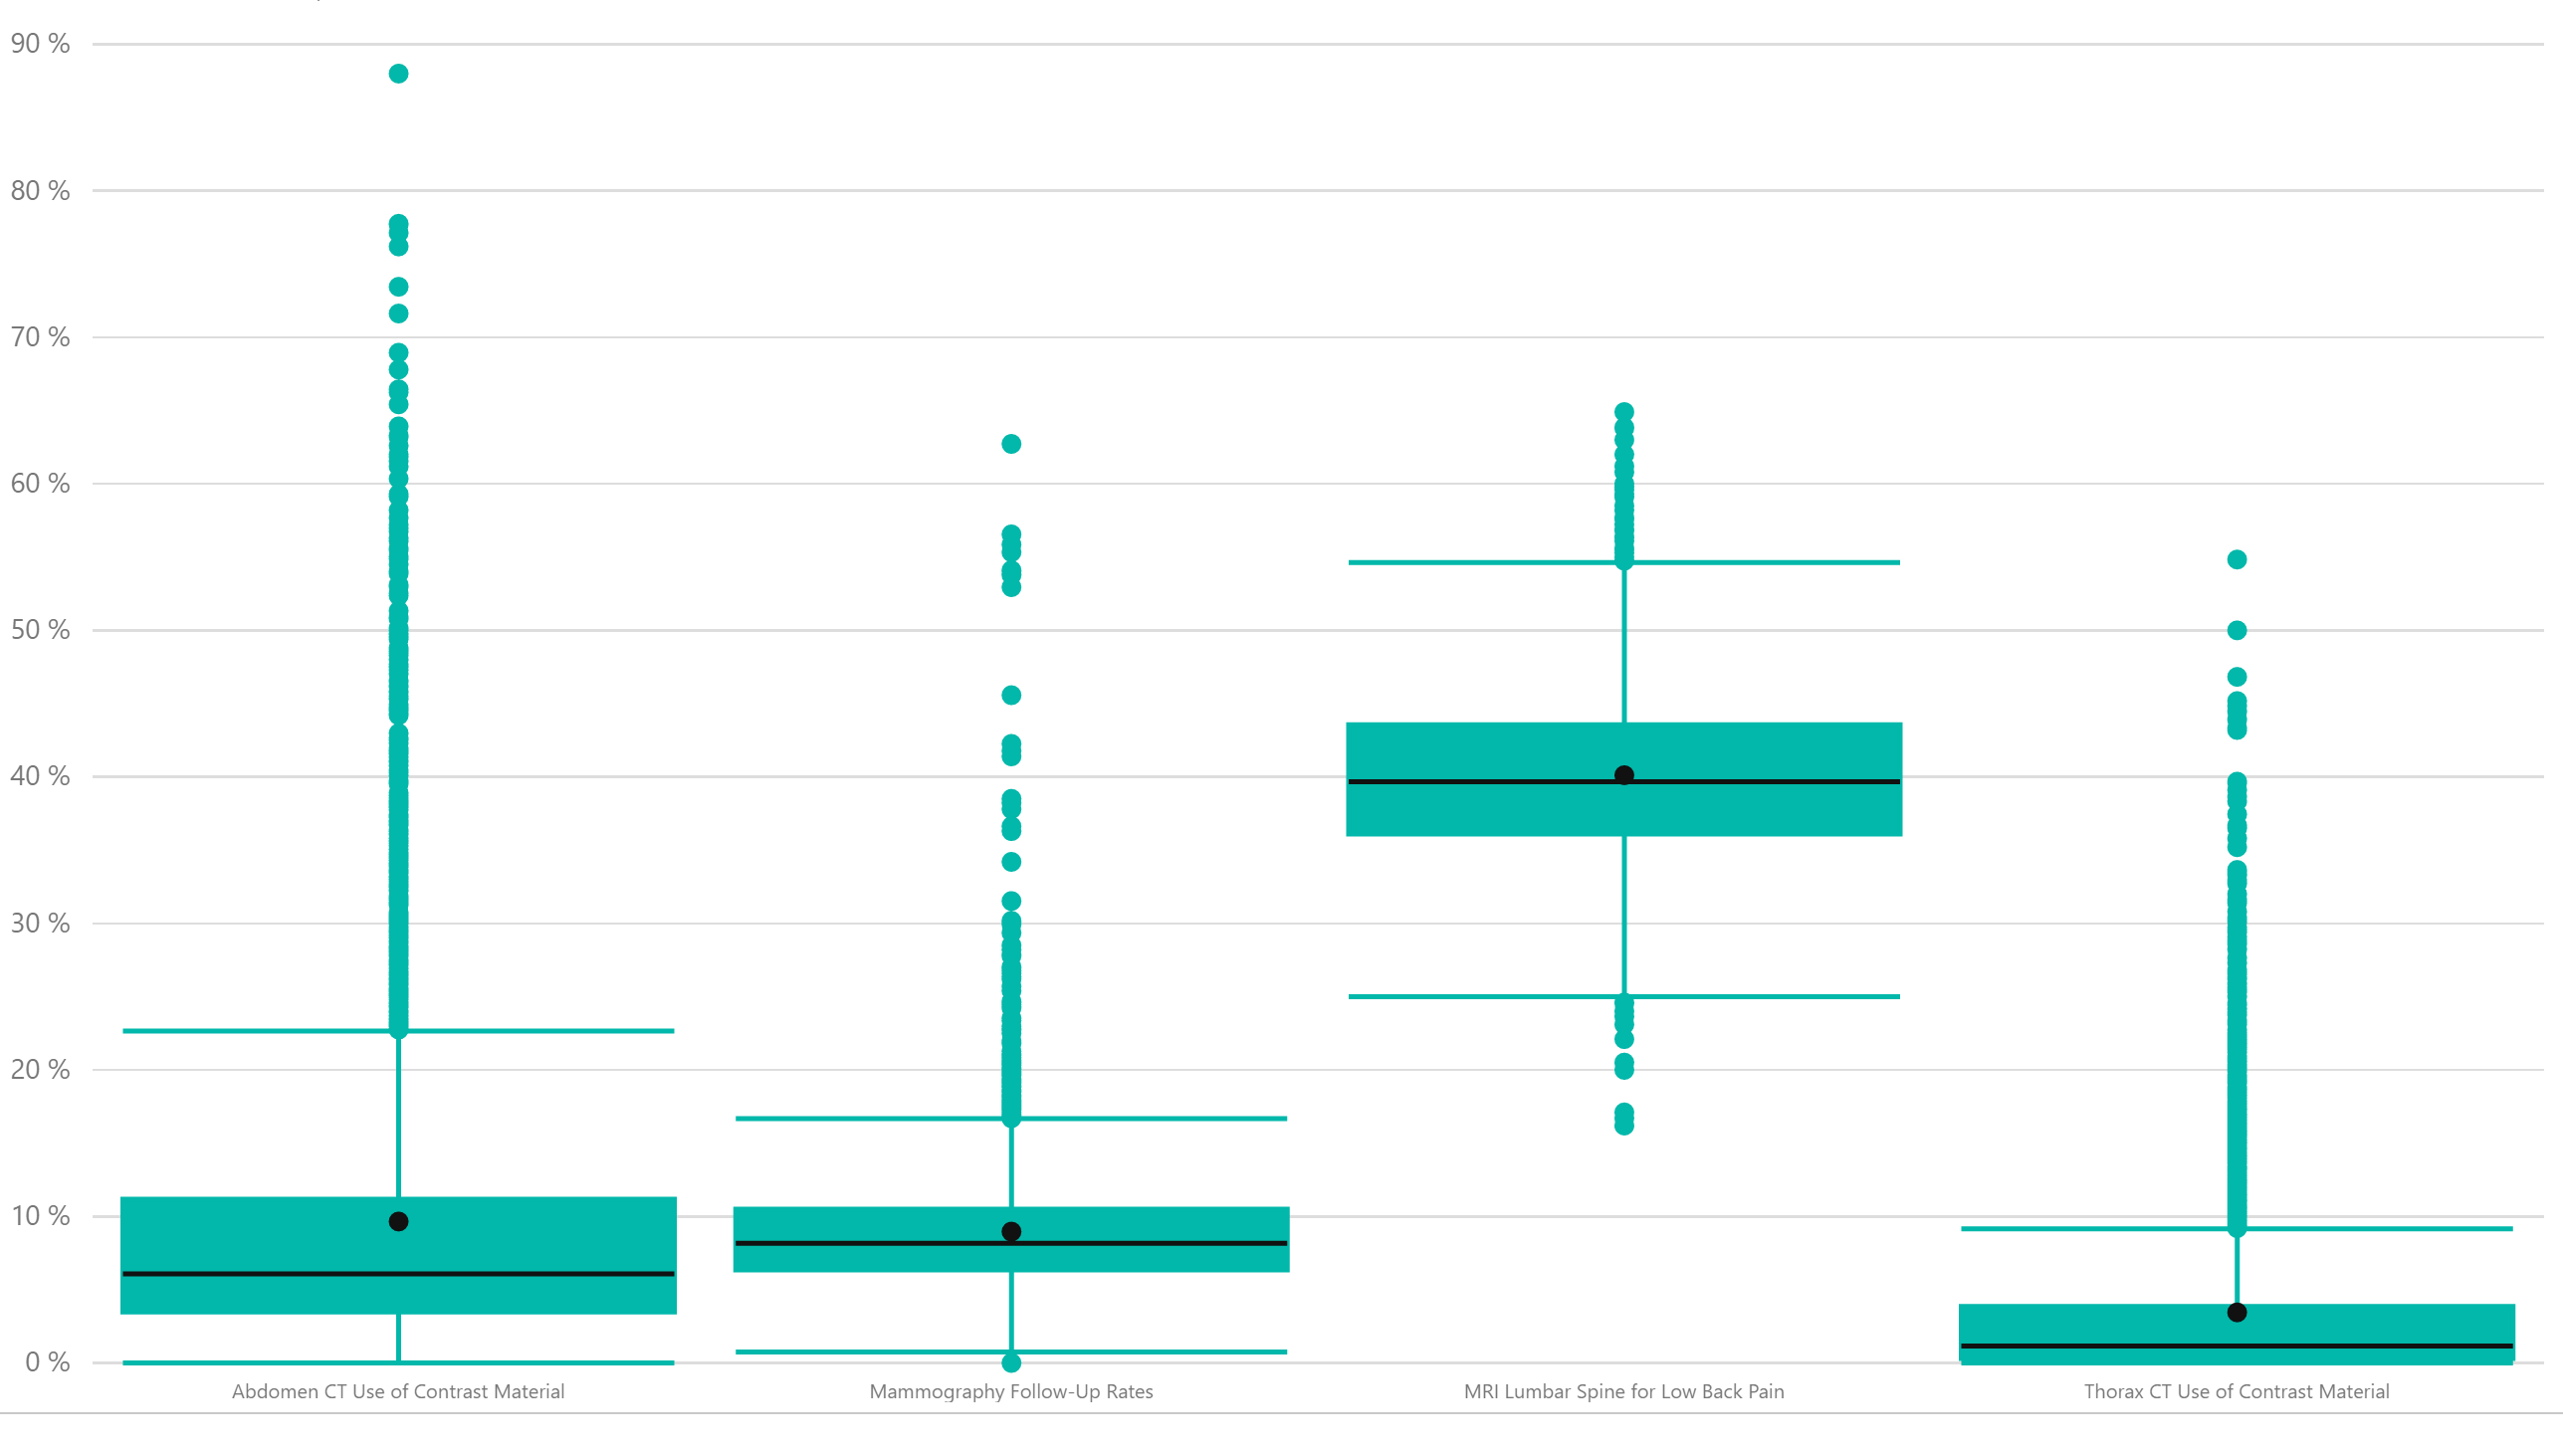
  • More on-campus offenses occurred outside of student housing facilities as these facilities reported a 15.6% increase compared to a 3.0% increase in campus housing. 

The Campus Safety Interactive analyzes campus offenses broadly and by institution over a ten-year period (11 million data points) for the various types of offenses reported including arrests, discipline, criminal offenses, residence hall fires, and VAW offenses. You can purchase this as an individual Interactive for $195 or as part of the Higher Education Institution library. The library now has fourteen Interactives covering numerous topical areas. 


Share This Story

Similar Posts

  • The Race for Nurses

    There is a race that is brewing between millenials who are becoming registered nurses and the hiring that has started at U.S. hospitals. A Health Affairs study concluded that Millennials are becoming registered nurses at nearly twice the rate of baby boomers, but that still won’t necessarily prevent a nursing shortage…

  • BLS Releases New 10-Year Employment Projections

    Last month, the Bureau of Labor Statistics released its 10-year employment projection data. This data is updated every other year. The new data shows a projected increase over the next decade of 7.4% which is a noticeable increase over the previous 6.5% 10-year projections in 2014. These projections are not…

  • CMS Introduces New Hospital Returns Measure

    The most recent batch of Hospital Compare data has expanded the whole area of readmissions, returns, and deaths. There are now separate measures for mortality rates, readmissions, and hospital returns. The hospital returns measure is brand new, with the most recent data through June 2016, and applies to heart attack…

  • As the Economy Grows, So Does Poverty

    There is a general perception that a rising economy raises all economic boats. But poverty rates would indicate that the poorest of the poor just seem to get poorer. Many counties have actually experienced a rise in poverty rates from 2012 to 2016. We took a quick look at the…

  • Inpatient vs. Outpatient – What the Numbers Show

    Analysts in health care don’t agree in unanimity very often, but most seem to agree that there will continue to be a quantum shift in healthcare from inpatient to outpatient. In this two part series, we will attempt to quantify and support this important trend. We utilized the Beds and…

  • Visualizing Student Debt and Earnings

    Leveraging Scatterplots to Analyze the New College Scorecard Data There has always been a symbiotic relationship between student debt and student earnings. As student debt has creeped up in recent years, there has also been a data gap with post-graduation earnings. The most recent College Scorecard data is a first…