The States That Send Students Elsewhere

IPEDS reports residency numbers for first-time undergraduates by state. This data can be challenging to work with from several perspectives. It is not collected every year by every institution and it does not summarize the students coming from out of the state of the institution.  


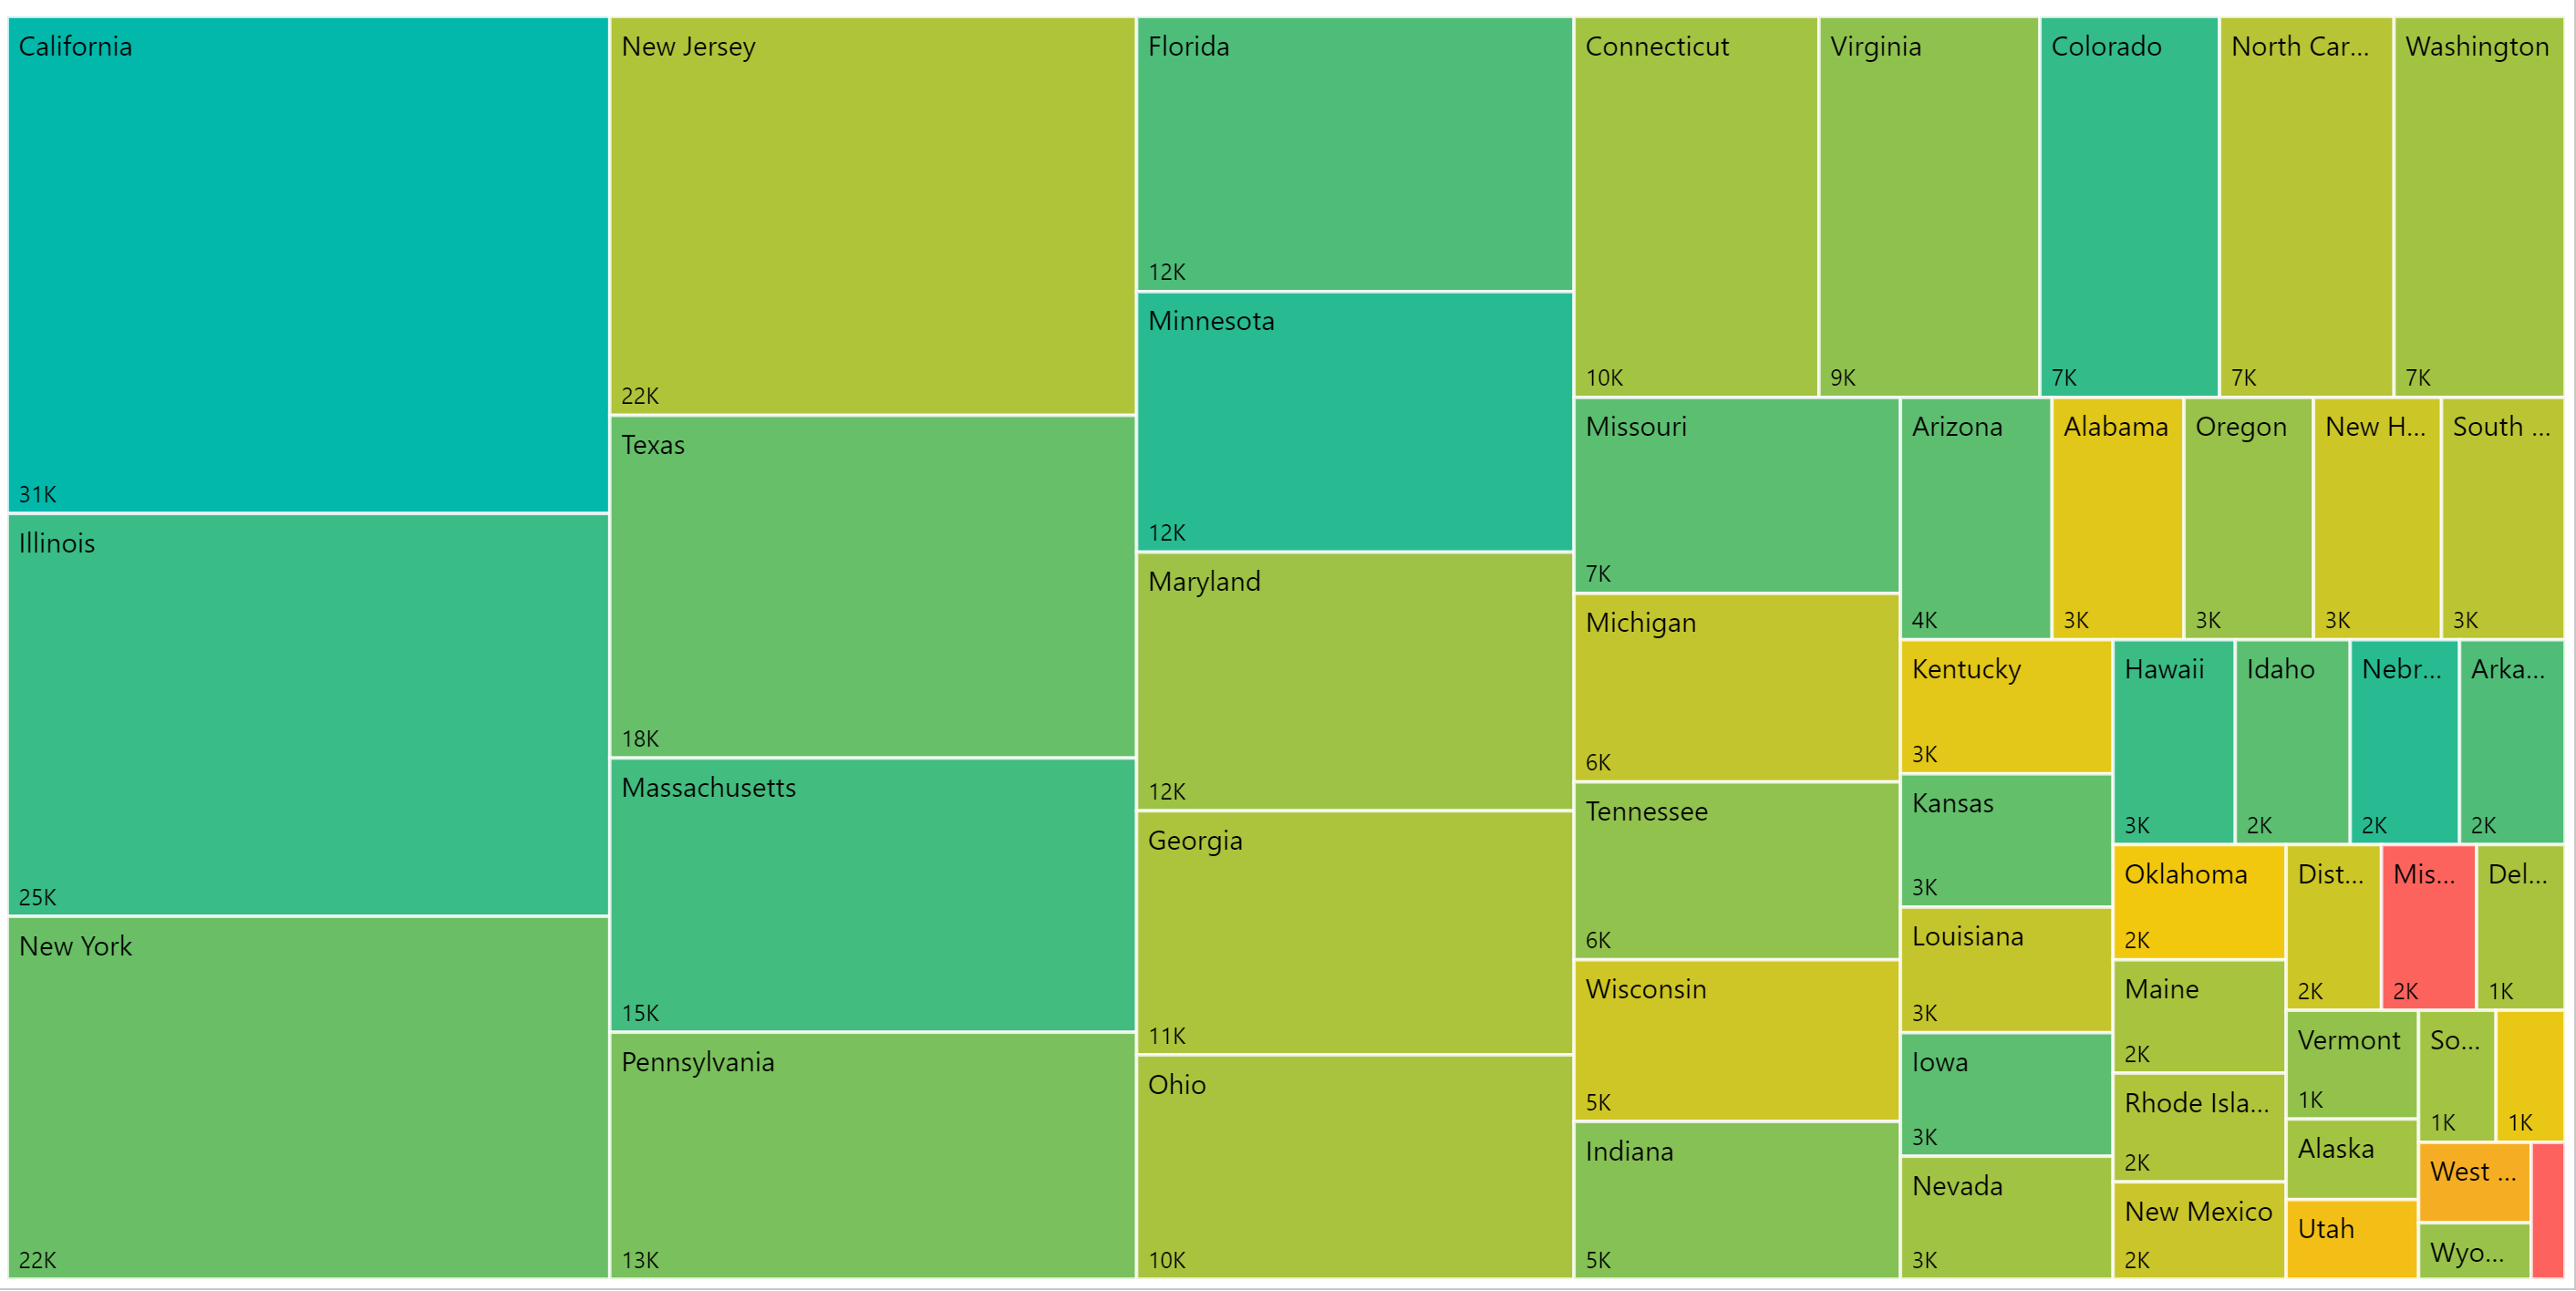
The Enrollment Suite Interactive compares the state of the institution to the residency enrollment for each institution. Anything outside of the state of the institution is considered out of state. We summarized which states send students out of state using this approach in the treemap below. The larger states such as California pop out but a few more also pop out. 

The states with the highest number of students going out of the state are the larger blocks in the map. This tends to the more populated states, but also the smaller states geographically such as New Jersey, Massachusetts, and Connecticut. However, some Mideastern and Midwestern states also permeate the list. Mississippi and North Dakota are the states in dark red which indicate the most change over the five-year period, albeit on a small base.  States such as Kansas, Oklahoma, Arkansas, and Louisiana tended to stay in state.
 

Share This Story

Similar Posts

  • FAFSA Application Volume Down 11%

    The FAFSA Application Volume declined nearly 11% for the application cycles from June 30, 2014 through June 30, 2017 based on data from Federal Student Aid and analyzed using the Financial Aid Interactive. FAFSA application cycles are based on an 18-month period for any one particular school year.  Note the…

  • Fringe Sport Participation

      In this Data Dan video, Dan uses data from the Equity in Athletics data set from Title 9 Participating schools to look at fringe sports at colleges across the country.  

  • Tuition Bears Increasing Brunt of Higher Ed. Revenue

    In 2011, Tuition and Fees represented 20.6% of public institutional revenue. In 2015, it has increased to 24.25%. Most of the reshuffling of revenue has come from federal operating grants and contracts as noted by the graphs below. Interestingly, state appropriations have remained relatively constant. Similarly, non-profit institutions have seen tuition…

  • What is the Newly Released Carnegie Data?

    The Carnegie Classification™ has been the major institutional framework for describing higher education institutions since 1970. This classification system comes out approximately every five years with the latest rendition released on February 1, 2016. This release represents the initial data provided by the Indiana University Bloomington Center for Postsecondary Research…

  • March Madness and the Top Line

    Everyone has caught March Madness fever. The first two rounds of this landmark tournament sparked more double digit seed upsets than any other year. Yet as we sit here for the sweet 16, all of the number one seeds advanced. It is no surprise to anyone either that NCAA basketball…

  • Student Earnings Experience a Sluggish Recovery

    College students are earning 8% less in 2013 than in 2008 per the most recent data published by the US Department of Education College Scorecard database. Students earned $31,382 in 2013 compared to $34,119 in 2008. The earnings were ostensibly flat from 2012 earnings of $31,528.   The College Scorecard…