Has Distance Education Hit Its Peak?

Programs offered through distance education or what we might conventionally refer to as online programs actually declined as a percentage of all programs from 10.8% to 10.5% in 2017 and 2016 respectively. This was the first time that distance education has actually declined since this data started being collected by IPEDS in 2013. Further, the number of programs being offered by institution and 6 digit CIP combination declined from 21,748 to 21,339. Not much of a decline, but a decline nevertheless.


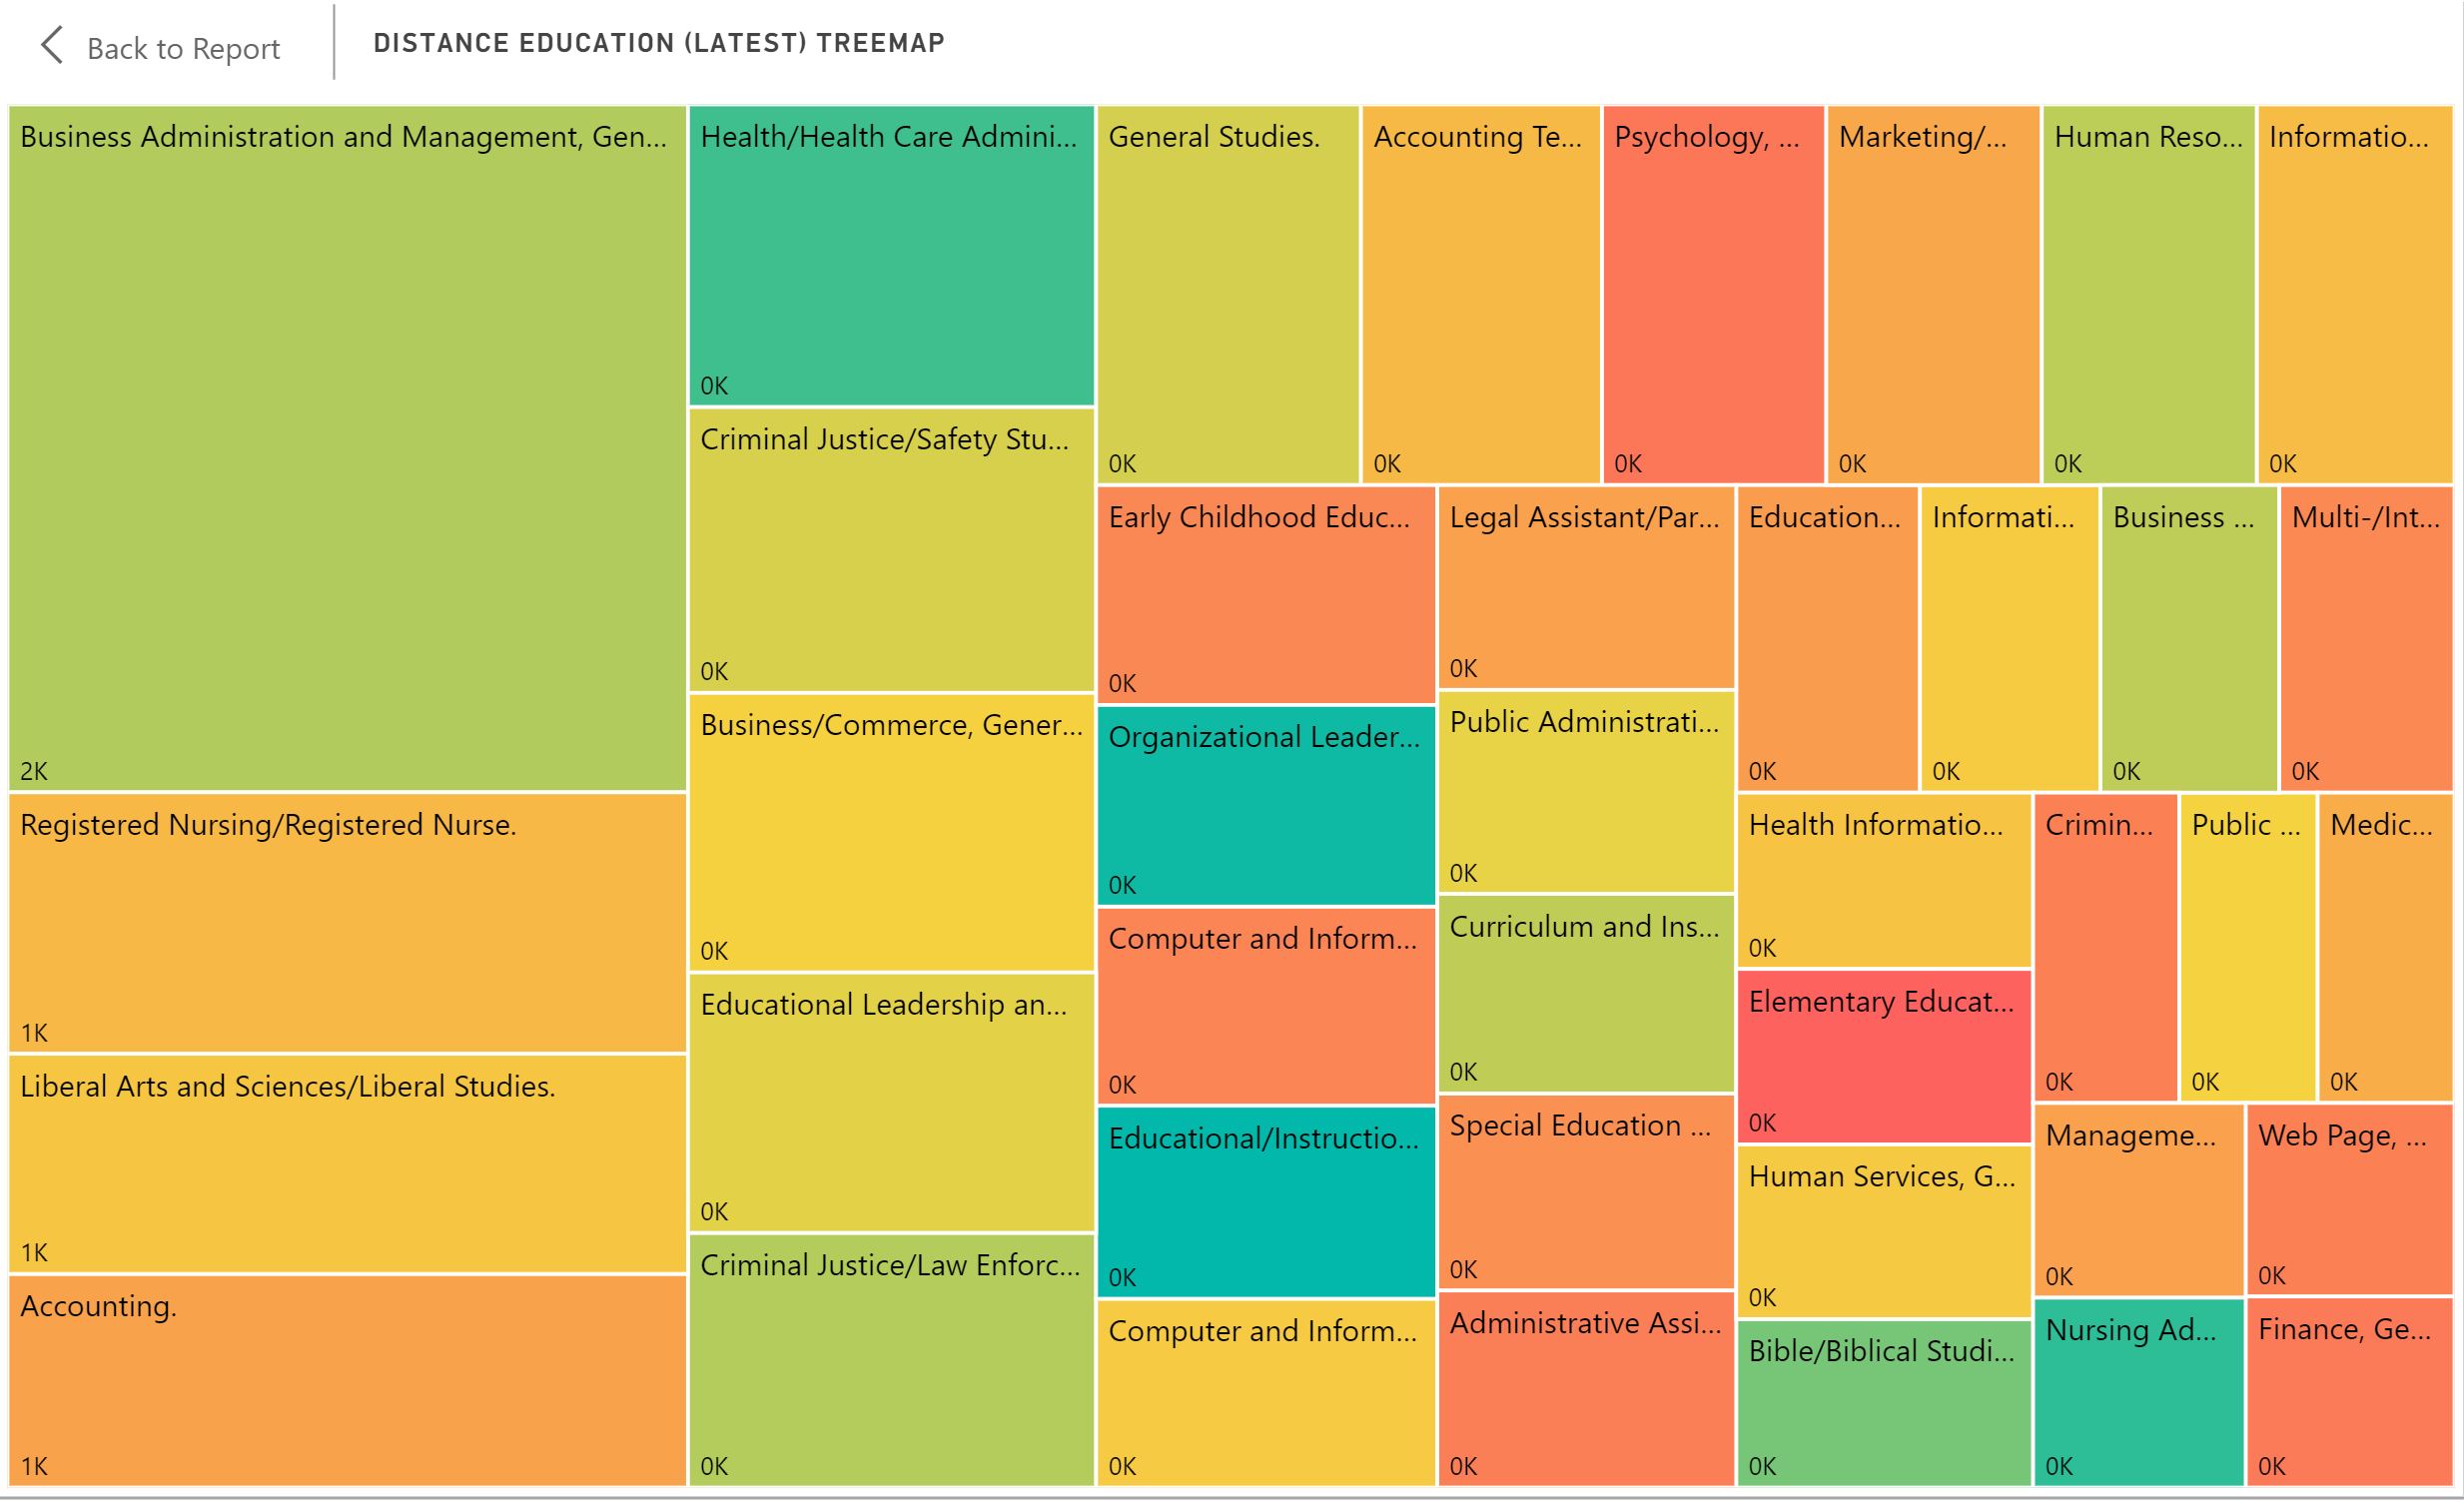
It appears that the original lure of distance education seems to have worn off somewhat and whatever works, works well. Whatever is not working is being phased out. Business Management continues to have the highest absolute number of distance education programs, but it is not the highest percentage of programs. The highest percentage of programs offered through distance education is in Organizational Leadership and Educational/Instructional Technology at over 34%. Nursing Administration and Health Care Administration are also high concentrations of distance education at around 31%.


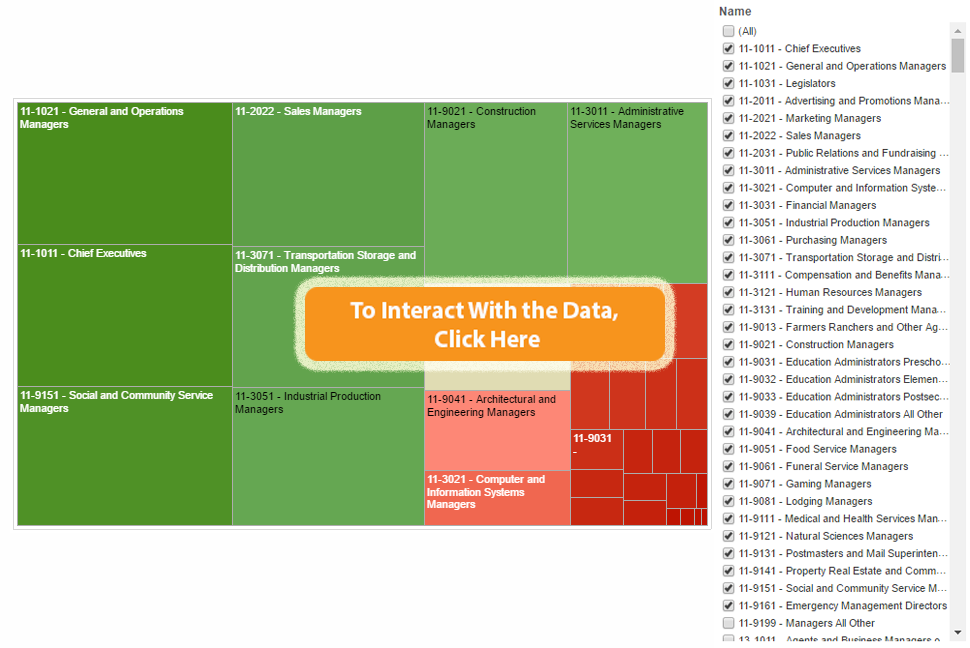
The treemap below shows the distribution of the largest distance education programs (screened for minimum of 150 programs). The size is the raw number of programs while the color is the percentage offered through distance education (blue being highest and red being lowest on diverging scale). 


Share This Story

Similar Posts

  • As the Economy Grows, So Does Poverty

    There is a general perception that a rising economy raises all economic boats. But poverty rates would indicate that the poorest of the poor just seem to get poorer. Many counties have actually experienced a rise in poverty rates from 2012 to 2016. We took a quick look at the…

  • Maternal Care and Rural Counties

    An interesting study published in the September issue of Health Affairs found that 9 percent of rural counties experienced the loss of all hospital obstetric services in the period 2004–14. In addition, another 45 percent of rural US counties had no hospital obstetric services at all during the study period. We…

  • Regional Variations in Opioid Prescribing Rates

    Given the state of the opioid crisis, any meaningful data is valuable. So when CMS released three years of Opioid Part D prescription data in November, we all rejoiced. CMS also released a mapping tool to analyze the data. While mapping tools can be effective, they can also get in…

  • Breaking Down Net Price, Tuition, and Aid

    Reports by College Board and others have indicated that net price, the true measure of what a student pays to attend college, continues to rise. College Board has maintained that the actual net price has been increasing for six to eight straight years.    Net price is defined as the…

  • Is Bureau of Labor Statistics Data Adequate?

    Several weeks ago, the Bureau of Labor Statistics (BLS) released updated Occupational Employment Statistics (OES) survey data. BLS OES is one of those foundational programs and datasets that are used for comprehensive occupational analysis. It produces employment and wage compensation estimates annually for nearly 800 occupations. These estimates are available…

  • Diving Deeper into Opioid Prescriber Data

    Last week we introduced the new CMS opioid data set and what it means. This data tries to initiate transparency around this hot topical area even though Part D Medicare claims may not be the best proxy of all opioid prescription activity. There are three elements to this data: Part…