Student repayment rates continues to decline, although the trend seems to be slowing, according to the most recent College Scorecard data. This data measures repayment rates at 1,3,5, and 7 years. Repayment rates and default rates are very different. Repayment rates are the percentage of students who have made progress in paying them down (i.e. have paid down at least $1 in the initial balance of their loans) after entering repayment. Default rates measure the worst-case scenario for repayment outcomes and can be manipulated through deferments and forbearances.
To create this composite picture, we took the average repayment rate by institution and multiplied it by the number of students being measured to come up with an institutional average and then aggregated the data by year.
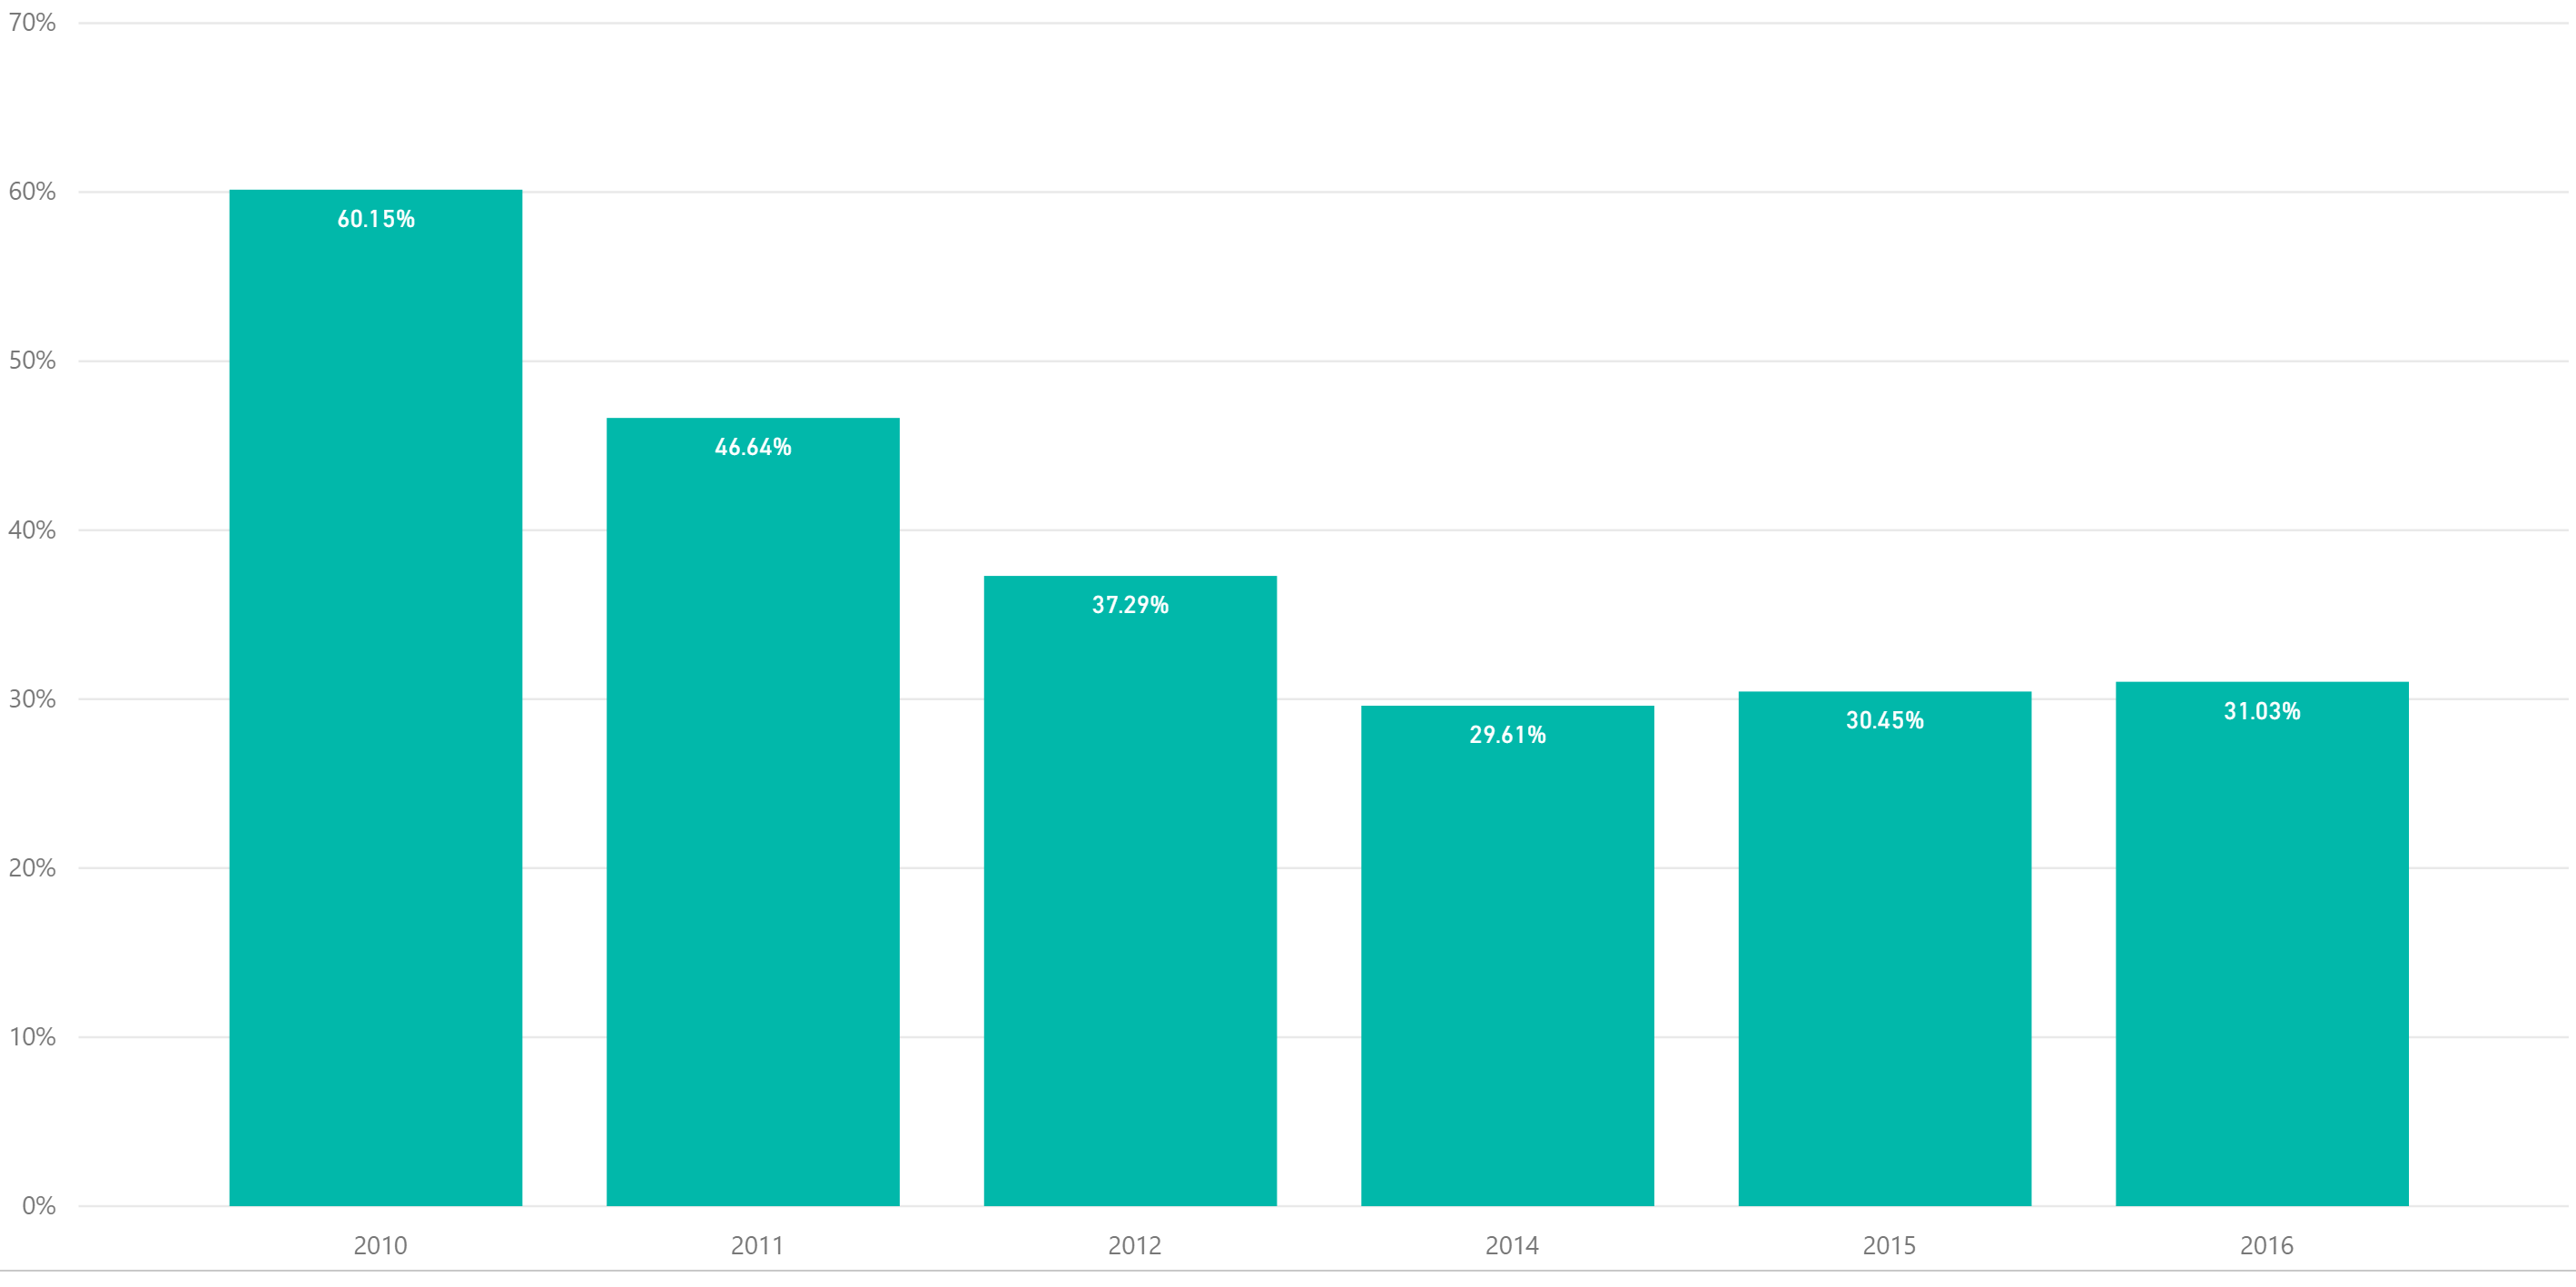
Three-Year Repayment Rates

Five-Year Repayment Rates

Seven-Year Repayment Rates

The One-Year Repayment Rates were not updated and the last year we have is 2014. The Three-Year Repayment Rate has rebounded from 30.45% to 31.03% in 2016. The Five-Year Repayment Rate has declined from 38.55% to 36.42% and the Seven-Year Repayment Rate has declined from 53.23% to 46.28%. The trending graphs are shown below. Obviously the time horizon is the key. Those entering into repayment during the Great Recession continue to struggle to repay their debts whereas those entering into debt outside of the Great Recession seem to be doing better. On the other hand, we may be so accustomed to poor performance that we still accept that two out of three students do not pay their student debts down when they are due, even five years into the repayment cycle.