Degrees, Jobs, and Crosswalks

My daughter has a Bachelor’s Degree in Fine Arts with a concentration in Cartooning and Illustration. Today, she is a quality assurance manager for a software company. I am very glad that her career has morphed into a burgeoning field because it was very clear to me that it would be very hard to get a job in her chosen field.


Program development requires a knowledge of the jobs that employ them. A “crosswalk” attempts to match up one type of database element to another. That is not always easy because jobs can deploy multiple degrees. A degree can result in multiple jobs and a single job can come from multiple degrees. In database terminology, it is what we call a many to many relationship.


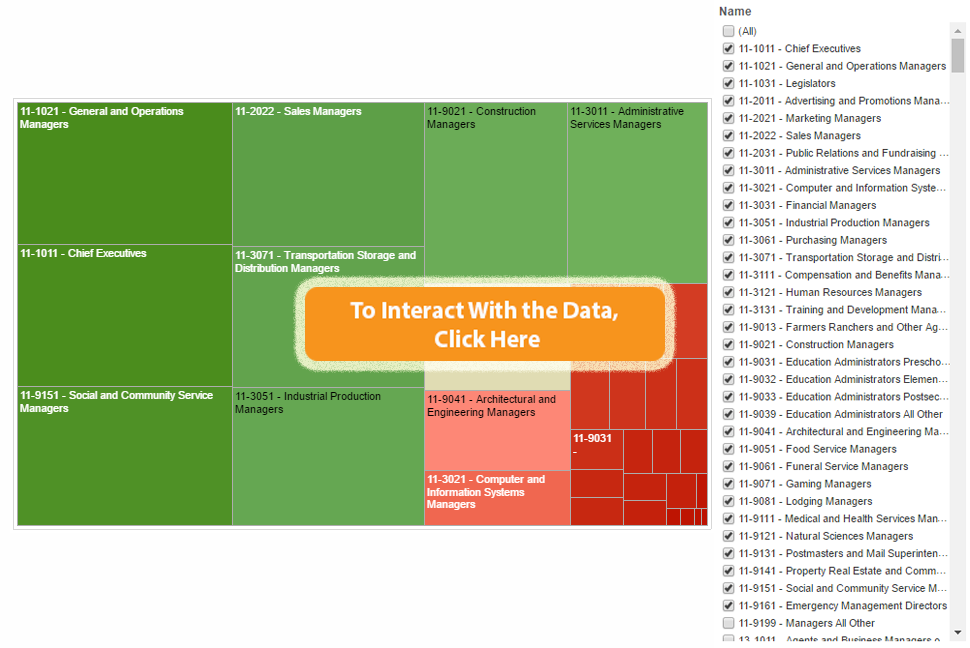
We have deployed a crosswalk in Public Insight that matches up jobs by Standard Occupational Classification (SOC) to degrees awarded by Classification of Instructional Programs (CIP). To find which jobs are moving which degrees, we created a treemap visualization in Tableau Public , which you can access by clicking HERE. The degrees awarded need to be looked at proportionately and a treemap is perfect for this. You can select the individual job codes by six digit SOC code and see proportionate degrees to other SOC codes. For example, we plotted all managerial jobs which begin with SOC code 11 and find Industrial Management jobs are almost three times more relevant in degrees awarded than Computer and Information System Managers. To interact with the Tableau visualization, click HERE.


Share This Story

Similar Posts

  • Private Room Average Hospital Stays up 10%

    While average length of stay has experienced a long-term decline, one component of average stay seems to be increasing – private rooms. The average stay in a private room increased nearly 10% based on an analysis of the 2016 Medicare Provider Analysis and Review (MedPAR) data set.    Even more…

  • Regional Disparities in Health Insurance

    We all know that health insurance is a moving target. According to the most recent ACS survey data, the national uninsurance rate declined from 13.0% to 11.7% in 2016. Public insurance coverages increased slightly more than private coverages (increases of .9% and .6%) respectively. This change was short-lived as Gallup…

  • Student Debt Rises 13%

    The newest College Scorecard data released several weeks ago reveals an ongoing trend in student debt. The median student debt increased 13.1% from 2015 to 2016. The median student debt has now more than doubled since 2007 as shown by the following graph. We calculated this using a weighted average…

  • More Students Paying Out-of-State Tuition Rates

    Over 230,000 students pay out-of-state tuition rates compared to approximately 1.5 million students who pay in-state or in-district rates according to the most recent cohort group from IPEDS. This represents 13.09% of the students and continues an upward progression of out-of-state paying students.    The number of students paying out-of-state…

  • Using AI to Break Down Head Count

    New Microsoft® Power BI Visual Dynamically Analyzes Categorical Data Like fashion goes in and out of style, so do visual ways of exploring data. Several decades ago I worked with a visual called the Decomposition Tree from an upstart company Proclarity from Boise, Idaho to analyze multi-dimensional data. That company…

  • Nursing Home Deficiencies by State

    When nursing home incidents occur, they receive big news. Just this week, a Pinellas Park, Florida nursing care center resident died after appearing to have been left outside in the sun. The nursing home had been cited for various deficiencies and had received a one-star rating. In fact, the nursing…