Student Financial Aid up 6.2%

Postsecondary institutions gave over $17 billion in financial aid in 2015. This represented a 3% increase from 2014. However, the number of student receiving the financial aid declined 3% so the average financial aid per student when looked at over the entire postsecondary landscape actually increased 6%. We used data from the Tuition and Pricing Interactive to crunch the numbers which come from IPEDS. The following table shows the breakdown of the aid totals between in-state and other institutions. 


The aid packages are only good if the cost increases are managed. The average net price for all institutions went up a modest 1.5-2% indicating that to be the case.
Share This Story

Similar Posts

  • March Madness and the Top Line

    Everyone has caught March Madness fever. The first two rounds of this landmark tournament sparked more double digit seed upsets than any other year. Yet as we sit here for the sweet 16, all of the number one seeds advanced. It is no surprise to anyone either that NCAA basketball…

  • Tuition Bears Increasing Brunt of Higher Ed. Revenue

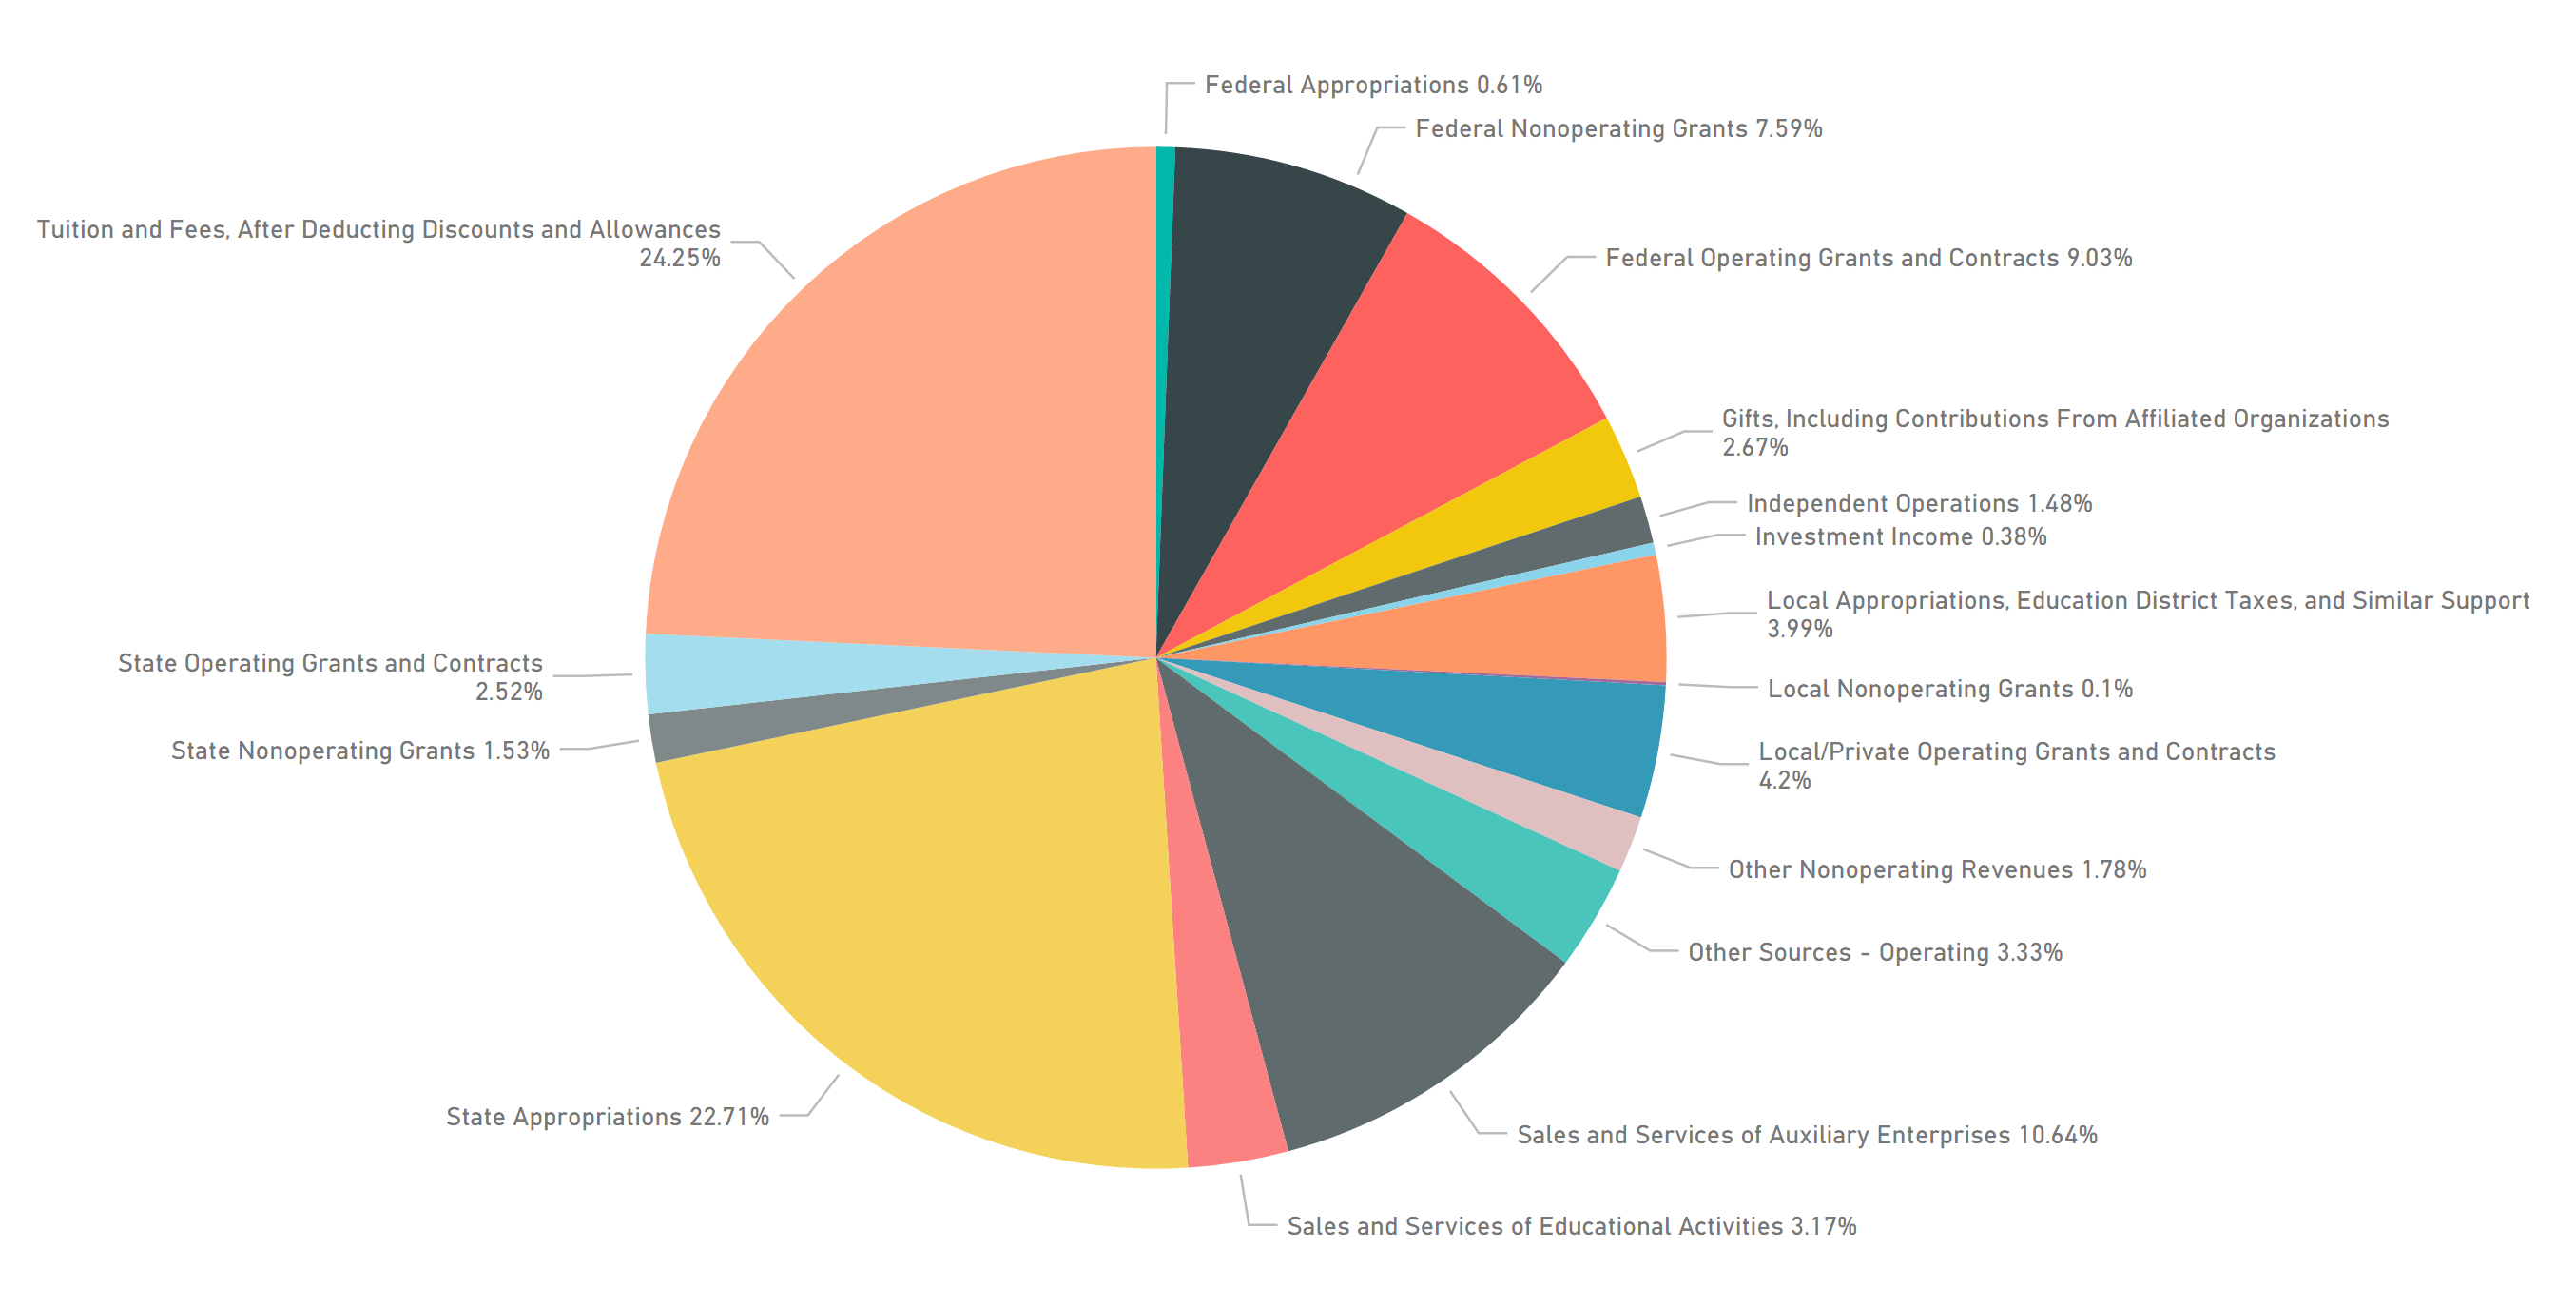
    In 2011, Tuition and Fees represented 20.6% of public institutional revenue. In 2015, it has increased to 24.25%. Most of the reshuffling of revenue has come from federal operating grants and contracts as noted by the graphs below. Interestingly, state appropriations have remained relatively constant. Similarly, non-profit institutions have seen tuition…

  • Do College Degrees Appreciate in Value?

    My first car was a Chevy Vega. For those old enough to remember, it was a tin can with wheels. It was the kind of car that when you arrived at the gas station, you said to the attendant (in the days of full-serve stations), “Fill it with oil and…

  • Visualizing Student Debt and Earnings

    Leveraging Scatterplots to Analyze the New College Scorecard Data There has always been a symbiotic relationship between student debt and student earnings. As student debt has creeped up in recent years, there has also been a data gap with post-graduation earnings. The most recent College Scorecard data is a first…

  • A Look at the New Education Outcome Measures Data

    The new IPEDS Outcome Measures (OM) survey is the first stab at going outside of the traditional first-time, full-time reporting. We took a birds-eye view of this data across the landscape of reporting institutions using a new Graduation Rates Interactive.  A total of 3,838 institutions reported data under the OM…

  • Infection Procedures Top Inpatient Volume Growth

    While Medicare inpatient procedure volume has remained flat since 2013, infections are a significant area of high volume change. The treemap below from the Inpatient Procedure Analysis Interactive shows the inpatient volume growth by procedure with color coding by volume change from 2013-2015 using the Medicare Provider and Analysis Review…