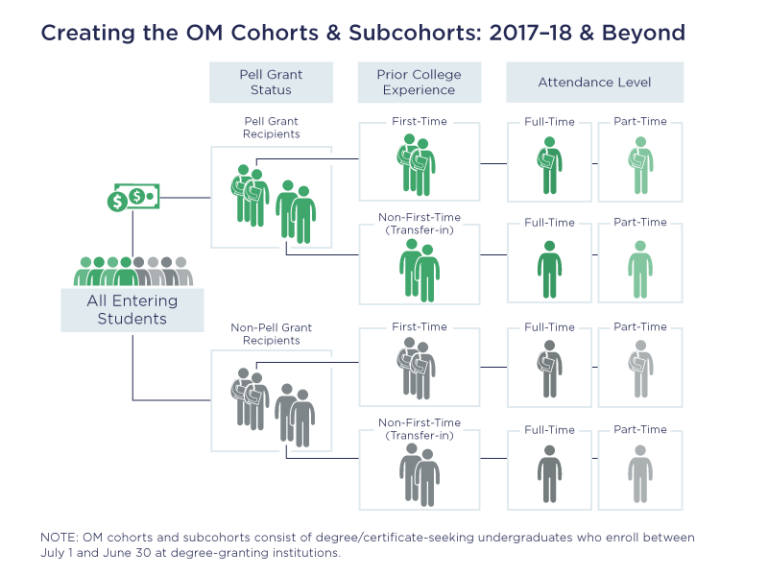
Several weeks ago, the Bureau of Labor Statistics (BLS) released updated Occupational Employment Statistics (OES) survey data. BLS OES is one of those foundational programs and datasets that are used for comprehensive occupational analysis. It produces employment and wage compensation estimates annually for nearly 800 occupations. These estimates are available for the nation as a whole, for individual states, and for metropolitan and non-metropolitan areas; national occupational estimates for specific industries are also available.
Programs like the OES are based implicitly on market stability. How?
- OES is an annual survey that blends data based on a three-year sample. The OES May, 2019 data for instance is based on data going all the way back to November, 2016. Three years is a long time, but fine in a reasonably predictable labor market.
- OES uses the Standard Occupational Classification (SOC) to define occupations. The last full standard for SOC codes is 2010 although the most recent OES survey does start to phase in the 2018 SOC standard.
The problem is that our economy unraveled in just two months. How much of that remains permanent is anyone’s guess. But no-one can say with a straight face that we are in a stable labor market.
When I tried to sell my house in 2013, I told the realtor that I expected a certain sales price. I reasoned that I built it 15 years earlier for “X” and therefore since building costs are up 30%, then I should sell it for “X times 1.3”. She then proceeded to give me a rookie lesson on housing pricing. I can rationalize that I can sell it for my price but the market dictated otherwise. “It may take years for my house to recover its value,” she said. Market listings set the price. Labor market, like housing is locked into forward indicators.
Job postings signal:
- Broader market demand
- Occupational demand, diversity, and price
- Occupational shifts, some of which are permanent
- New occupations categories – who would have heard of hiring thermal scanners, cart wipers and contact screeners?
- New skills or mix of skills required
- Ongoing home based jobs – who would have thought that location of employment would be so significant
Next Jobs Report Webinar – June 4, 2020
The next Jobs Report webinar is next Thursday, June 4, 2020. Please register now to attend this free webinar. We will provide an initial glimpse into May job postings activity and some of the broader labor market issues.
About Public Insight
Public Insight transforms the islands of public data into actionable insights with analytic datasets and Microsoft® Power BI to better understand your industry and market. Insight for Work is a labor market analysis service and dataset that provides a snapshot of current job postings and broader labor trends for assessing programs and staffing that meet market demand and skill requirements. Insight for Higher Education is an easy-to-use executive planning and analysis application for benchmarking higher education institutions across a wide range of topical areas such as enrollment, graduation rates, degrees awarded, and staffing. Request a 15-day free trial to explore any of our solutions.