Welcome to 2018! We are making some fundamental shifts to our Weekly Insights which I hope you will enjoy. We are moving our content towards more video and free self-service analysis around our weekly topical theme. We welcome your feedback and your ideas.
Over 70% of population health is now attributed to exogenous social factors. We will focus our attention from week to week on uncovering the nuggets of community health and development insights from the huge amounts of data in the public domain.
In this Weekly Insight, we looked at the issue of Income Inequality and specifically compared the 2013 American Community Survey results to the most recent 2016 data.
-
Those households at risk which we define as earning less than $25,000 represent about 1 in 5.5 households. This is down nominally from 2013 to 2016.
-
Households in the middle class (earning from $25,000 to less than $100,000) are 53.9% of households and also a slight decline from 2013.
-
Households earning over $100,000 increased 2% from 2013 to 2016 and now represent approximately 1 in 4 households. However geographically, these are concentrated in the coastal cities.
-
We found some interesting geographic variations which are described in the video blog (2 1/2 minutes).
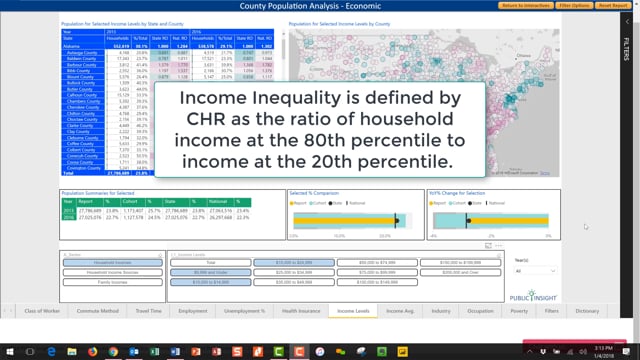
I created a free Interactive where you can select the household income level and the map will display the relative geographic concentrations based on the national average. The table also shows the counties with the highest concentrations of that particular income level. The Free Interactive is a stripped down version of the Income Levels topic in the new Population Analysis Interactive.

