Top Ten States with Growing Tuition Costs

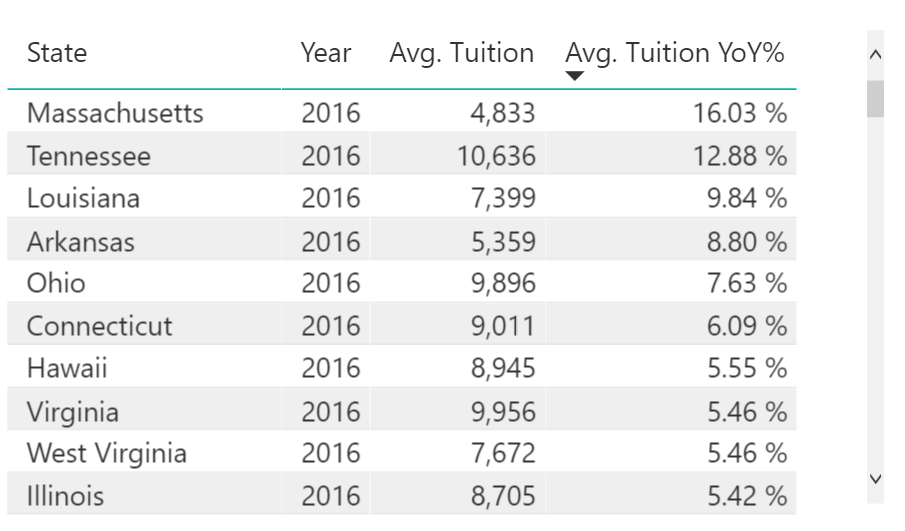
Nell Gluckman of The Chronicle of Higher Education wrote an interesting piece about the challenges of public cutbacks in the state of Louisiana. The premise of the article is that there are trickle-down implications of state cutbacks in tuition, faculty morale, and curriculum. Louisiana has passed along substantial tuition increases to its students. However, it has not had the highest tuition increases statewide since 2012. Using data from the Tuition and Pricing Interactive we rolled up the averages by state for two and four year public institutions to see which states have had the highest five-year tuition increases. 


Massachusetts while having the highest tuition increase over the five-year period has a still pedestrian average tuition of $4,833. The states with the highest average tuition for 2016?  Vermont and Pennsylvania at $15,857 and $14,358 although both have kept tuition flat since 2012.


Share This Story

Similar Posts

  • Private Room Average Hospital Stays up 10%

    While average length of stay has experienced a long-term decline, one component of average stay seems to be increasing – private rooms. The average stay in a private room increased nearly 10% based on an analysis of the 2016 Medicare Provider Analysis and Review (MedPAR) data set.    Even more…

  • Is Bureau of Labor Statistics Data Adequate?

    Several weeks ago, the Bureau of Labor Statistics (BLS) released updated Occupational Employment Statistics (OES) survey data. BLS OES is one of those foundational programs and datasets that are used for comprehensive occupational analysis. It produces employment and wage compensation estimates annually for nearly 800 occupations. These estimates are available…

  • Top 10 Projected Occupations in 2026

    Healthcare workers dominate the top 10 list for projected job growth. Nine of the top 10 jobs are projected to have greater than 30% growth over the coming 10 years. Using the new Degree-to-Jobs Interactive, we sorted the projections table by projected growth and isolated the top 10 jobs as shown…

  • Using AI to Break Down Head Count

    New Microsoft® Power BI Visual Dynamically Analyzes Categorical Data Like fashion goes in and out of style, so do visual ways of exploring data. Several decades ago I worked with a visual called the Decomposition Tree from an upstart company Proclarity from Boise, Idaho to analyze multi-dimensional data. That company…

  • Visualizing Student Debt and Earnings

    Leveraging Scatterplots to Analyze the New College Scorecard Data There has always been a symbiotic relationship between student debt and student earnings. As student debt has creeped up in recent years, there has also been a data gap with post-graduation earnings. The most recent College Scorecard data is a first…