Nursing, Computer Science Among Top Growth Program Areas in 2015

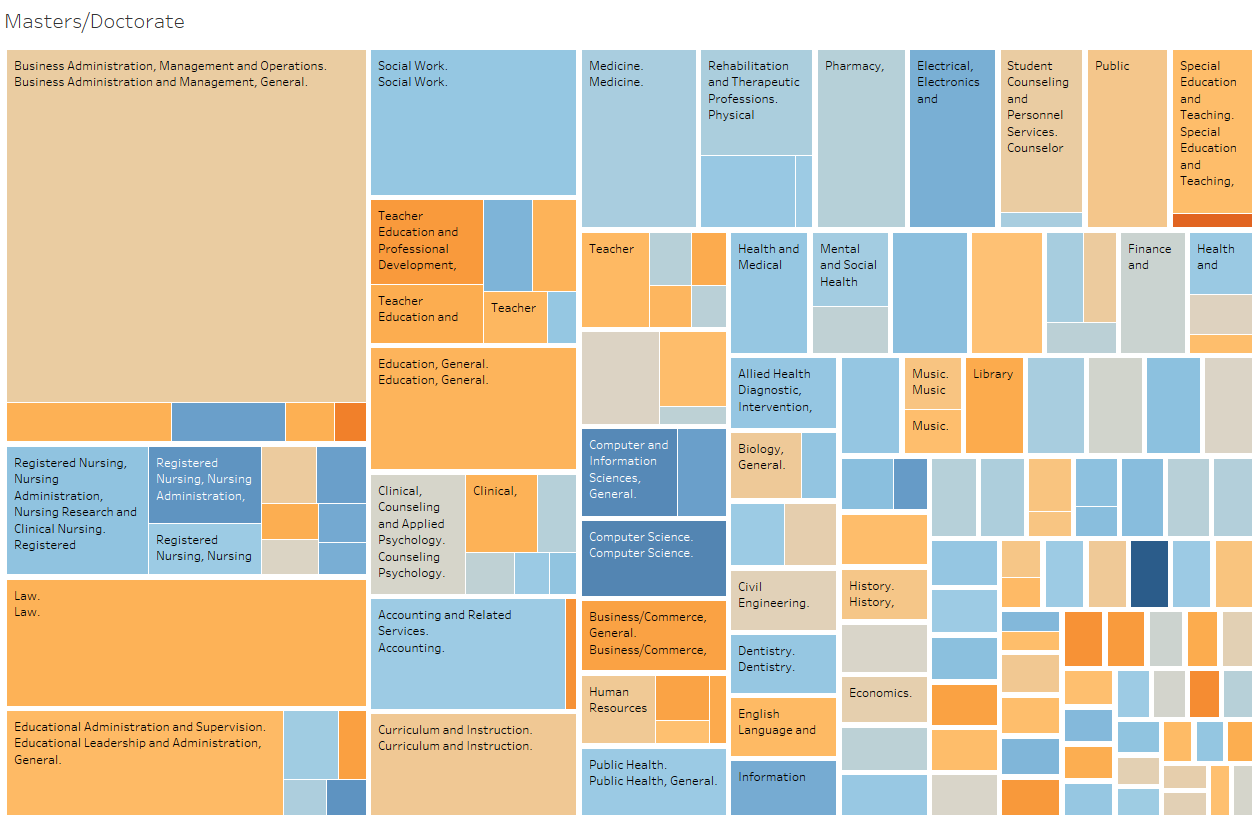
Nursing programs at a bachelor and master’s level continue to grow at a fast pace according to the most recent awards data from the Integrated Postsecondary Education Data System (IPEDS). Bachelor’s and Master’s level (see tree map left side blue growth area below) degrees for Registered Nurses (and related fields) both went up nearly 10% from 2014 to 2015. Employment projections for Registered Nurses is projected to increase 16% from 2014 to 2024 according to the most recent projections data from the Bureau of Labor Statistics. Skilled nursing is a train that has left the station and more and more medical diagnostic work will be pushed “downward” to nurses. I say that with some level of bias as my wife is a nurse. Interestingly, you just went to the CVS Minute Clinic this morning where a nurse practitioner diagnosed her with pneumonia and wrote a prescription for her care. Interestingly, Associate’s level degrees in nursing related programs actually declined 3.4% in 2015 perhaps reflective of the skill level needed.

 We looked at over 1,000 individual programs and screened out for only those that had a minimum of 1,000 degrees awarded in 2015. You can look at the programs yourself using the free Interactive.  At an Associate’s level, specific skilled programs such as culinary arts as a group went up 10%. What fascinated me however was a 31% increase in speech rhetoric and communication which is offered by 219 institutions. Finally, at a bachelor’s level, computer science was a clear winner with growth as well as health related professions. Criminal justice areas continue to show strong growth.


The Degree-to-Jobs Interactive provides program analysis as well as a look at the connected labor data from the BLS Employment Projections and Occupational Employment Statistics.
Share This Story

Similar Posts

  • Powerball and Endowment Wealth per Student

    Large dollars tend to attract many of us. That is why the Powerball attracted so many people at the tidy sum of 1.3 billion. Yet the larger the number, the more people participate. Someone had the brilliant idea of distributing Powerball winnings to everyone in the country thinking it would…

  • COVID-19 Dashboard with NYT Data

    Analyze COVID-19 Cases by National, State and County Level It is important for today’s business leaders to consider the impact of COVID-19 when making decisions and allocating resources. The accuracy of COVID-19 data reported by news sources and online publications goes beyond the numbers themselves, the interpretation of the statistics…

  • Tuition Bears Increasing Brunt of Higher Ed. Revenue

    In 2011, Tuition and Fees represented 20.6% of public institutional revenue. In 2015, it has increased to 24.25%. Most of the reshuffling of revenue has come from federal operating grants and contracts as noted by the graphs below. Interestingly, state appropriations have remained relatively constant. Similarly, non-profit institutions have seen tuition…

  • Distance Education Rebounds

    Distance Education is now 12.3% of all programs and up 7.6% in 2018 Social distancing, at least for now, is the new normal and along with it comes distance education. Each year we look at what the data is telling us for distance education programs. Last year, I suggested that…

  • When is a Job Essential?

    Critical Infrastructure Accounts for 60% of Jobs as the Rest Open Up The stay-at-home orders under the COVID-19 pandemic separated “essential” from “non-essential”. Businesses deemed essential stayed open. Those that were not essential shut down. Sometimes those lines were very blurred with individual states and even communities making those choices…