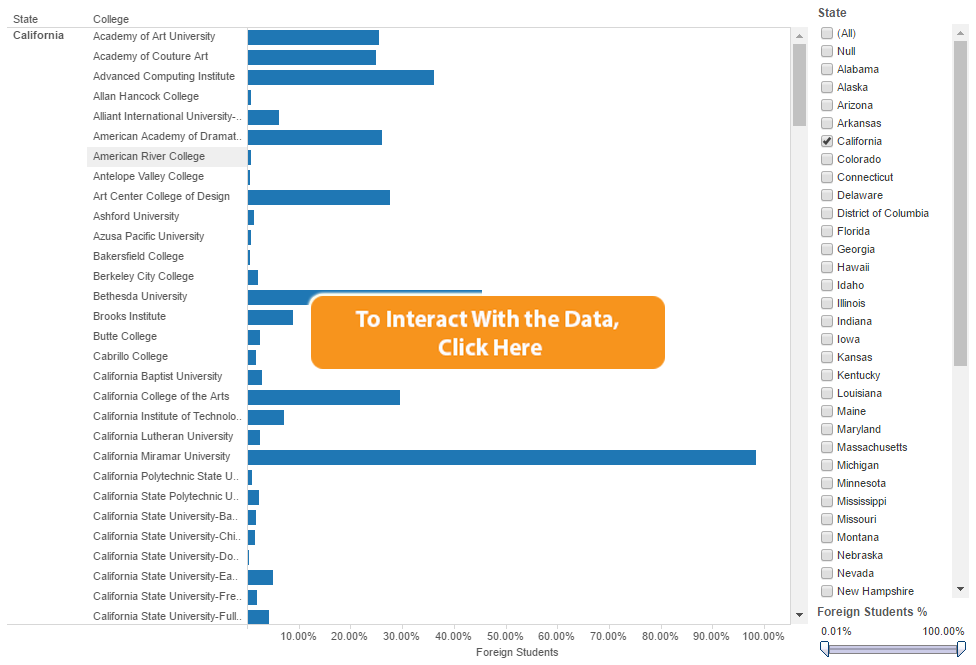
International Student Enrollment Visualized

In last week’s blog, we talked about out of state enrollment and its potential impact on both the diversity and finances of the university. International enrollment is even considered a bigger potential bonanza to colleges and universities as many international students pay full tuition. According to the Institute of International Education, international student enrollment increased 10% in 2014-15, the highest rate of growth since 1978-79.


As we did last week, we extracted reported international enrollment as a percentage of overall enrollment using OmniView. You can review the list of institutions and their international enrollment percentages using the Tableau visualization that we’ve created. To interact with this data visualization, click HERE.


Share This Story

Similar Posts

  • How Long Should You Wait in the Emergency Room?

    We recently had a health scare where a family member spent over 12 hours in the emergency room. While she was not thrilled to spend so much time there, she did ultimately get good medical care. So what is excessive time in the emergency room?   Centers for Medicare &…

  • College Building Boom Approaches $1 Trillion

    Postsecondary institutions continue to invest heavily in capital assets and the cumulative investment across public and private institutions has crossed $900 billion, an increase of 27% over a five-year period. The capital investment growth rates are almost identical for both public institutions and private non-profit institutions as noted in the…

  • Hot Educational Programs in 2018

    Econometrics Programs Show Nearly Triple Digit Growth I am delighted to return to the blogosphere community. It has been a few months since we have published a blog, but not for a lack of work going on behind the scenes here at Public Insight. You will notice that our blog…

  • Student Default Rates for 2014 Flatten at 15.4%

    Last week we looked at student repayment rates and noted that longer-term repayment rates continue to decline for five and seven year repayment periods. Repayment rates are in essence a measure of optimism as it is the percentage of students who have made progress in paying down their student loans….

  • Regional Disparities in Health Insurance

    We all know that health insurance is a moving target. According to the most recent ACS survey data, the national uninsurance rate declined from 13.0% to 11.7% in 2016. Public insurance coverages increased slightly more than private coverages (increases of .9% and .6%) respectively. This change was short-lived as Gallup…

  • Diving Deeper into Opioid Prescriber Data

    Last week we introduced the new CMS opioid data set and what it means. This data tries to initiate transparency around this hot topical area even though Part D Medicare claims may not be the best proxy of all opioid prescription activity. There are three elements to this data: Part…