New Labor Market Analysis Application Released by Public Insight
The COVID-19 reality is starting to reflect itself in the labor market. Volatility in the labor market will be the new normal for the foreseeable future. We analyzed and coded over 2 million active job postings as of past Saturday, March 28 to find that 1 in 5 jobs that were posted in the month of March are either in healthcare or the military. Nursing by itself is 1 in 10 jobs. We have created a powerful new Microsoft® Power BI Free Interactive to navigate through these March job postings by Standard Occupational Classification and by state and county. For example, one immediate observation is the ramp-up of healthcare workers in California.
Most approaches to the labor market look in the rear-view mirror. For example, telling us that there were 3.3 million unemployment claims filed last week is old news. Looking ahead to what is coming on the horizon in the form of job postings will signal the new mix of jobs as we come out of this crisis. Using the labor market to see what lies ahead has been a passion of ours for several years.
I am pleased to announce that we have released a new product, Insight for Work. Insight for Work is a self-service labor market analysis application and subscription service that curates job postings and integrates this data with the Occupational Information Network (O*NET), Bureau of Labor Statistics (BLS), and the Integrated Postsecondary Education Data System (IPEDS). Each month we will add new labor market activity to maintain a cumulative analysis. One of the unique characteristics of Insight for Work is that it is a completely open framework and dataset with full job posting traceability.
Insight for Work Demonstration Video
Insight for Work is now immediately available. Subscriptions are available on an annual or month-to-month basis. Sign-up for a 15-day trial with no obligation.
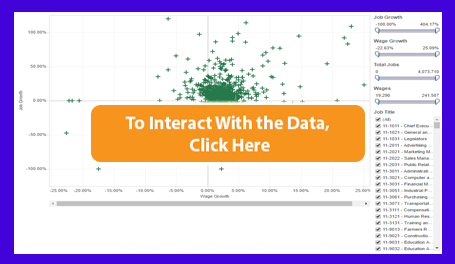
Free Interactive
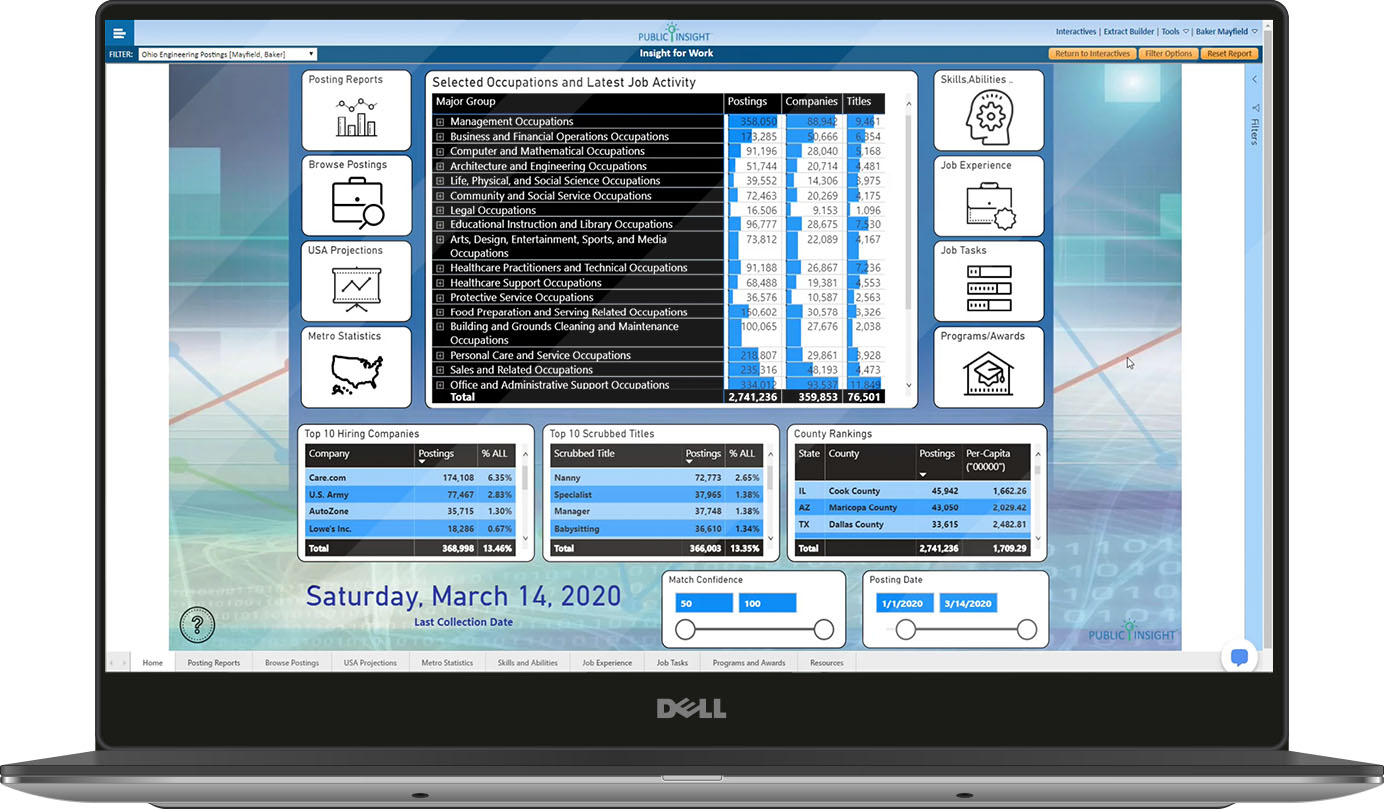
This Interactive provides a snapshot of over one million job postings in the month of March. Features include:
- Select any occupation or group of occupations using the hierarchical slicer
- Drill-down through the tree-map from major occupational group to detailed occupation
- Drill down from state to county in the map view
- Use Interactions by clicking on any data block on the tree map to cross-filter the map or vice versa
You can drill-down using the visual floating toolbar or by right-clicking on the visual data block and selecting drill-down.
About Public Insight
Public Insight transforms the islands of public data into actionable insights with analytic datasets and Microsoft® Power BI to better understand your industry and market. Insight for Work is a labor market analysis service and dataset that provides a snapshot of current job postings and broader labor trends for assessing programs and staffing that meet market demand and skill requirements. Insight for Higher Education is an easy-to-use executive planning and analysis application for benchmarking higher education institutions across a wide range of topical areas such as enrollment, graduation rates, degrees awarded, and staffing. Request a 15-day free trial to explore any of our solutions.