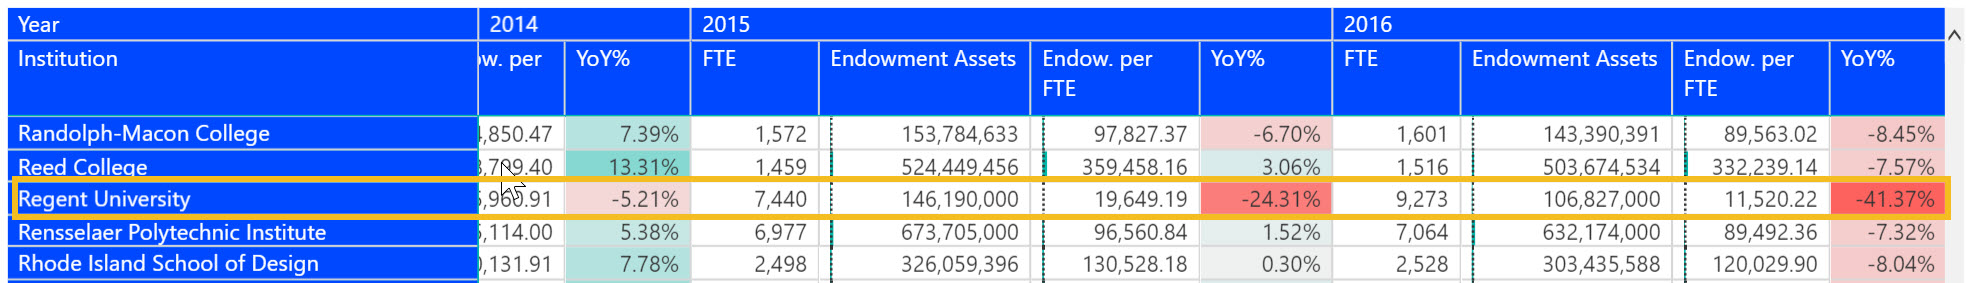
Endowments per Student Down in 2016
How financially fit is your institution? One of the measures that Forbes has used in assessing the financial fitness of postsecondary institutions is endowment assets per FTE. This metric takes the value of endowment assets at the end of the year and divides it by the number of FTE’s. In…