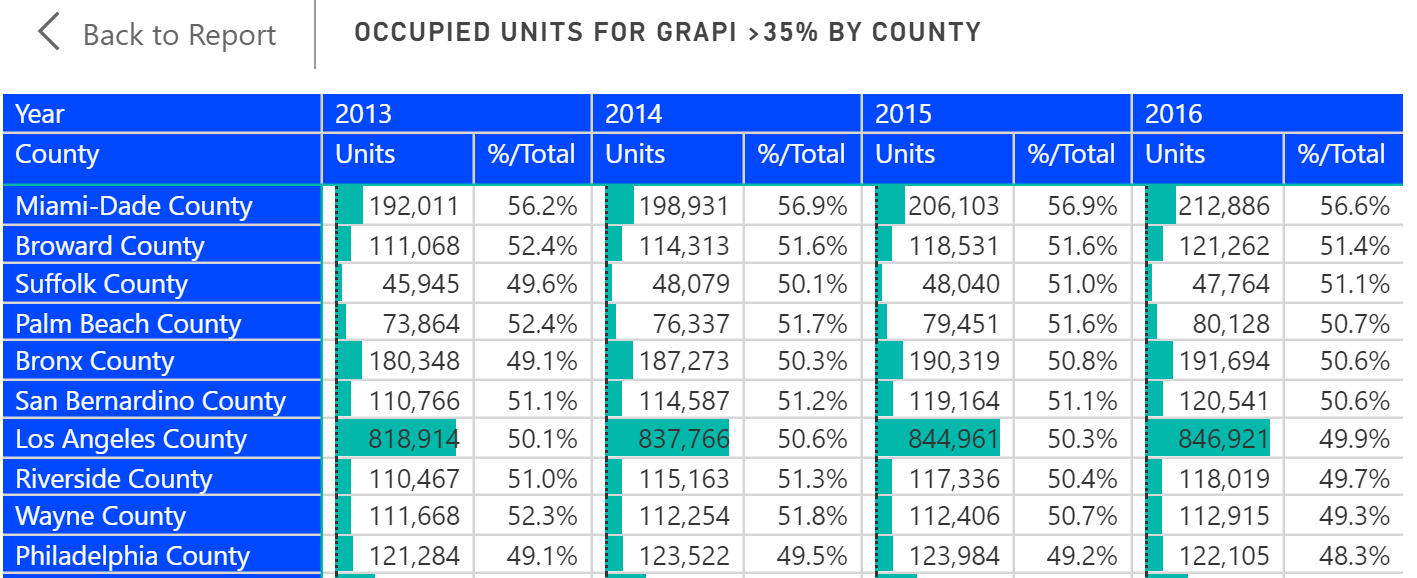
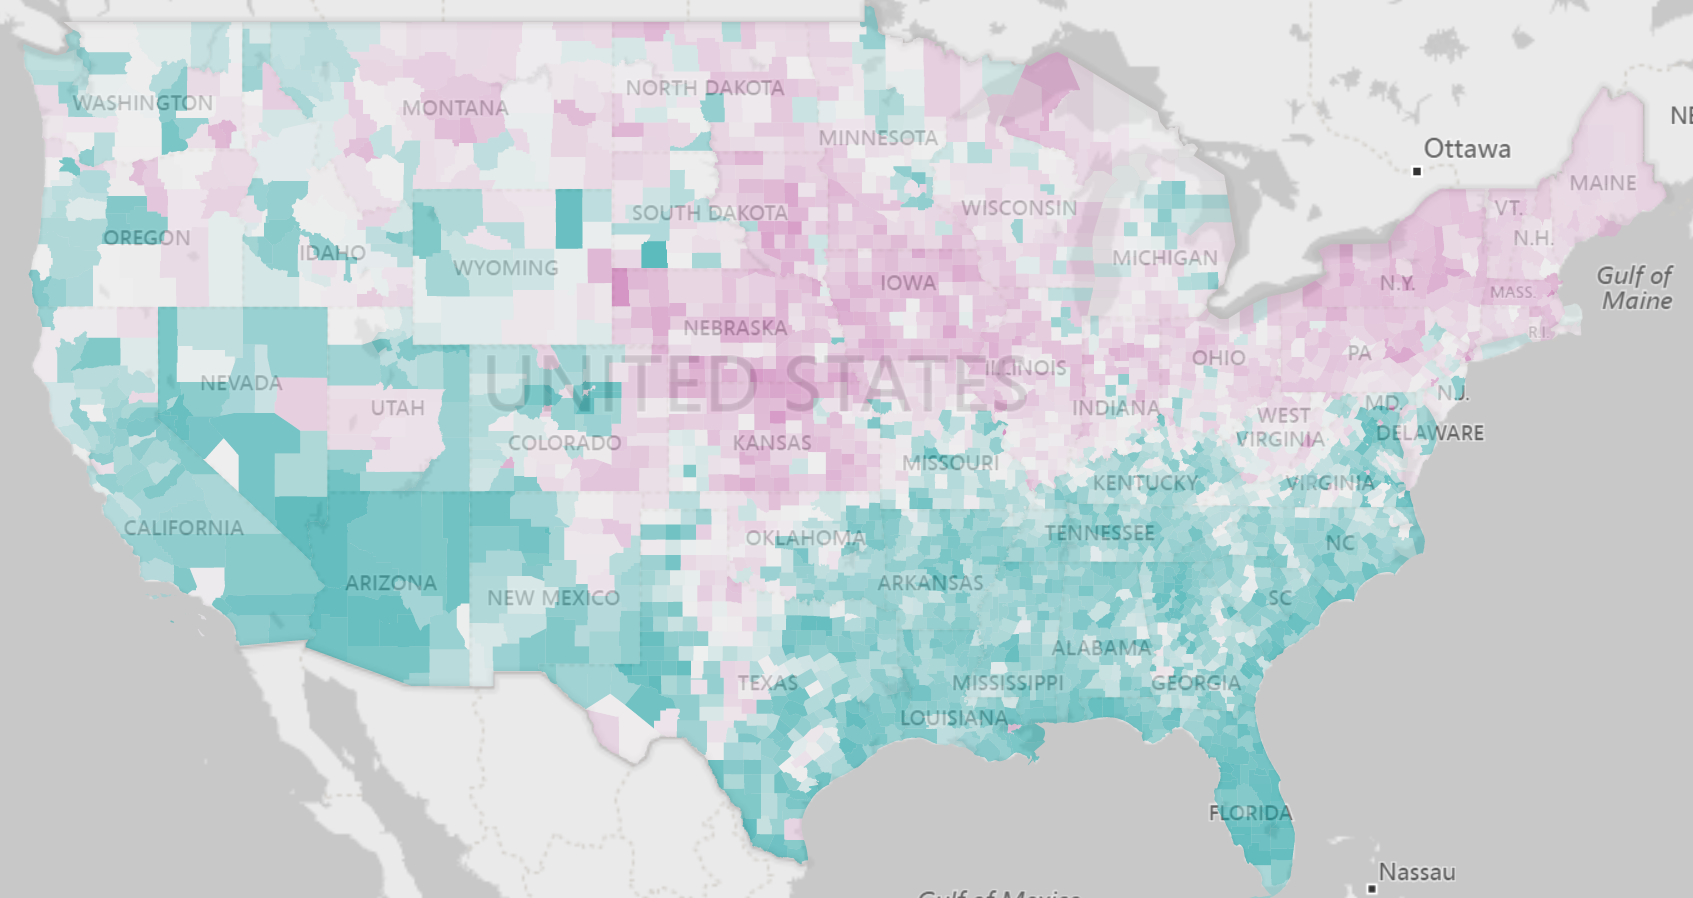
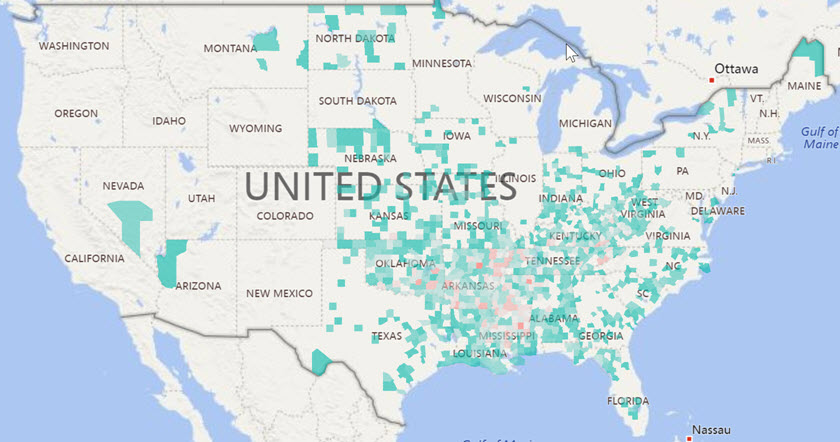
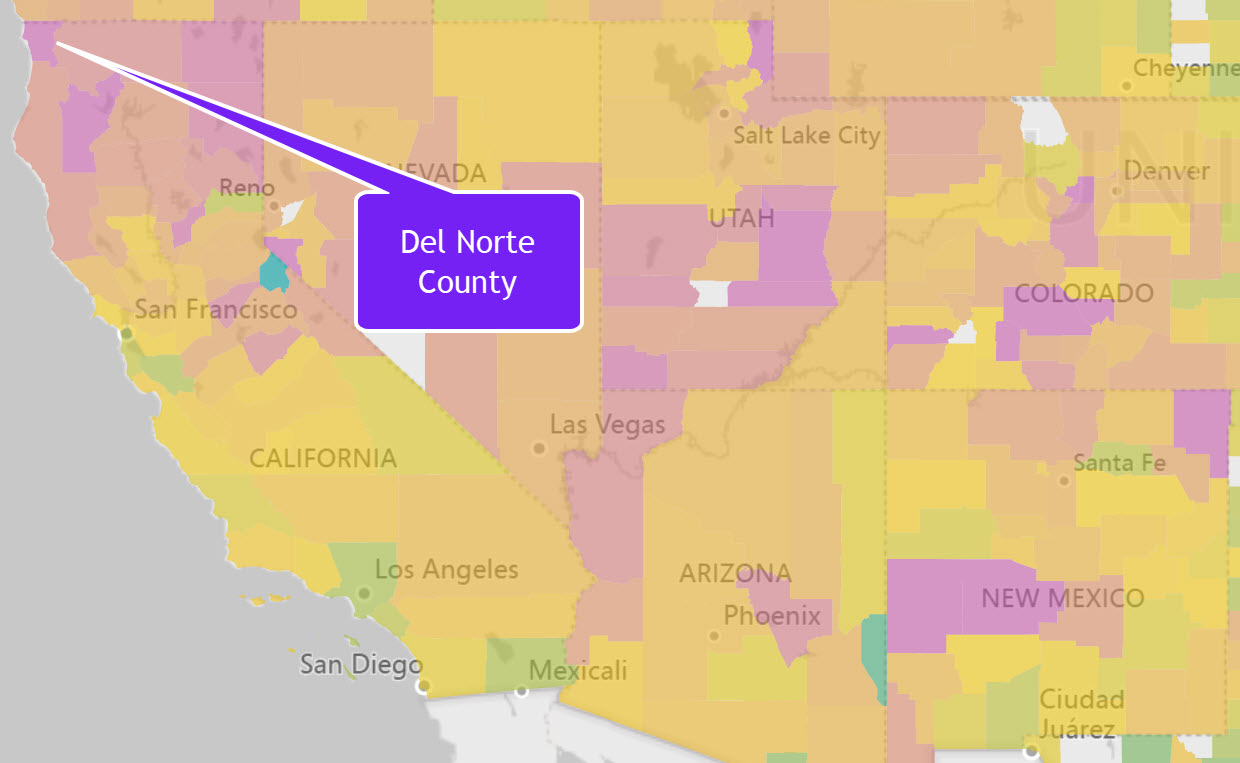
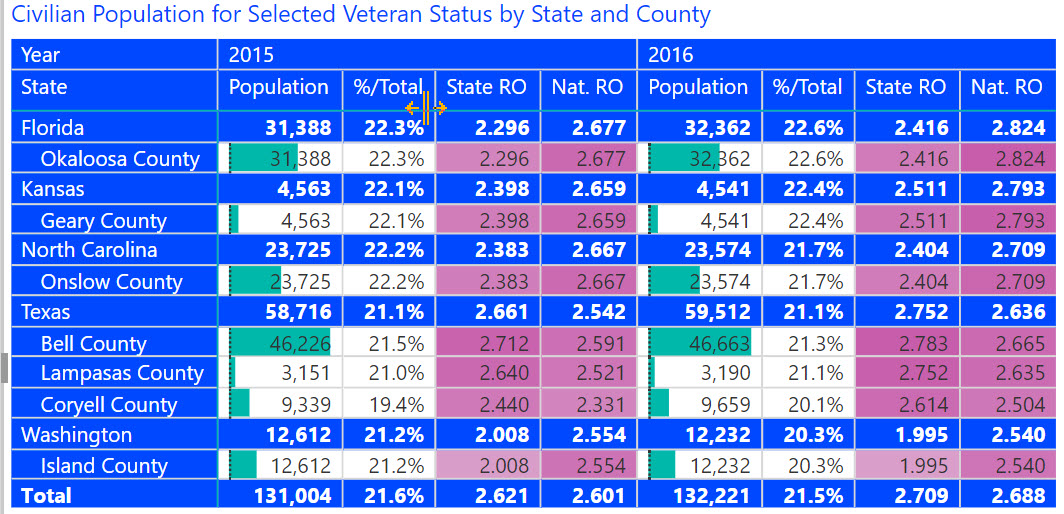
Blog

  • CMS Releases 2016 Opioid Prescription Data

    This week, CMS released 2016 Opioid Part D Prescribing Rates data which follows on the heels of the original release several months ago. This data release includes Opioid prescriber, claims, and extended release claims at the national, state, county, and zip code level. We have updated our Opioid Prescribing Rates…

  • Endowments per Student Down in 2016

    How financially fit is your institution? One of the measures that Forbes has used in assessing the financial fitness of postsecondary institutions is endowment assets per FTE. This metric takes the value of endowment assets at the end of the year and divides it by the number of FTE’s. In…

  • Black Disparities in Premature Death

    County Health Rankings has always used Premature Death as a measure in deriving its ranking formula. Years of Potential Life Lost Before Age 75 (or YPLL) counts as 50% of the Health Outcomes score. Every death occurring before the age of 75 contributes to the total number of years of potential…

  • Villanova vs. Michigan in Athletic Costs

    Villanova clearly dominated Michigan on the basketball court and has now won the NCAA Men’s basketball tournament two of the last three years. But how has that success translated to other sports and to the athletic costs in general.    The Equity in Athletics data is released annually by the…

  • Distance Education Programs up 8.2%

    Distance Education continues its upward climb according to the most recent distance education data from IPEDS. The number of programs increased 8.2% in 2016, but this increase was less than the whopping 12.6% in 2015. There are now over 29,000 programs offered through distance education. Certificate programs continued their strong…

  • CDC Publishes 2016 Natality (Births) Data

    The CDC recently released updated Natality (Births) data for 2016. State laws require birth certificates to be completed for all births, and Federal law mandates national collection and publication of births and other vital statistics data. The National Vital Statistics System provides access to statistical information from birth certificates and CDC makes…

  • Breaking Down Net Price, Tuition, and Aid

    Reports by College Board and others have indicated that net price, the true measure of what a student pays to attend college, continues to rise. College Board has maintained that the actual net price has been increasing for six to eight straight years.    Net price is defined as the…

  • A Look at the New Education Outcome Measures Data

    The new IPEDS Outcome Measures (OM) survey is the first stab at going outside of the traditional first-time, full-time reporting. We took a birds-eye view of this data across the landscape of reporting institutions using a new Graduation Rates Interactive.  A total of 3,838 institutions reported data under the OM…

  • STEM Enrollment Fields Show Strong Growth

    The IPEDS Enrollment by Major Fields of Study is collected every other year and 2016 is a new reported year. IPEDS collects nine major fields of study and the enrollment is disaggregated by attendance status (full-time, part-time), level (undergraduate, graduate), race, and gender.   There are numerous ways to breakdown…

  • Diving Deeper into Opioid Prescriber Data

    Last week we introduced the new CMS opioid data set and what it means. This data tries to initiate transparency around this hot topical area even though Part D Medicare claims may not be the best proxy of all opioid prescription activity. There are three elements to this data: Part…

  • Regional Variations in Opioid Prescribing Rates

    Given the state of the opioid crisis, any meaningful data is valuable. So when CMS released three years of Opioid Part D prescription data in November, we all rejoiced. CMS also released a mapping tool to analyze the data. While mapping tools can be effective, they can also get in…

  • As the Economy Grows, So Does Poverty

    There is a general perception that a rising economy raises all economic boats. But poverty rates would indicate that the poorest of the poor just seem to get poorer. Many counties have actually experienced a rise in poverty rates from 2012 to 2016. We took a quick look at the…