Econometrics Programs Show Nearly Triple Digit Growth
I am delighted to return to the blogosphere community. It has been a few months since we have published a blog, but not for a lack of work going on behind the scenes here at Public Insight. You will notice that our blog is now called Power Insights. Our mission is to decode the landscape of higher education data and to educate our readers on how to unlock the power of Microsoft® Power BI to analyze this vast data. As part of this blog, we promise to create lots of useful content that you can use right within the blog itself. Look for content to be published twice a month under this format.
Recently the Integrated Postsecondary Education Data System (IPEDS) released its first wave of updated data. This first wave included data on completions, awards, distance education programs, institutional characteristics, and tuition. The awards data is always my favorite slug of data because it reveals what programs are emerging. Awards data are classified based on the award level (e.g. associates, bachelors, masters, etc.) and Classification of Instructional Programs (CIP), a taxonomy that supports field of study analysis. CIP codes are organized into a 2-digit, 4-digit, and 6-digit hierarchy. By using the CIP hierarchy where it is available, we can easily see what is working well and what is not.
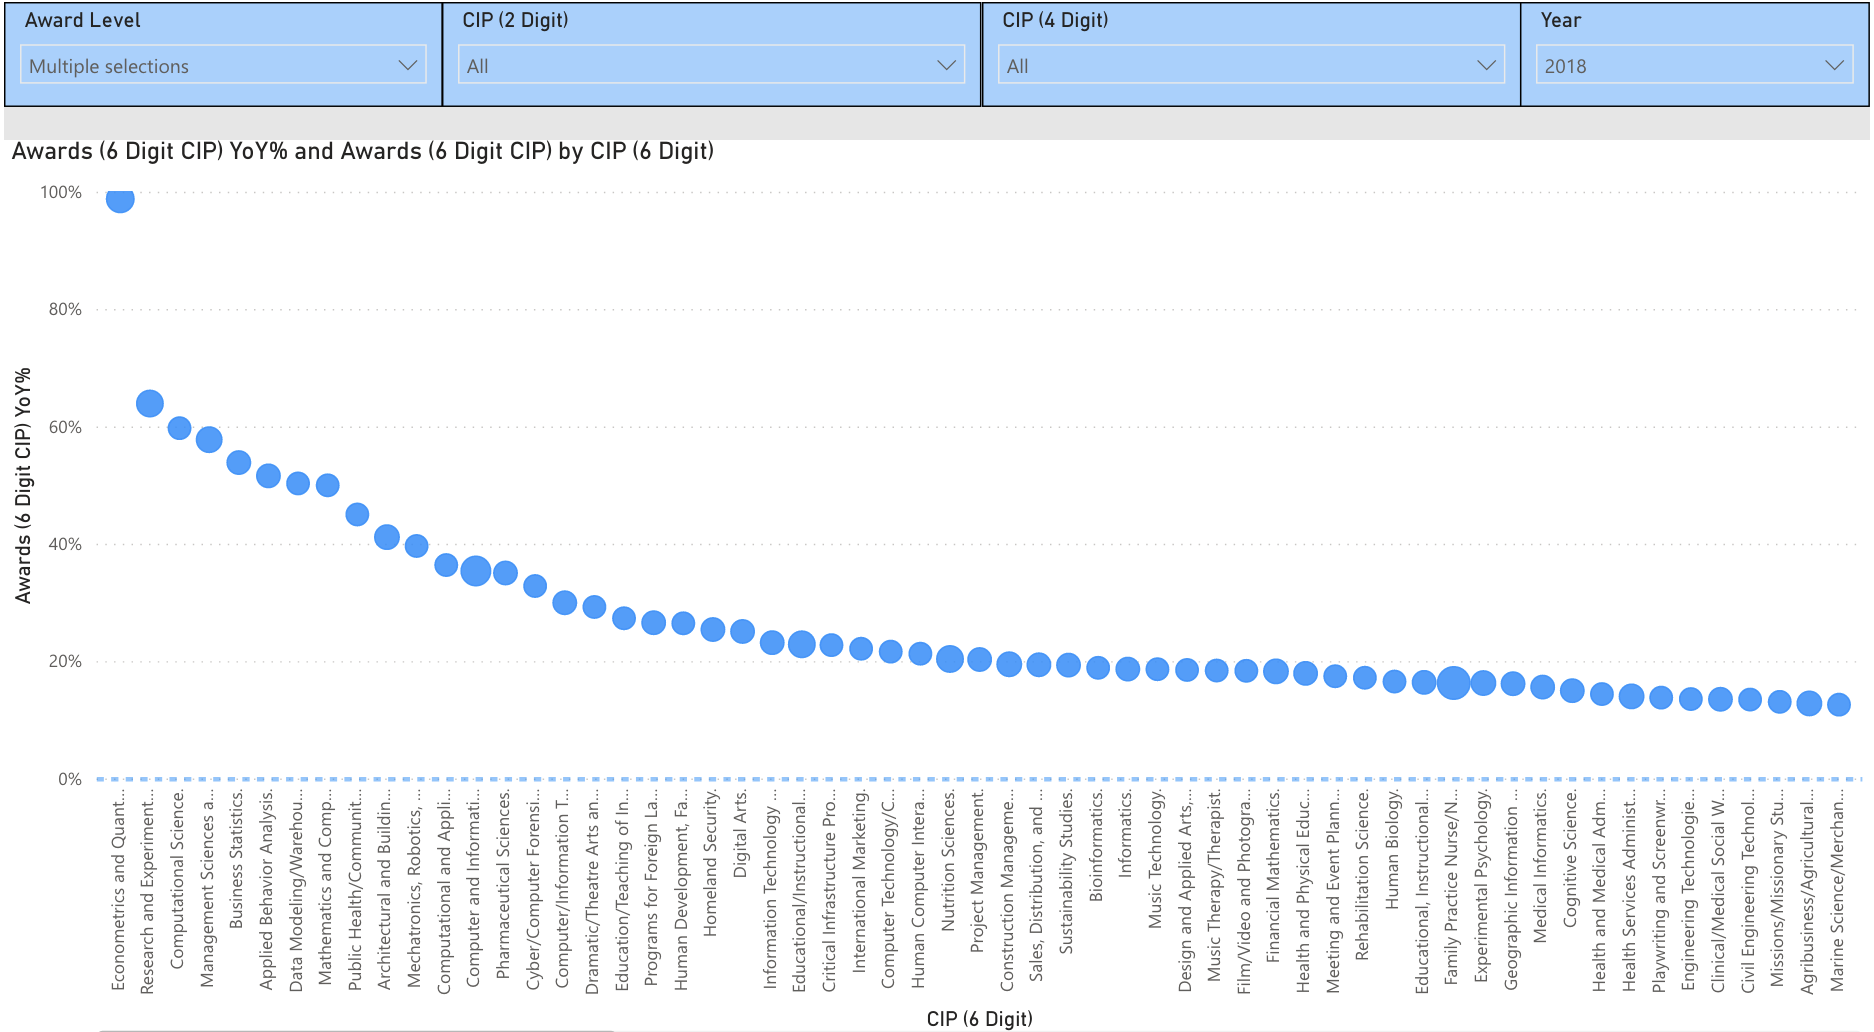
So what programs are hot? For our purposes, we have defined hot programs based on the year-over-year change. While there are many ways to display this, we have chosen the scatterplot and have put the 6-digit CIP code into the X-axis and the year-over-year percentage change into the Y-axis. The neat thing about scatterplots is that you can apply many different attributes such as color, size, as well as the axes. In this example, we have made the size equal to the absolute number of awards. We have also put a minimum of 500 awards within the visual so that the boutique programs are not included.
The hottest programs by award level are as follows:
| Award Level | 6-digit CIP | YoY% |
| Associates | Electromedical and Instrumentation | 84.93% |
| Bachelors and Masters | Econometrics and Quantitative Economics | 98.92% |
Use the embedded visual yourself to find those hot growth program changes of 2018. You can adjust the desired award level as well as play with the 2-digit and 4-digit CIP categories in the embedded visual.
About Public Insight
Public Insight transforms the islands of public data into actionable insights with analytic datasets and Microsoft® Power BI to better understand your industry and market. Insight for Higher Education is an easy-to-use executive planning and analysis application for benchmarking higher education institutions across a wide range of topical areas such as enrollment, graduation rates, degrees awarded, and staffing. Sign up for a free Factbook Interactive to explore how easy it is to navigate through public data.