
Public Insight’s July 2026 Jobs Report summarizes market data from the millions of job postings, resumé updates and employer reviews available in our TalentView platform.
Summary – July 2026 Jobs Report
What are Key Job Market Metrics in July?
- Job postings increased 3.5% vs. June and were down 19.3% on a year-over-year basis
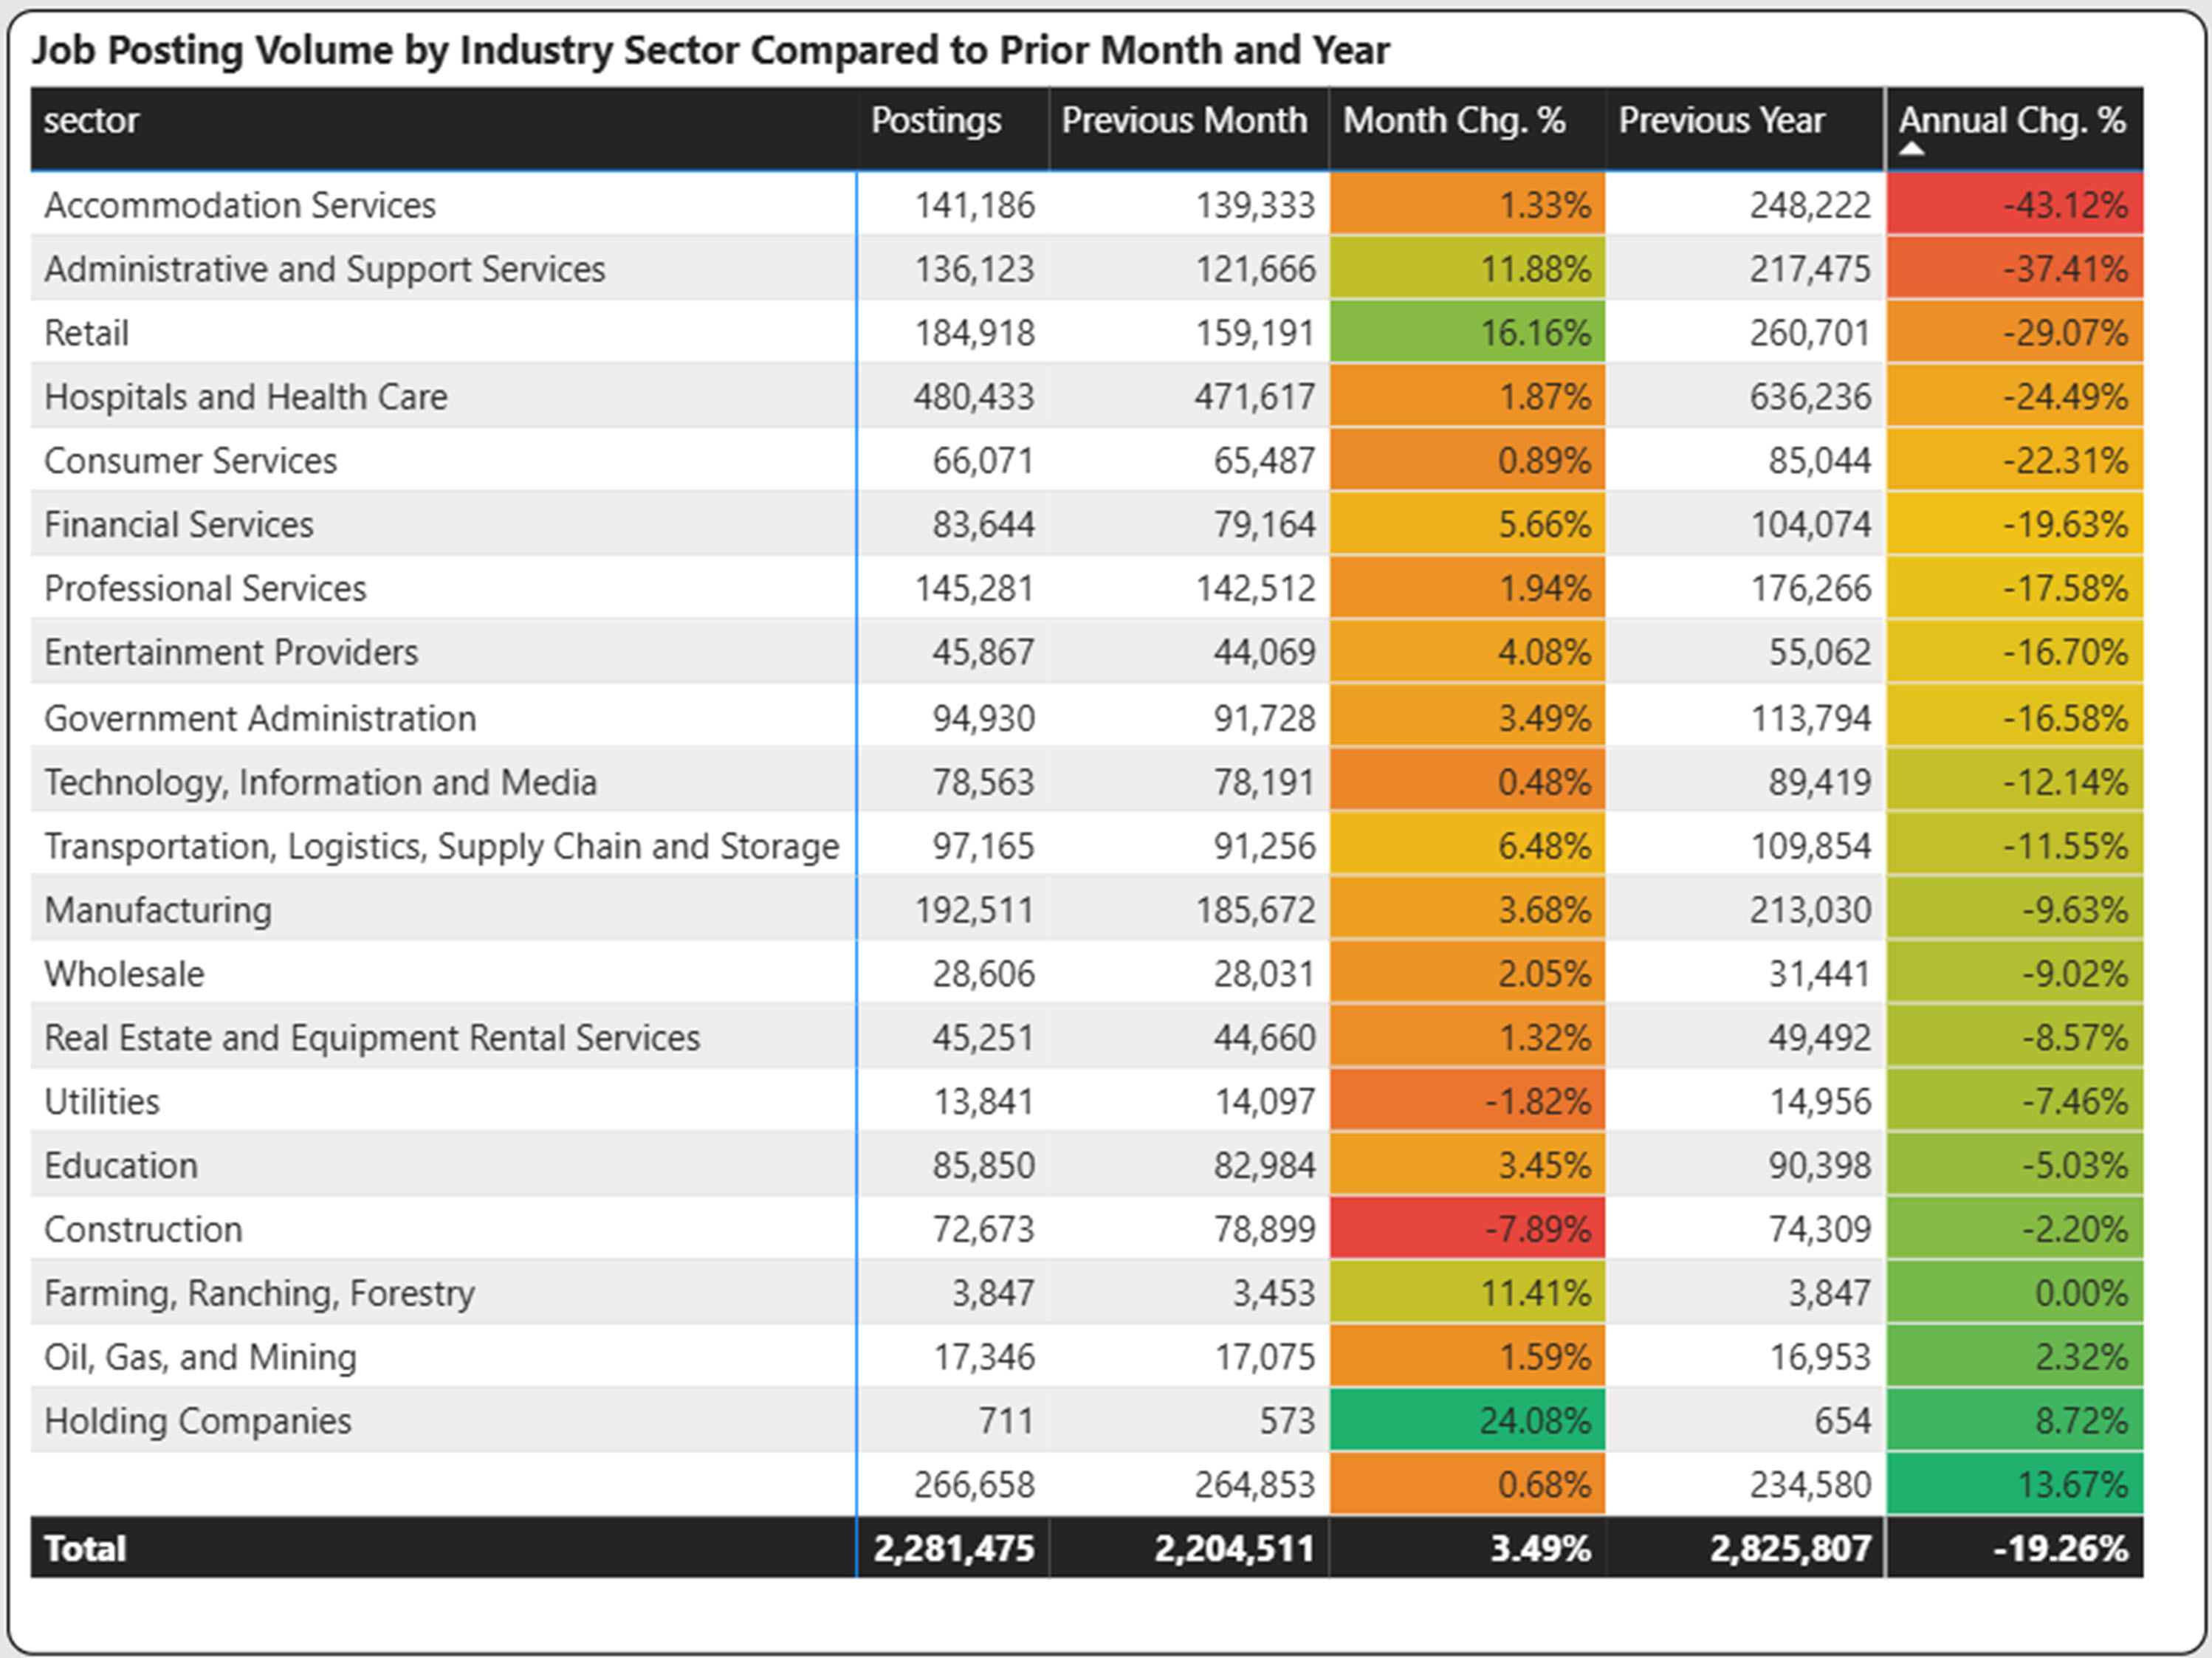
- Retail industry job postings increased the most in July at 16.16%
- Construction had the largest decline of job postings at 7.89%
- Fill days average was flat at 48.8 days
- Open days average was flat at 57 days
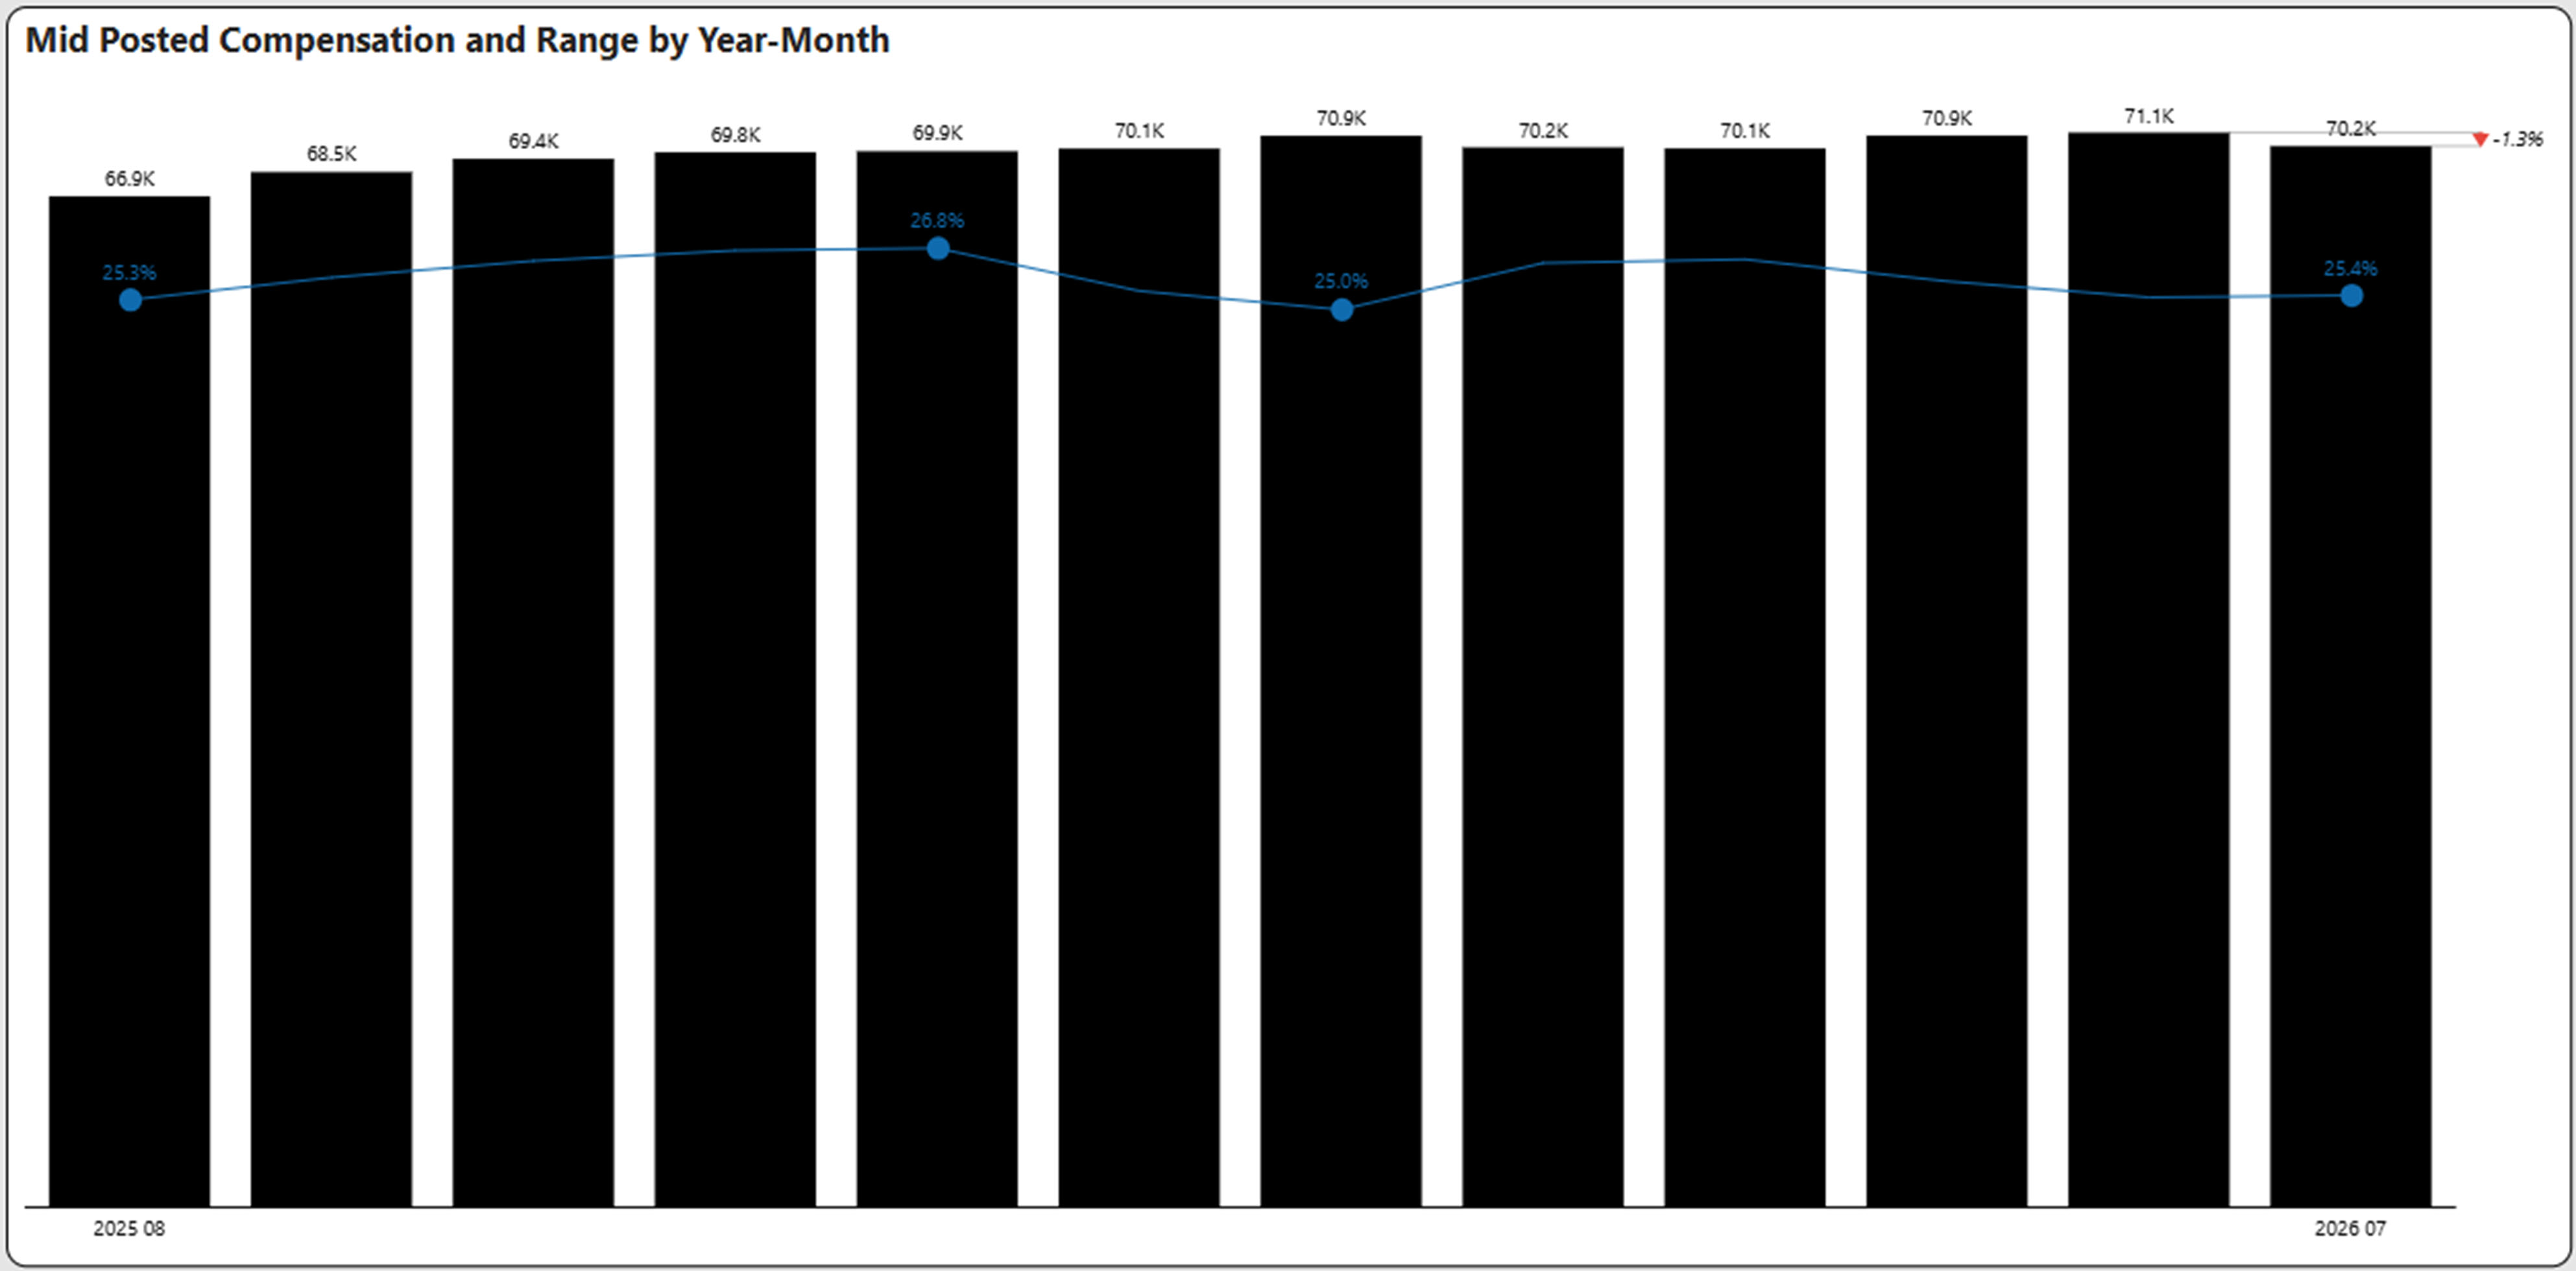
- Average comp was $70,200, a 1.3% decrease from June, and 5% increase from July 2025
- The average comp in the Transportation industry is at a 12-month high
- Transportation industry had worker demand increases in June and July
- Accommodation Services and Retail maintain their over supply of workers across 9 months, but Retail had demand increase in July
- Business Outlook from employee reviews data increased slightly to 62.4%
What are July’s Job Posting Trends?
July Job Postings Increased 3.5% from June
July 2026 job postings (via Indeed) increased 3.5% from June and were down 19.3% on a year-over-year basis.
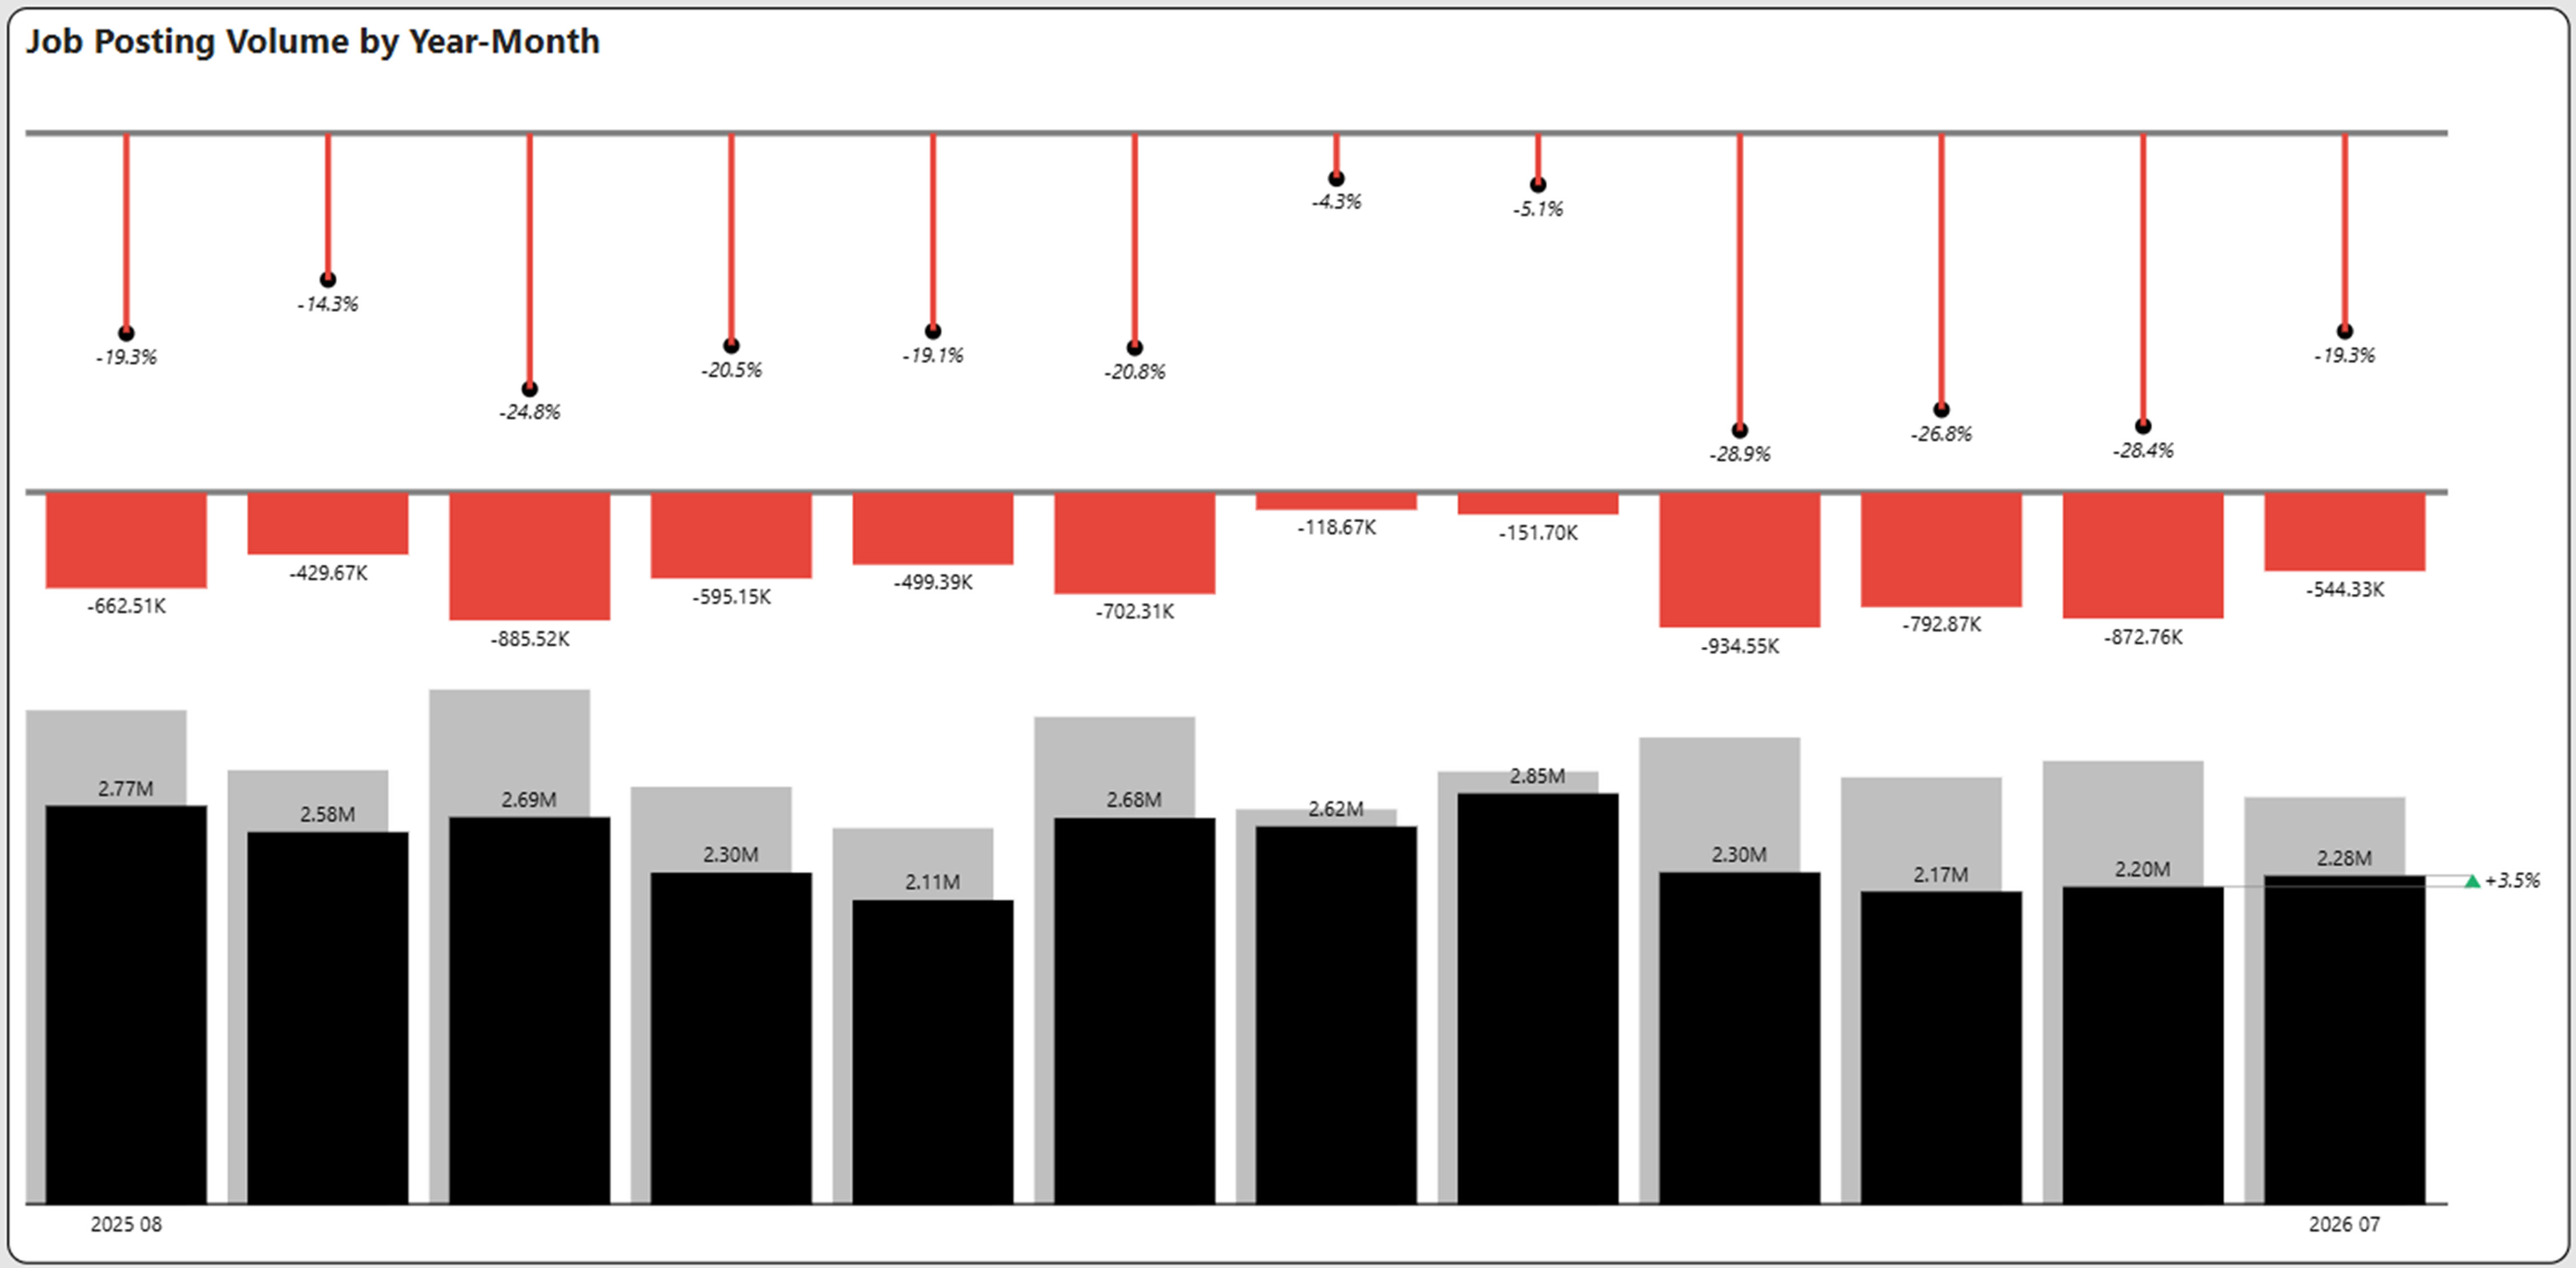
This year over year decrease in postings is not comparable. Indeed made significant changes effective April 1st to limit or eliminate free, organic, single-source XML/API job feeds. Approved integrated ATS solutions can still push jobs via Indeed Apply. Our estimation is that the impact on postings was between 15-20%. Indeed believes that these changes will significantly increase the quality of postings.
Year-over-year declines have become consistent in the current job market. So far this year, March had the highest amount of job postings at 2.85 million.
Industry Job Posting Trends – The Retail Sector Increased the Most in July at 16.16% Compared to June
- Administrative and Support Services also increased double digits at 11.88%.
- Construction had the largest decline from June to July at 7.89%.
- Nearly every sector declined in July 2026 vs July 2025. The top three decliners were Accommodation Services (-43.12%), Administrative and Support Services (-37.41%) and Retail (-29.07%), respectively.
Sponsored Ad Rates Maintain Increase Since April
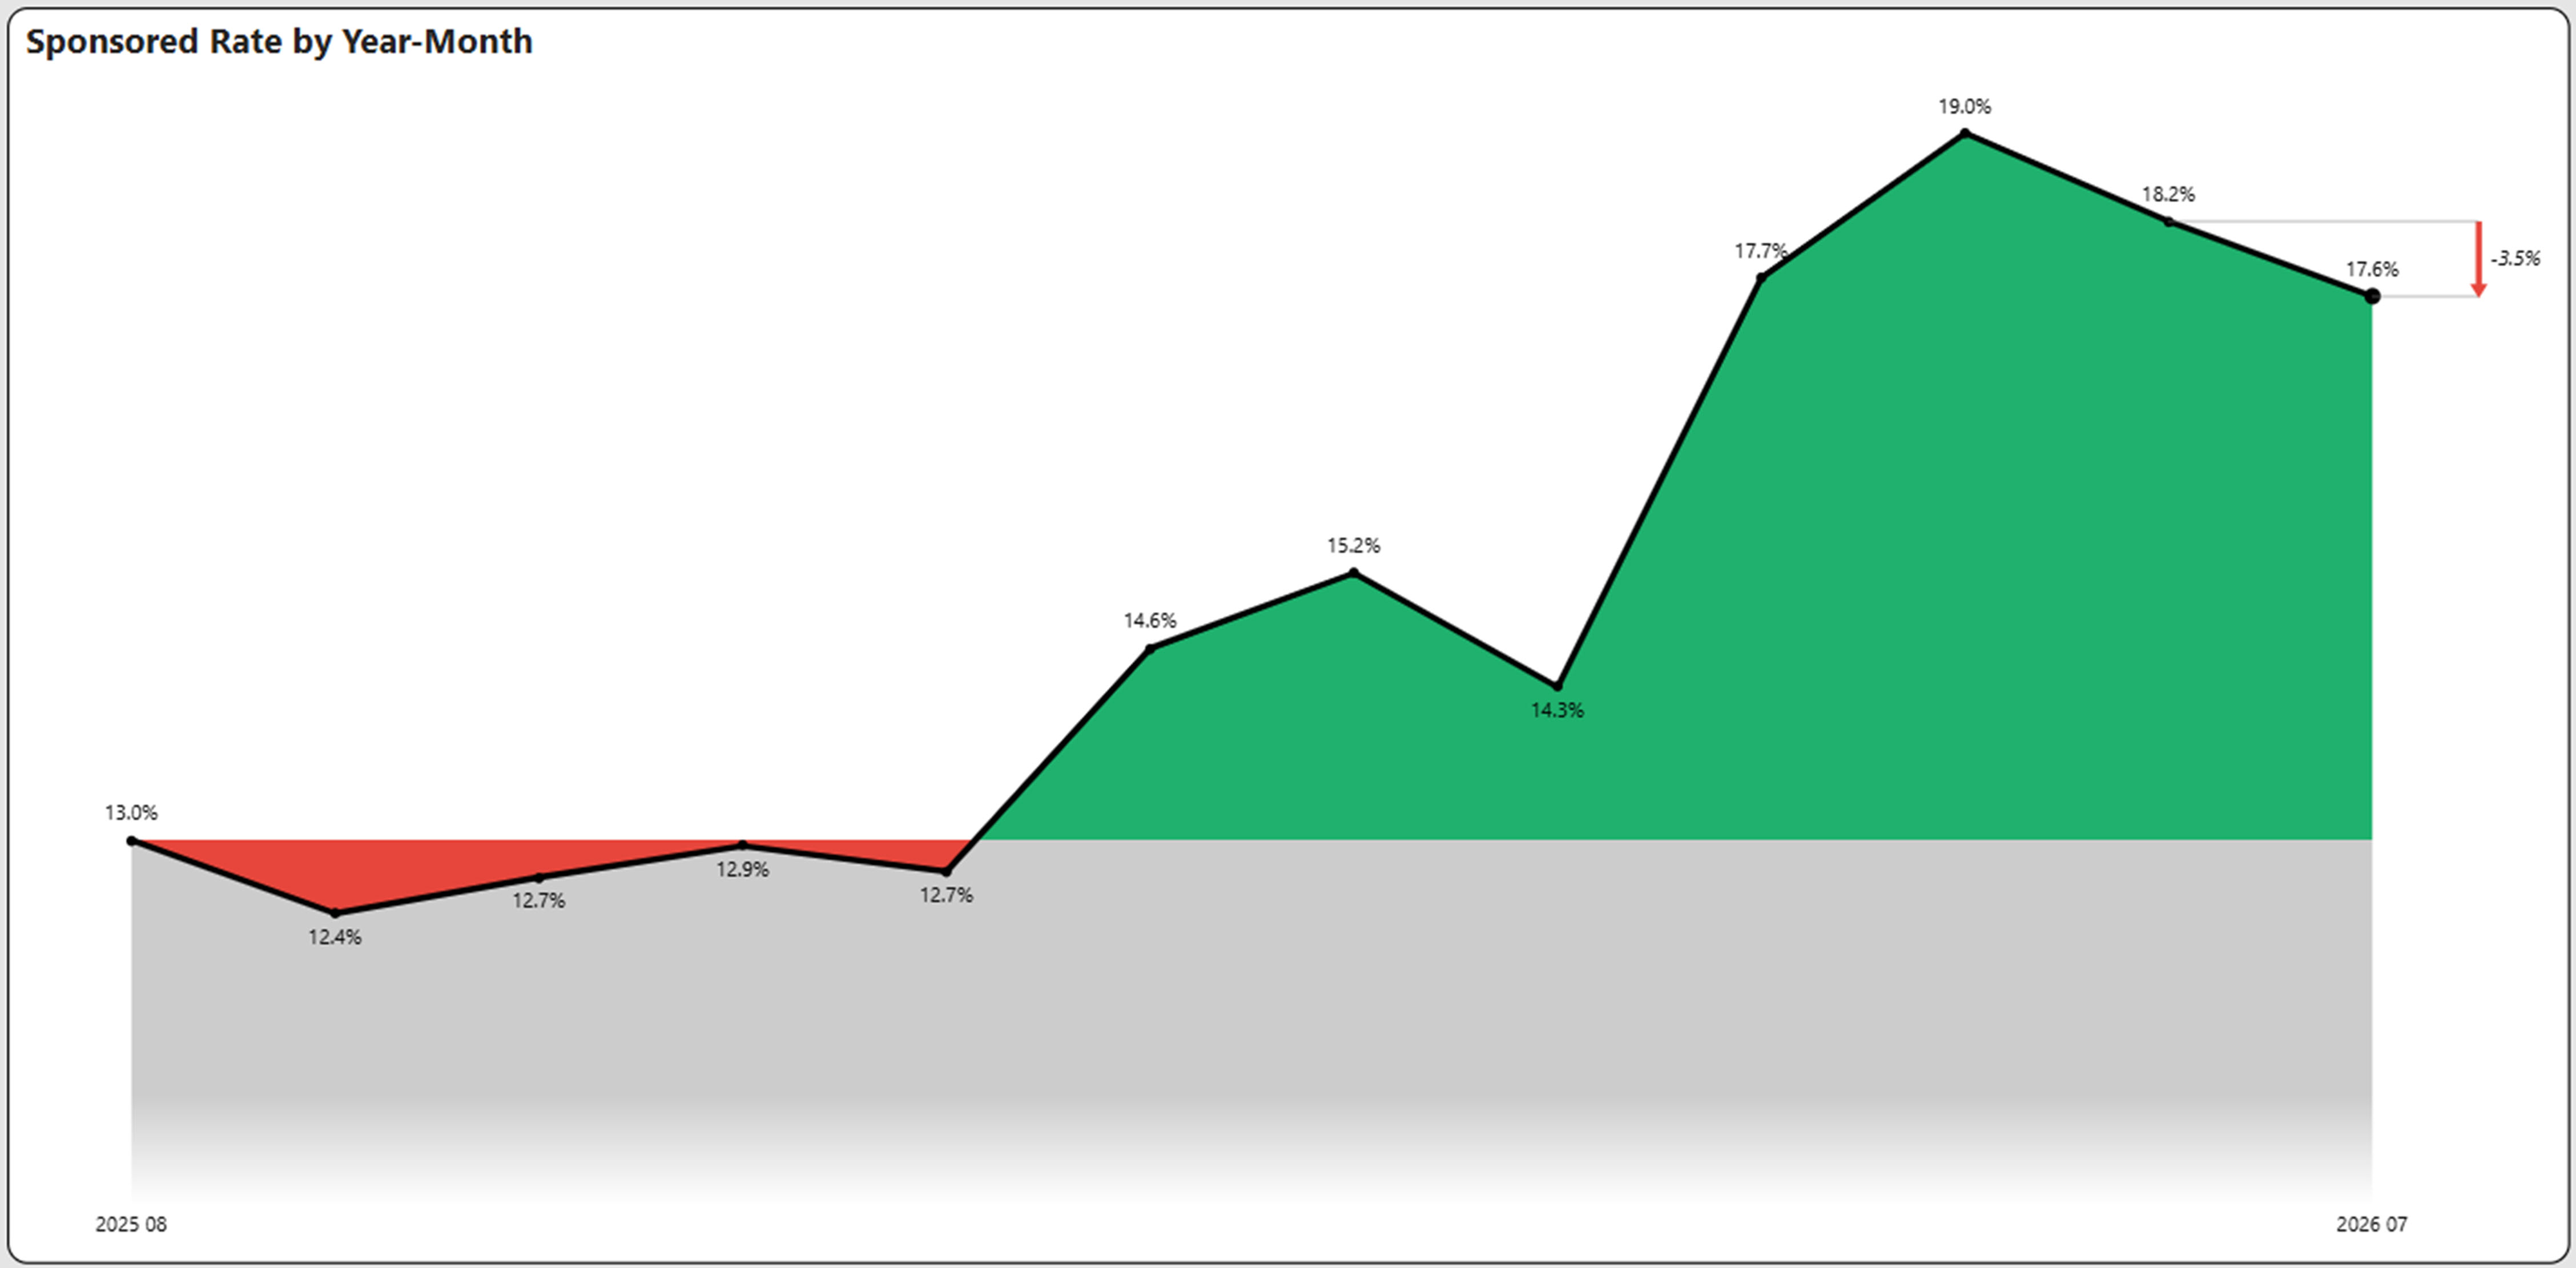
Sponsored rate is the percentage of job advertisements that have had a paid sponsorship at some point over the time period. This is a measure of job boards’ activity.
As expected with the change in Indeed policy as of April 1st, which was made to limit organic/free postings via single-source XML/API job feeds, sponsored rates increased from 14.3% in March to 17.7% in April. The sponsored rate has remained elevated since then with only a slight decrease from June to July.
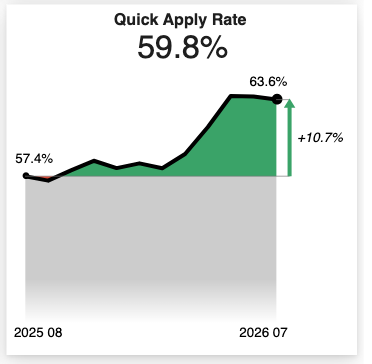
Additionally, the Indeed Quick Apply rate has maintained an increase over the last few months. These jobs (often labeled as “Easily Apply”) are job listings where you can apply directly on Indeed without being redirected to an external company website.
Average Fill Days are Flat at 48.8 Days
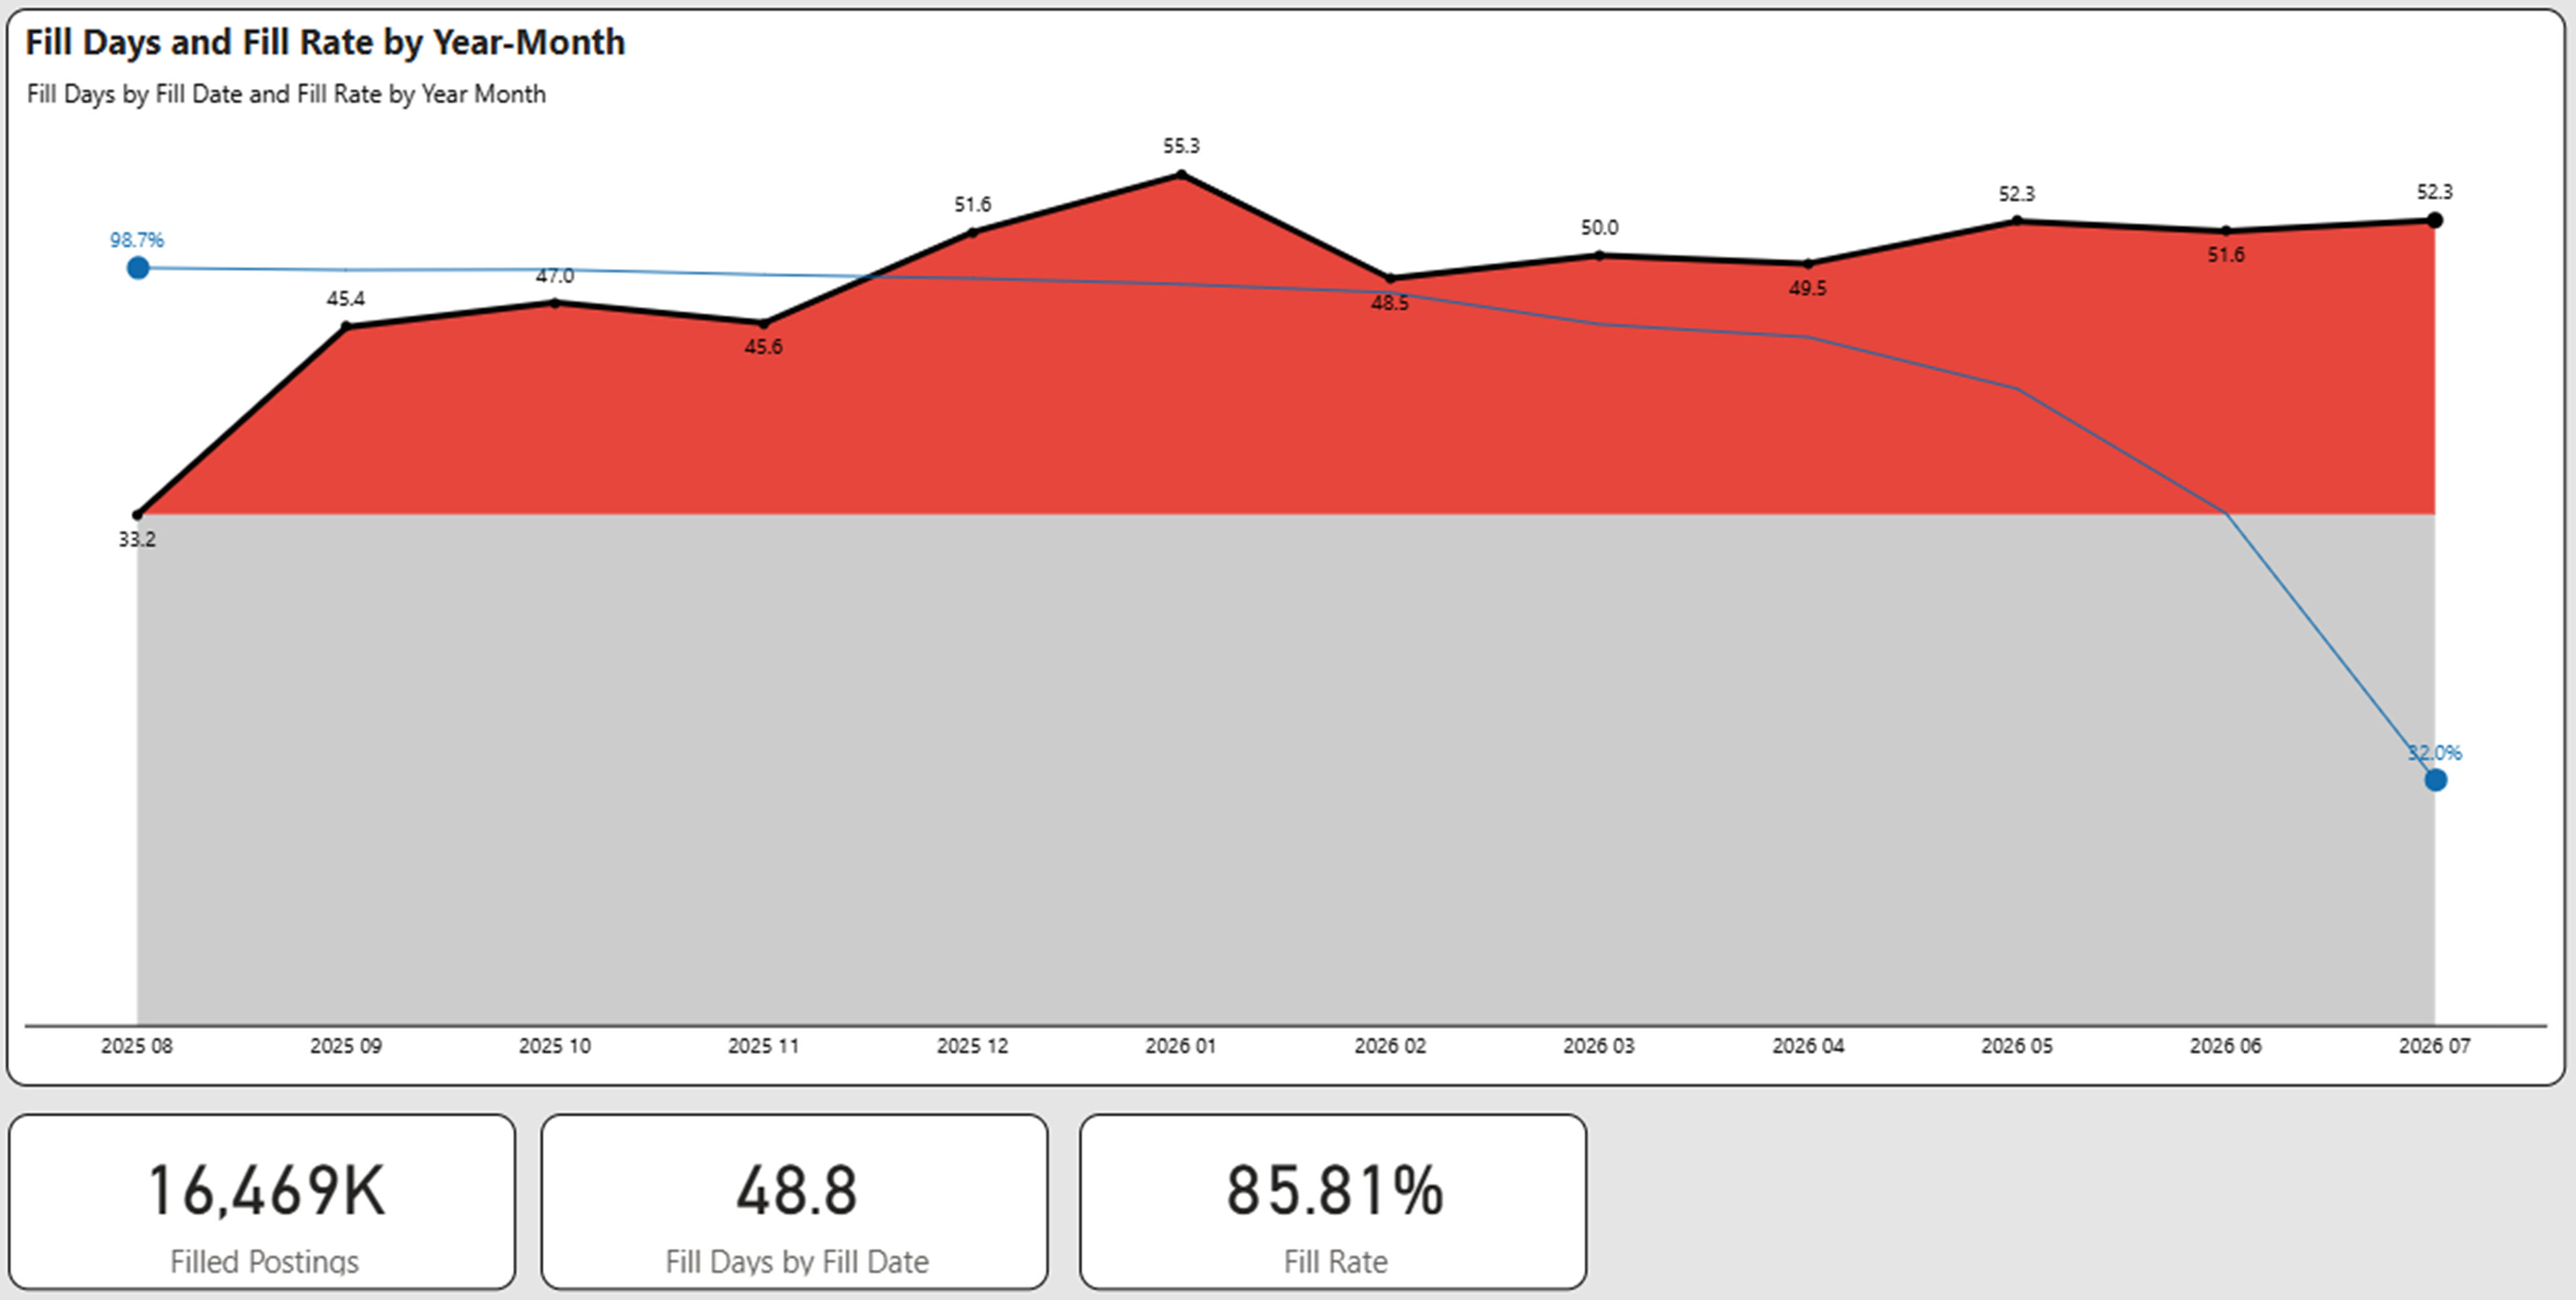
For fill days we use ad expiration and ad removal to determine a presumptive hire. When measured over a prolonged period of time and over millions of postings, this provides a strong view of the overall market. The trailing 12 months is used as a time period for our analysis.
In the graph below, we show the fill days by month along with the percentage of ads (blue line) that have been filled. Obviously, the newer ads have a lower fill rate.
Average fill days were essentially flat going from 47.8 in June to 48.8 days in July.
Fill rate was also flat at around 86%.
Average Open Postings is 57.3 Days
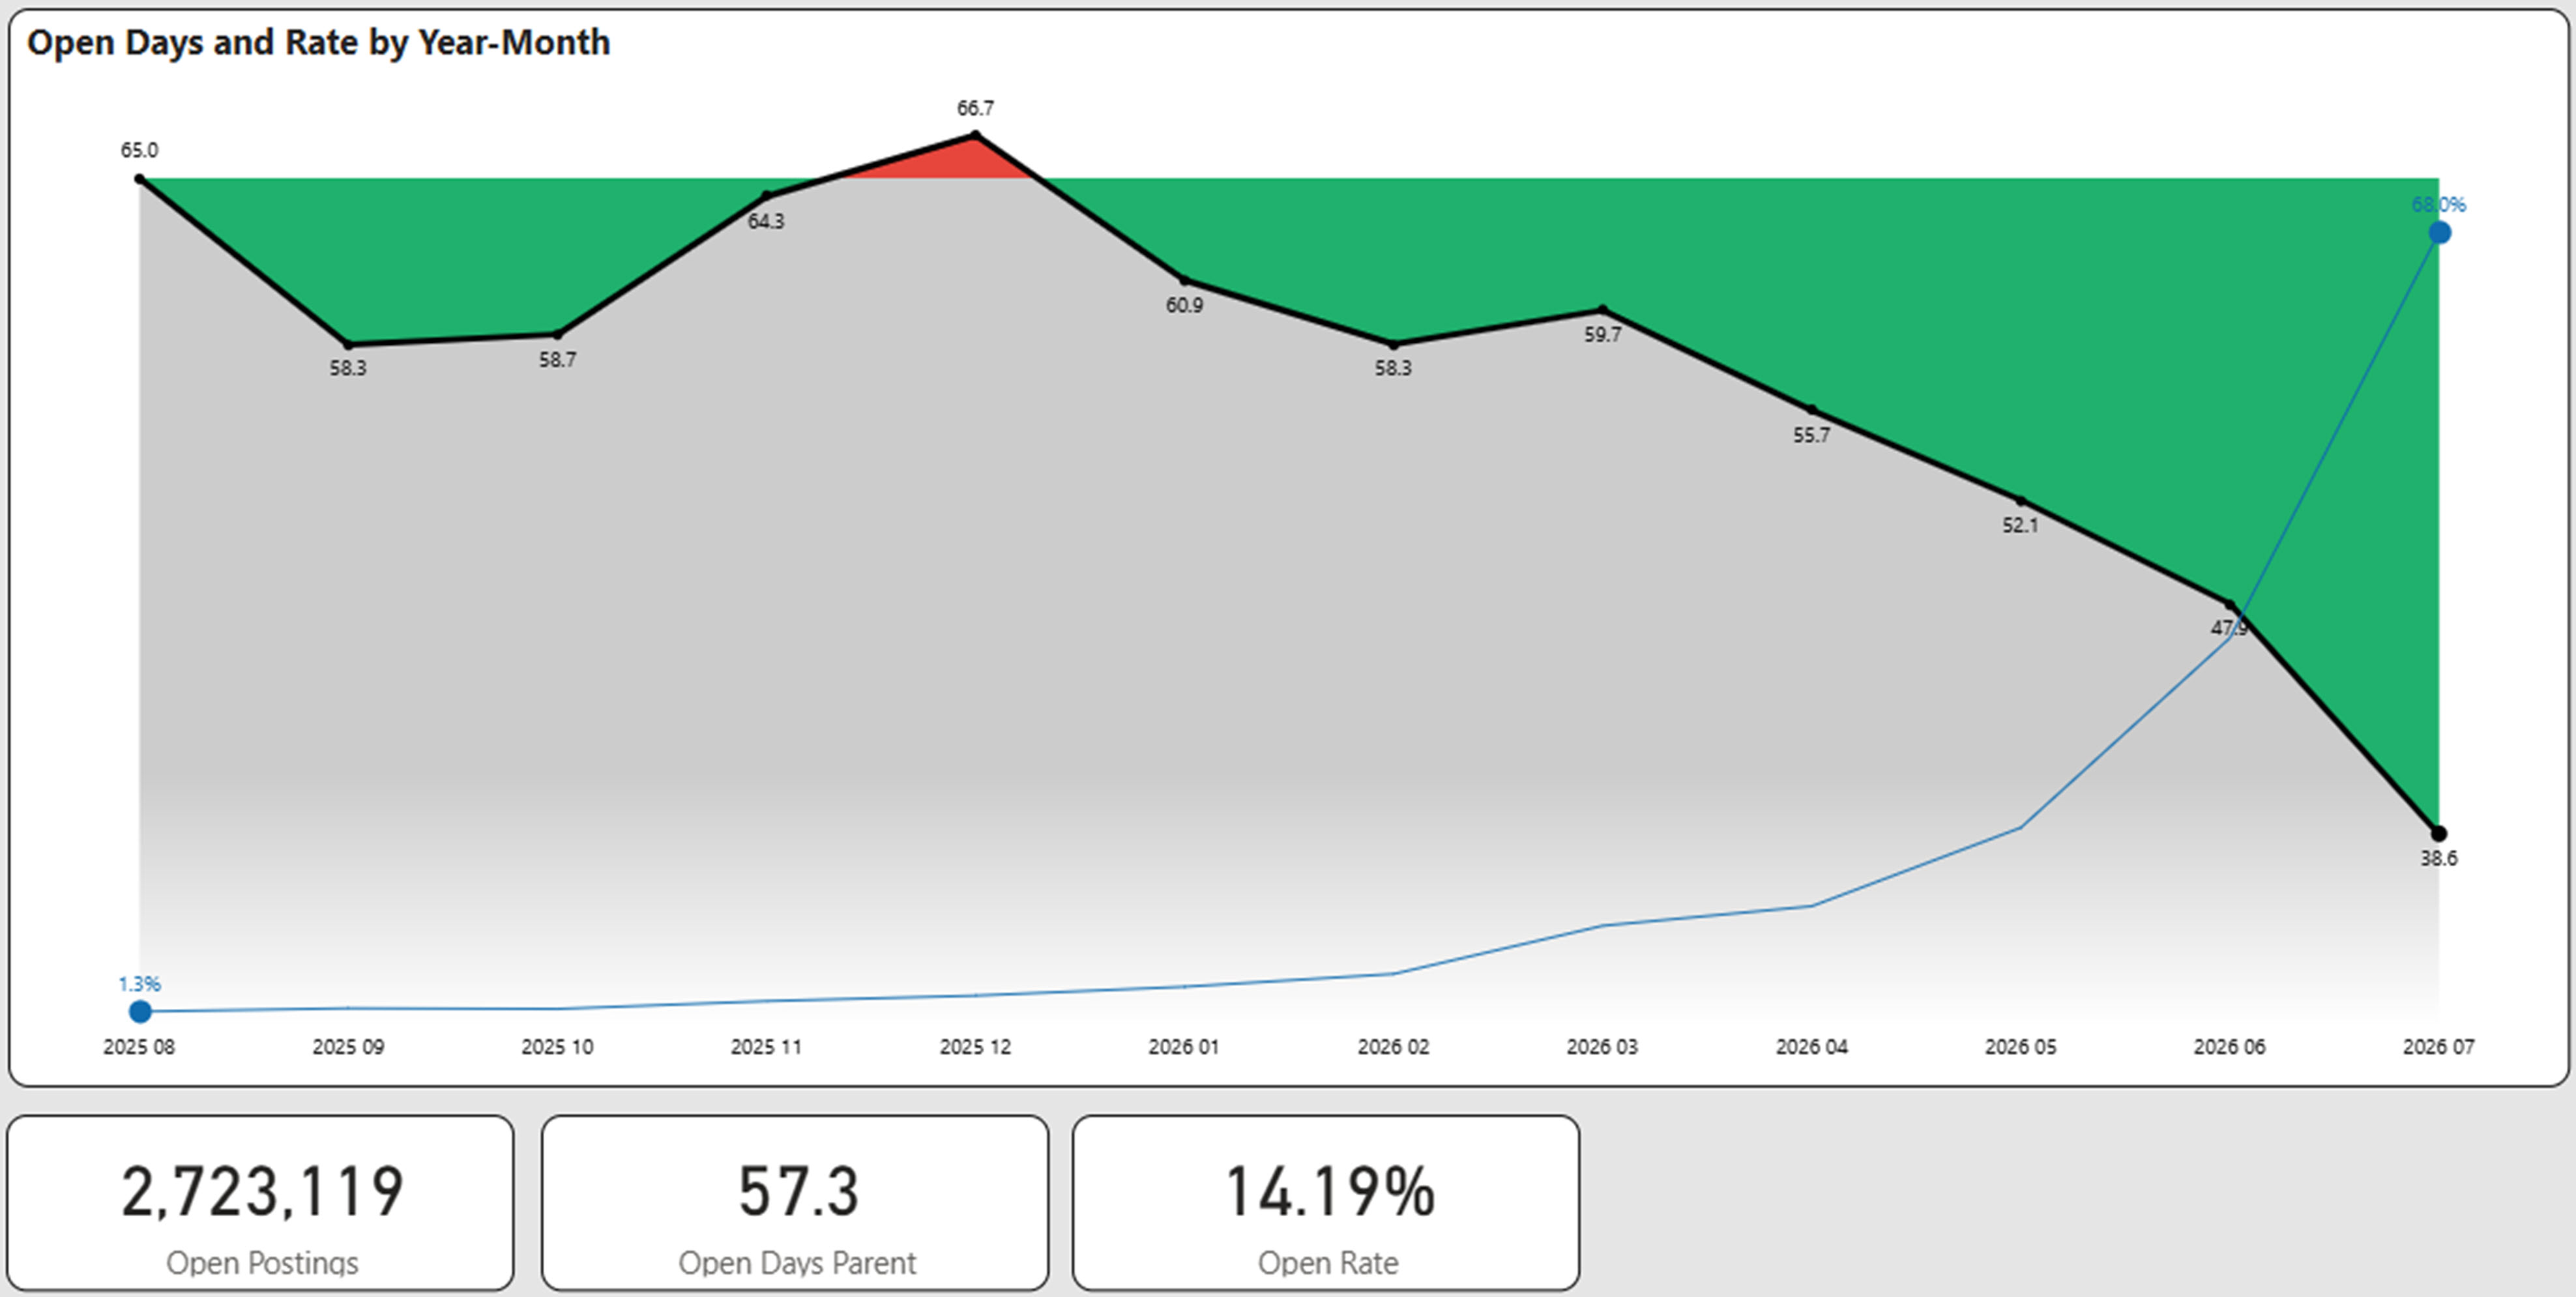
We track every job posting uniquely and ascertain its fill status on a weekly basis. Open days is the average age of postings that are still determined to be open. Generally, we have found that 12 months to be a suitable time period to evaluate the age of open days. Older postings may distort the open days as they may represent “evergreen” postings. For this reason we eliminate implied evergreen ads that are older than one year from our analysis.
The graph below shows the aging of open postings for the past 12 months. Open days stayed flat in July at 57.3 days compared to June while the percentage of open jobs also remained flat at 14%.
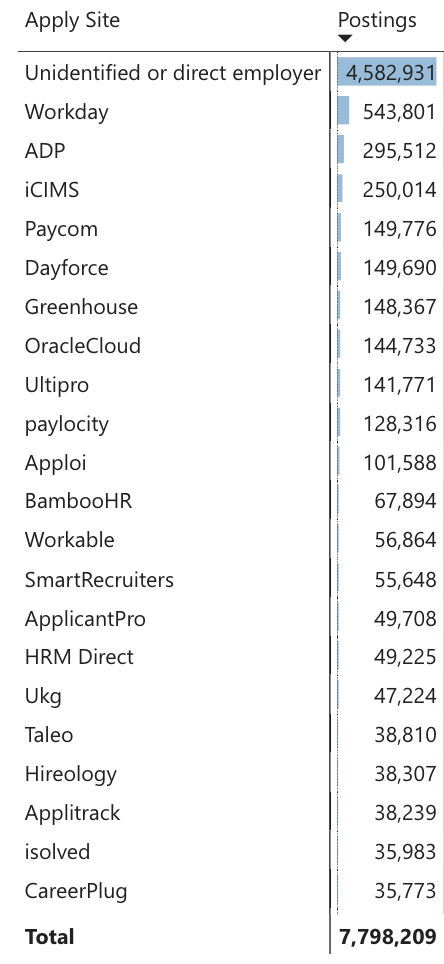
Job Application Sites – Top Sources for Where Candidates Apply for Jobs (Jan-July, 2026)
What is the Average Salary in the U.S.?
Average Salary in July is $70,200, which Decreased 1.3% from June, but Increased 5% from the Prior Year
- Pay ranges between max and min as a percentage of the midpoint remained steady at 25-27%.
- The percentage of jobs with ads has gradually increased over the past 12 months from 64% to 69%, but still well below 2025 highs at 75%.
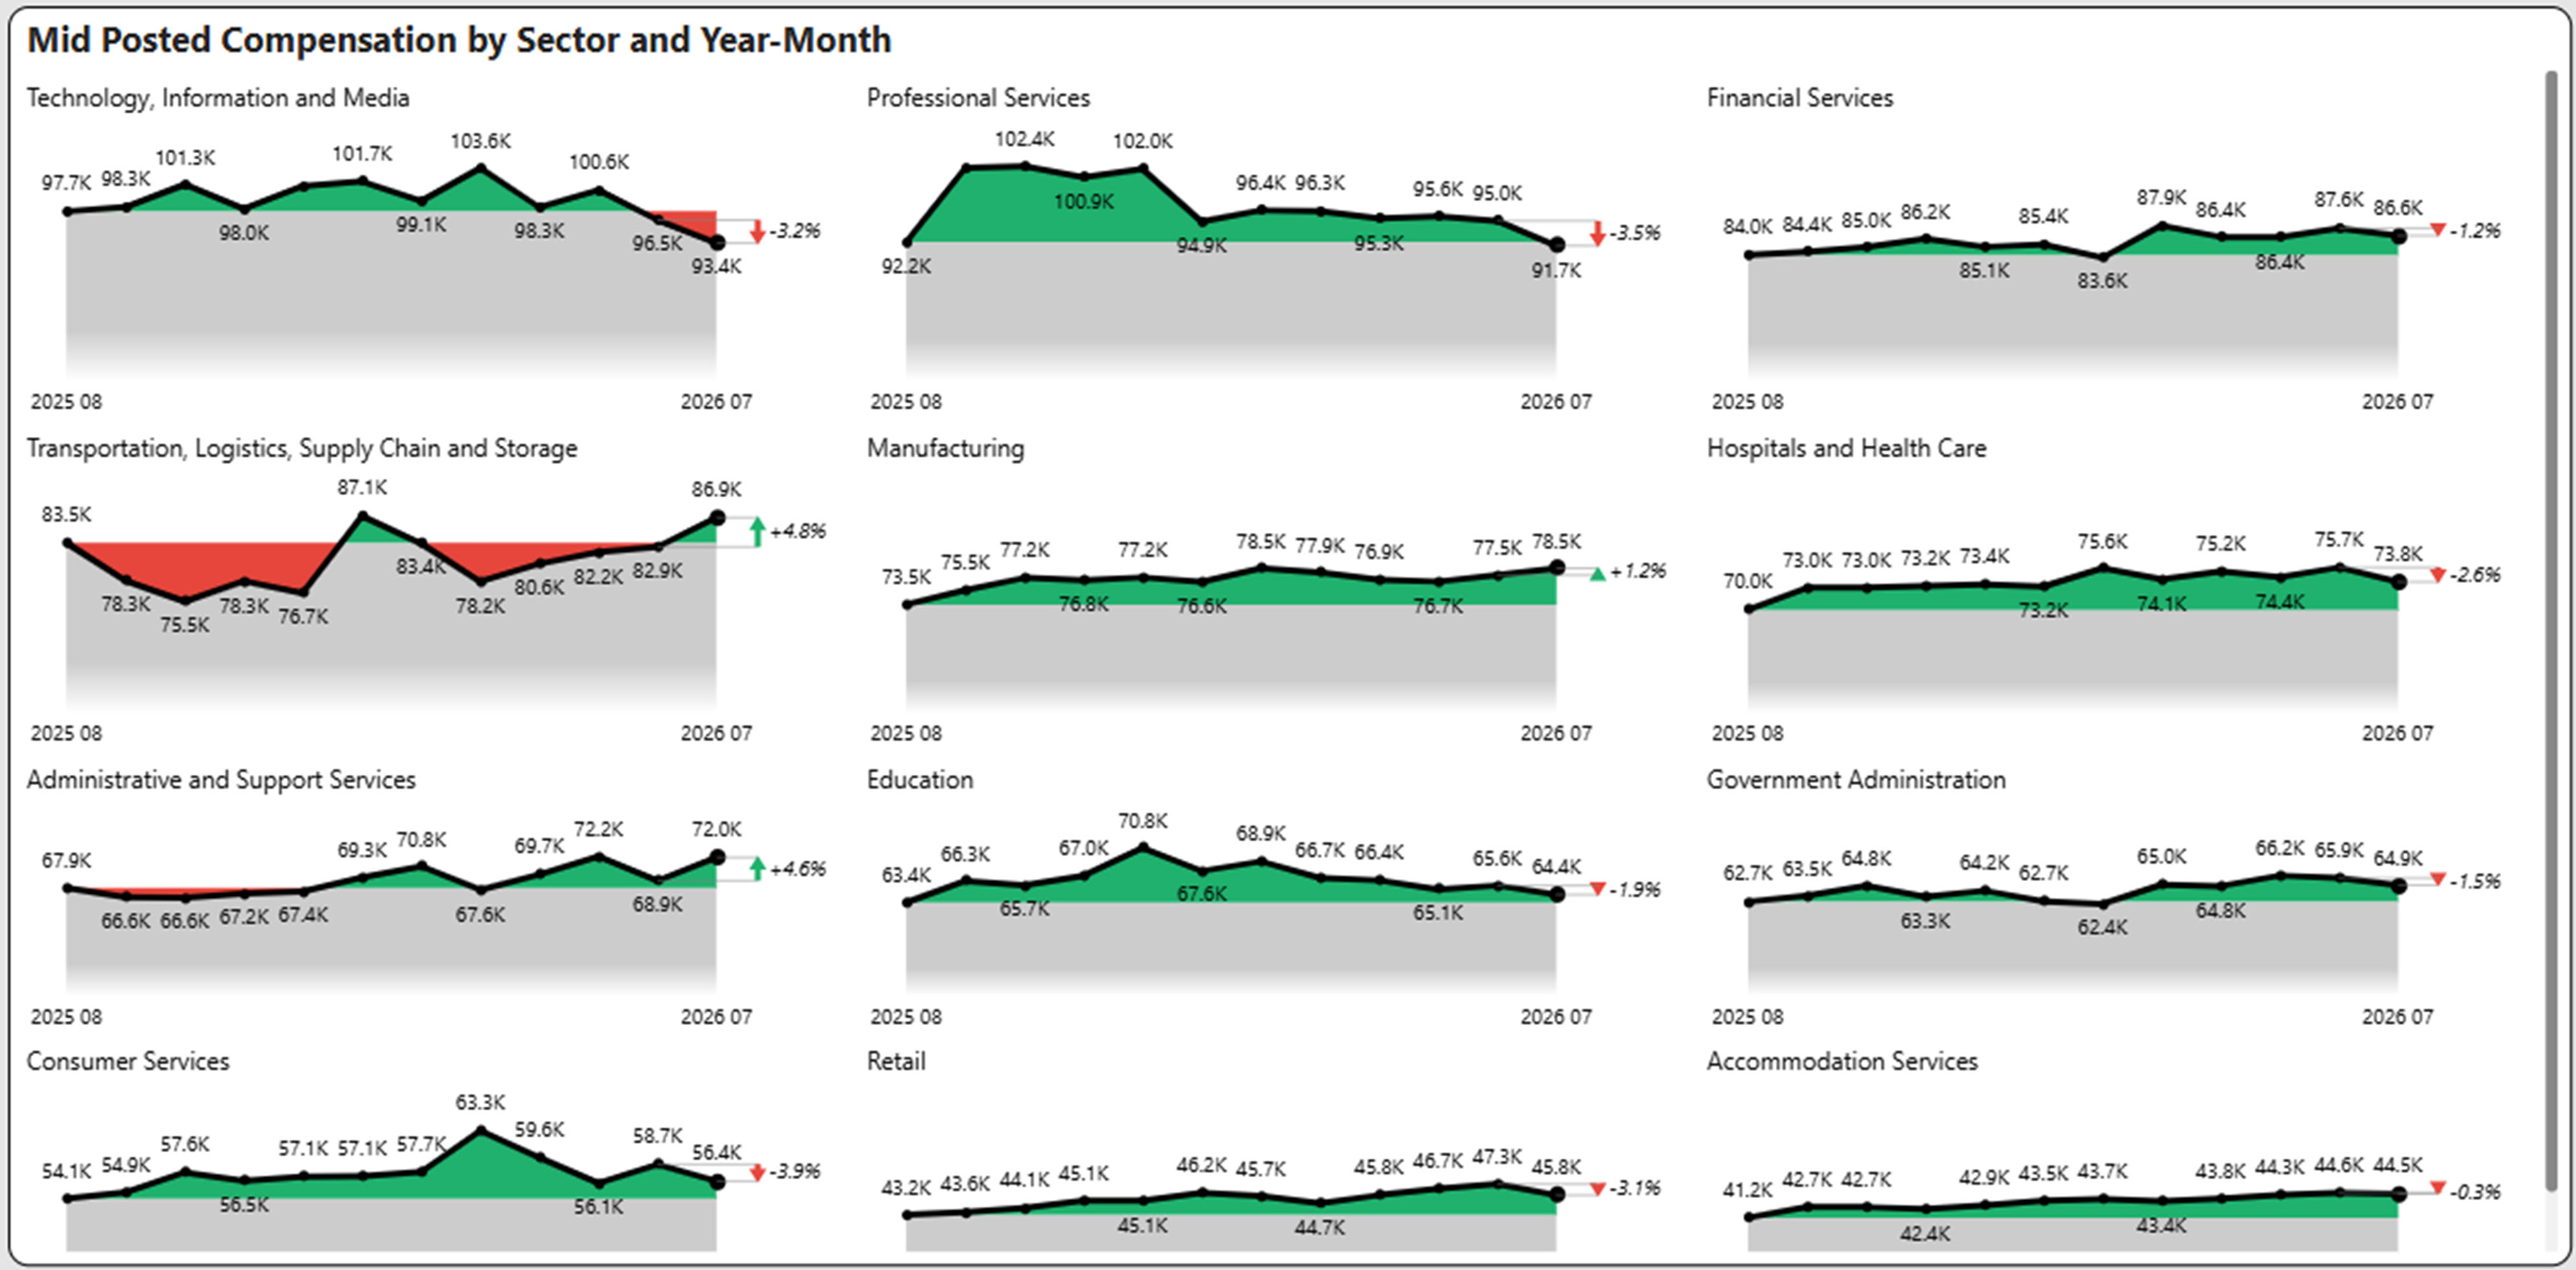
Average Compensation by Industry Shows Transportation Salaries are at 12-Month High at $86,900
The chart below shows the compensation by industry sector for the past 12 months, highlighting the winners and losers.
- Transportation compensation increased 4.8% from June to July.
- Administrative and Support Services increased 4.6% and is at a 12-month high at $72,000.
- Technology, Information, and Media declined to a 12-month low at $93,400.
What are Labor Supply and Demand Trends?
New Resumes Decreased in July by 35.1%
We looked at total resumes over the trailing 9 months as an indicator to measure overall job seeker interest.
Below, the graph shows total trailing resumes over 9 months now stand at 28.3 million compared to 27.3 million at the end of last year.
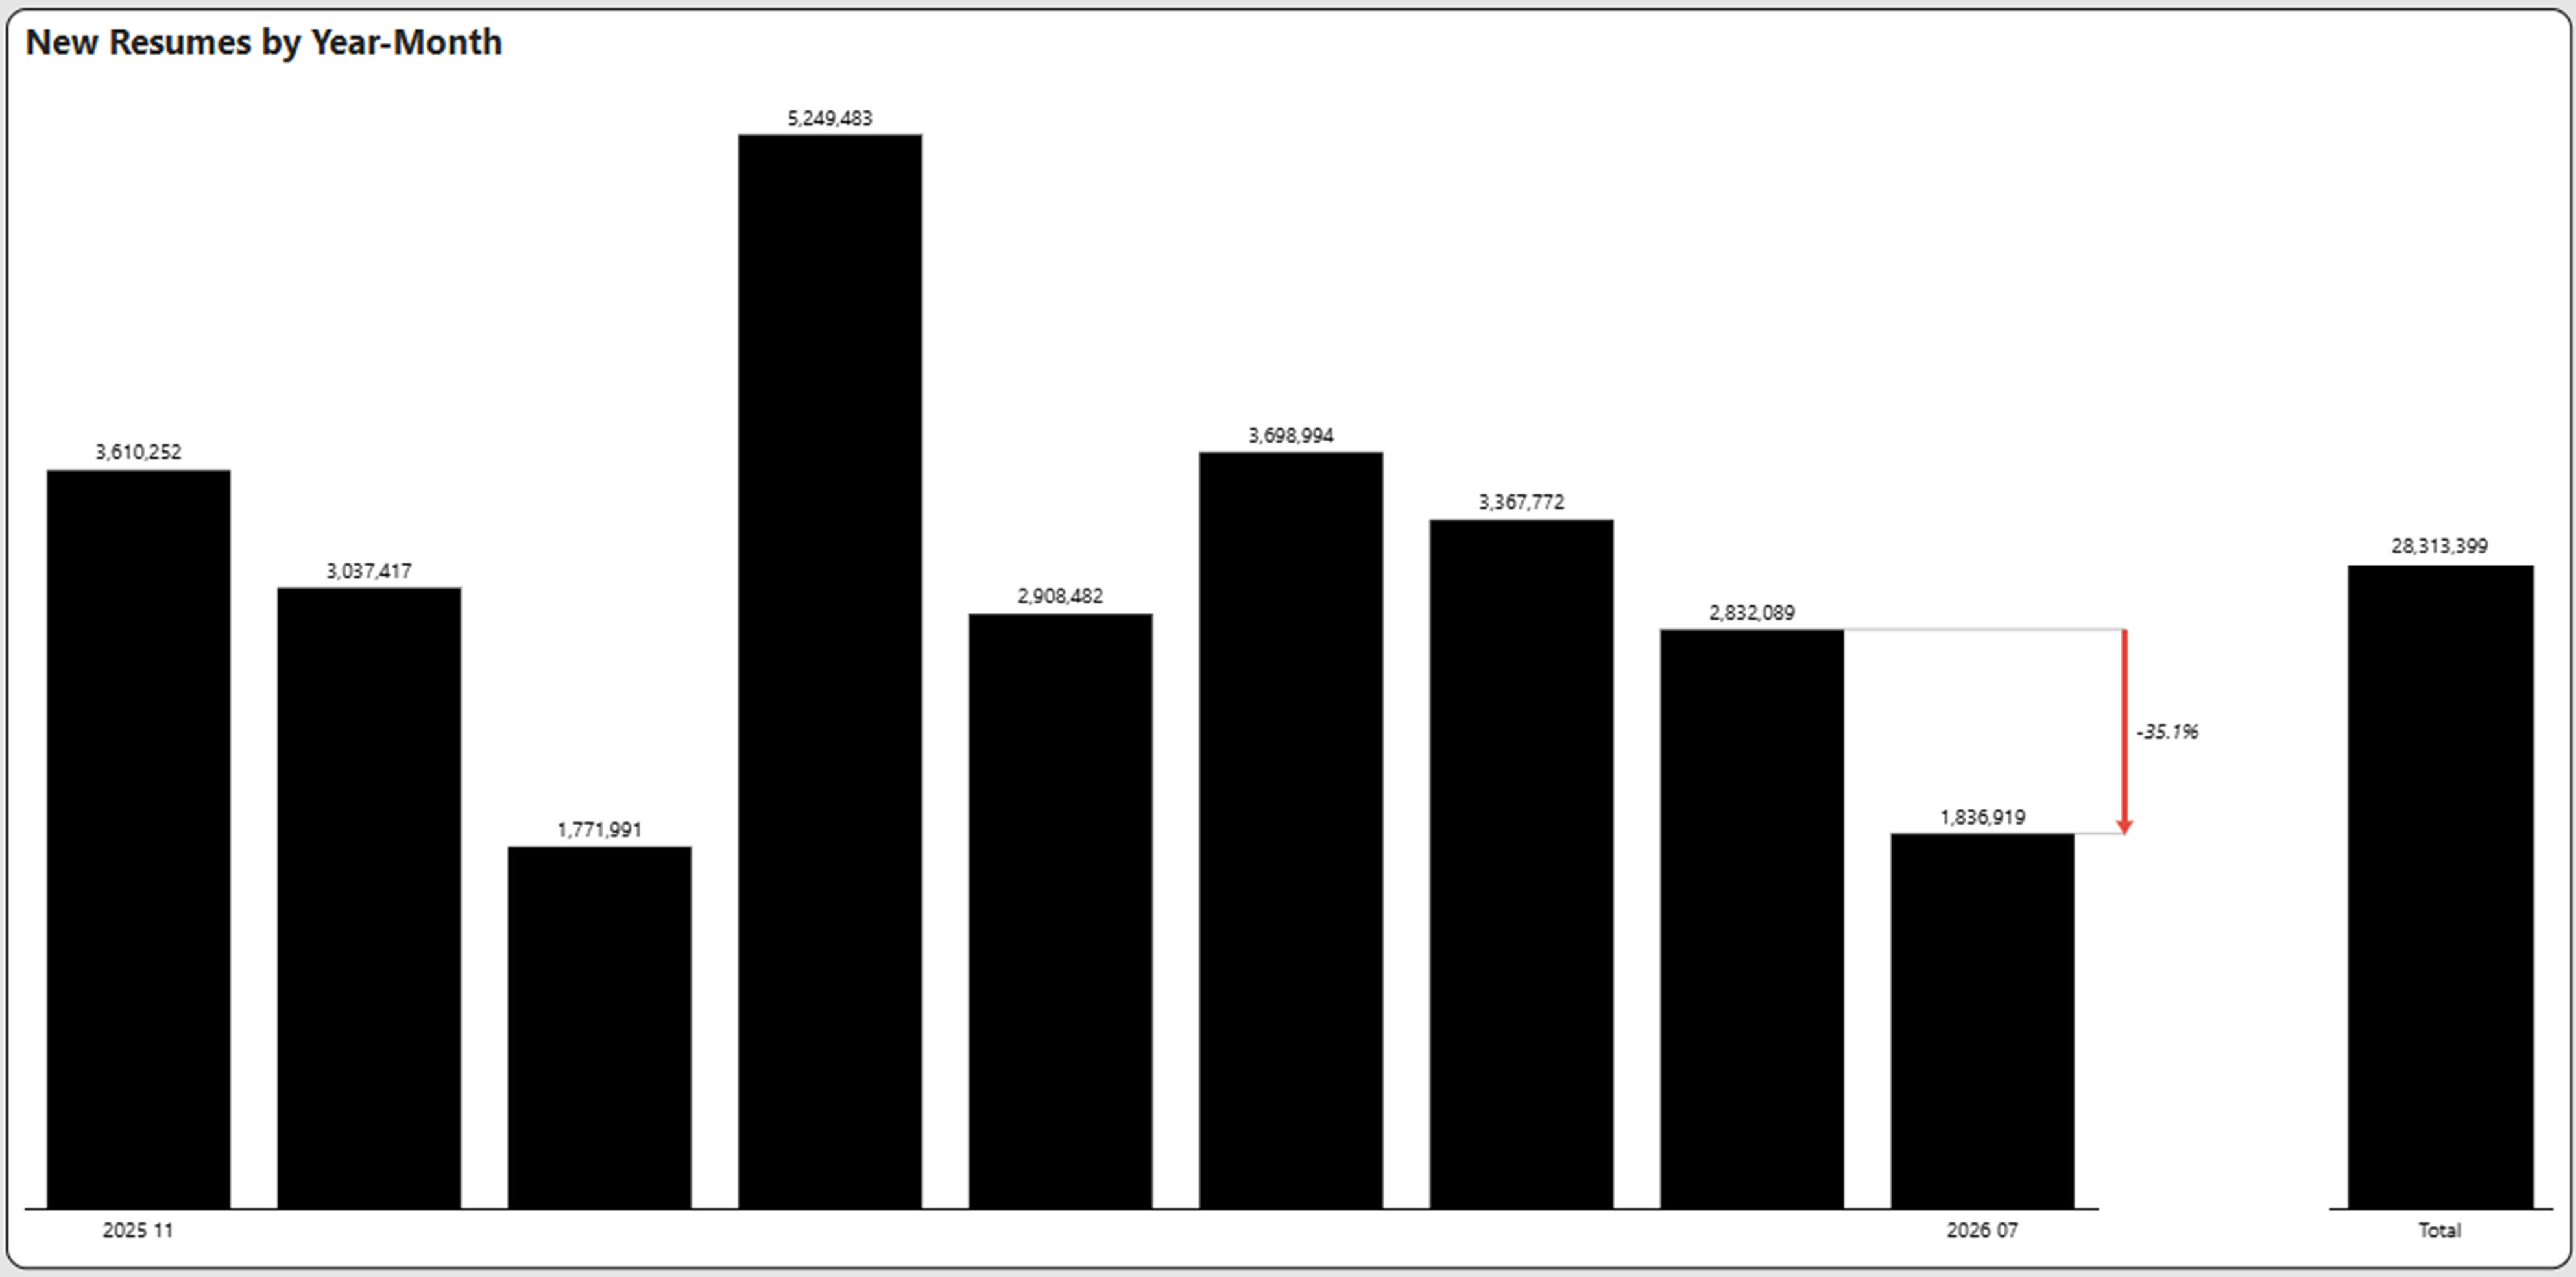
Additionally, total net positions had declined from 20.3 million to 18.4 million. This also reflects the advertised job positions change on Indeed. Also over the last 9 months, the Resumes to Net Positions ratio increased from 1.2 to a high point of 1.7, but has now retreated back to 1.53. We never quite reached twice as many job seekers as advertised job positions.
Which Industries Have Labor Supply or Demand Challenges?
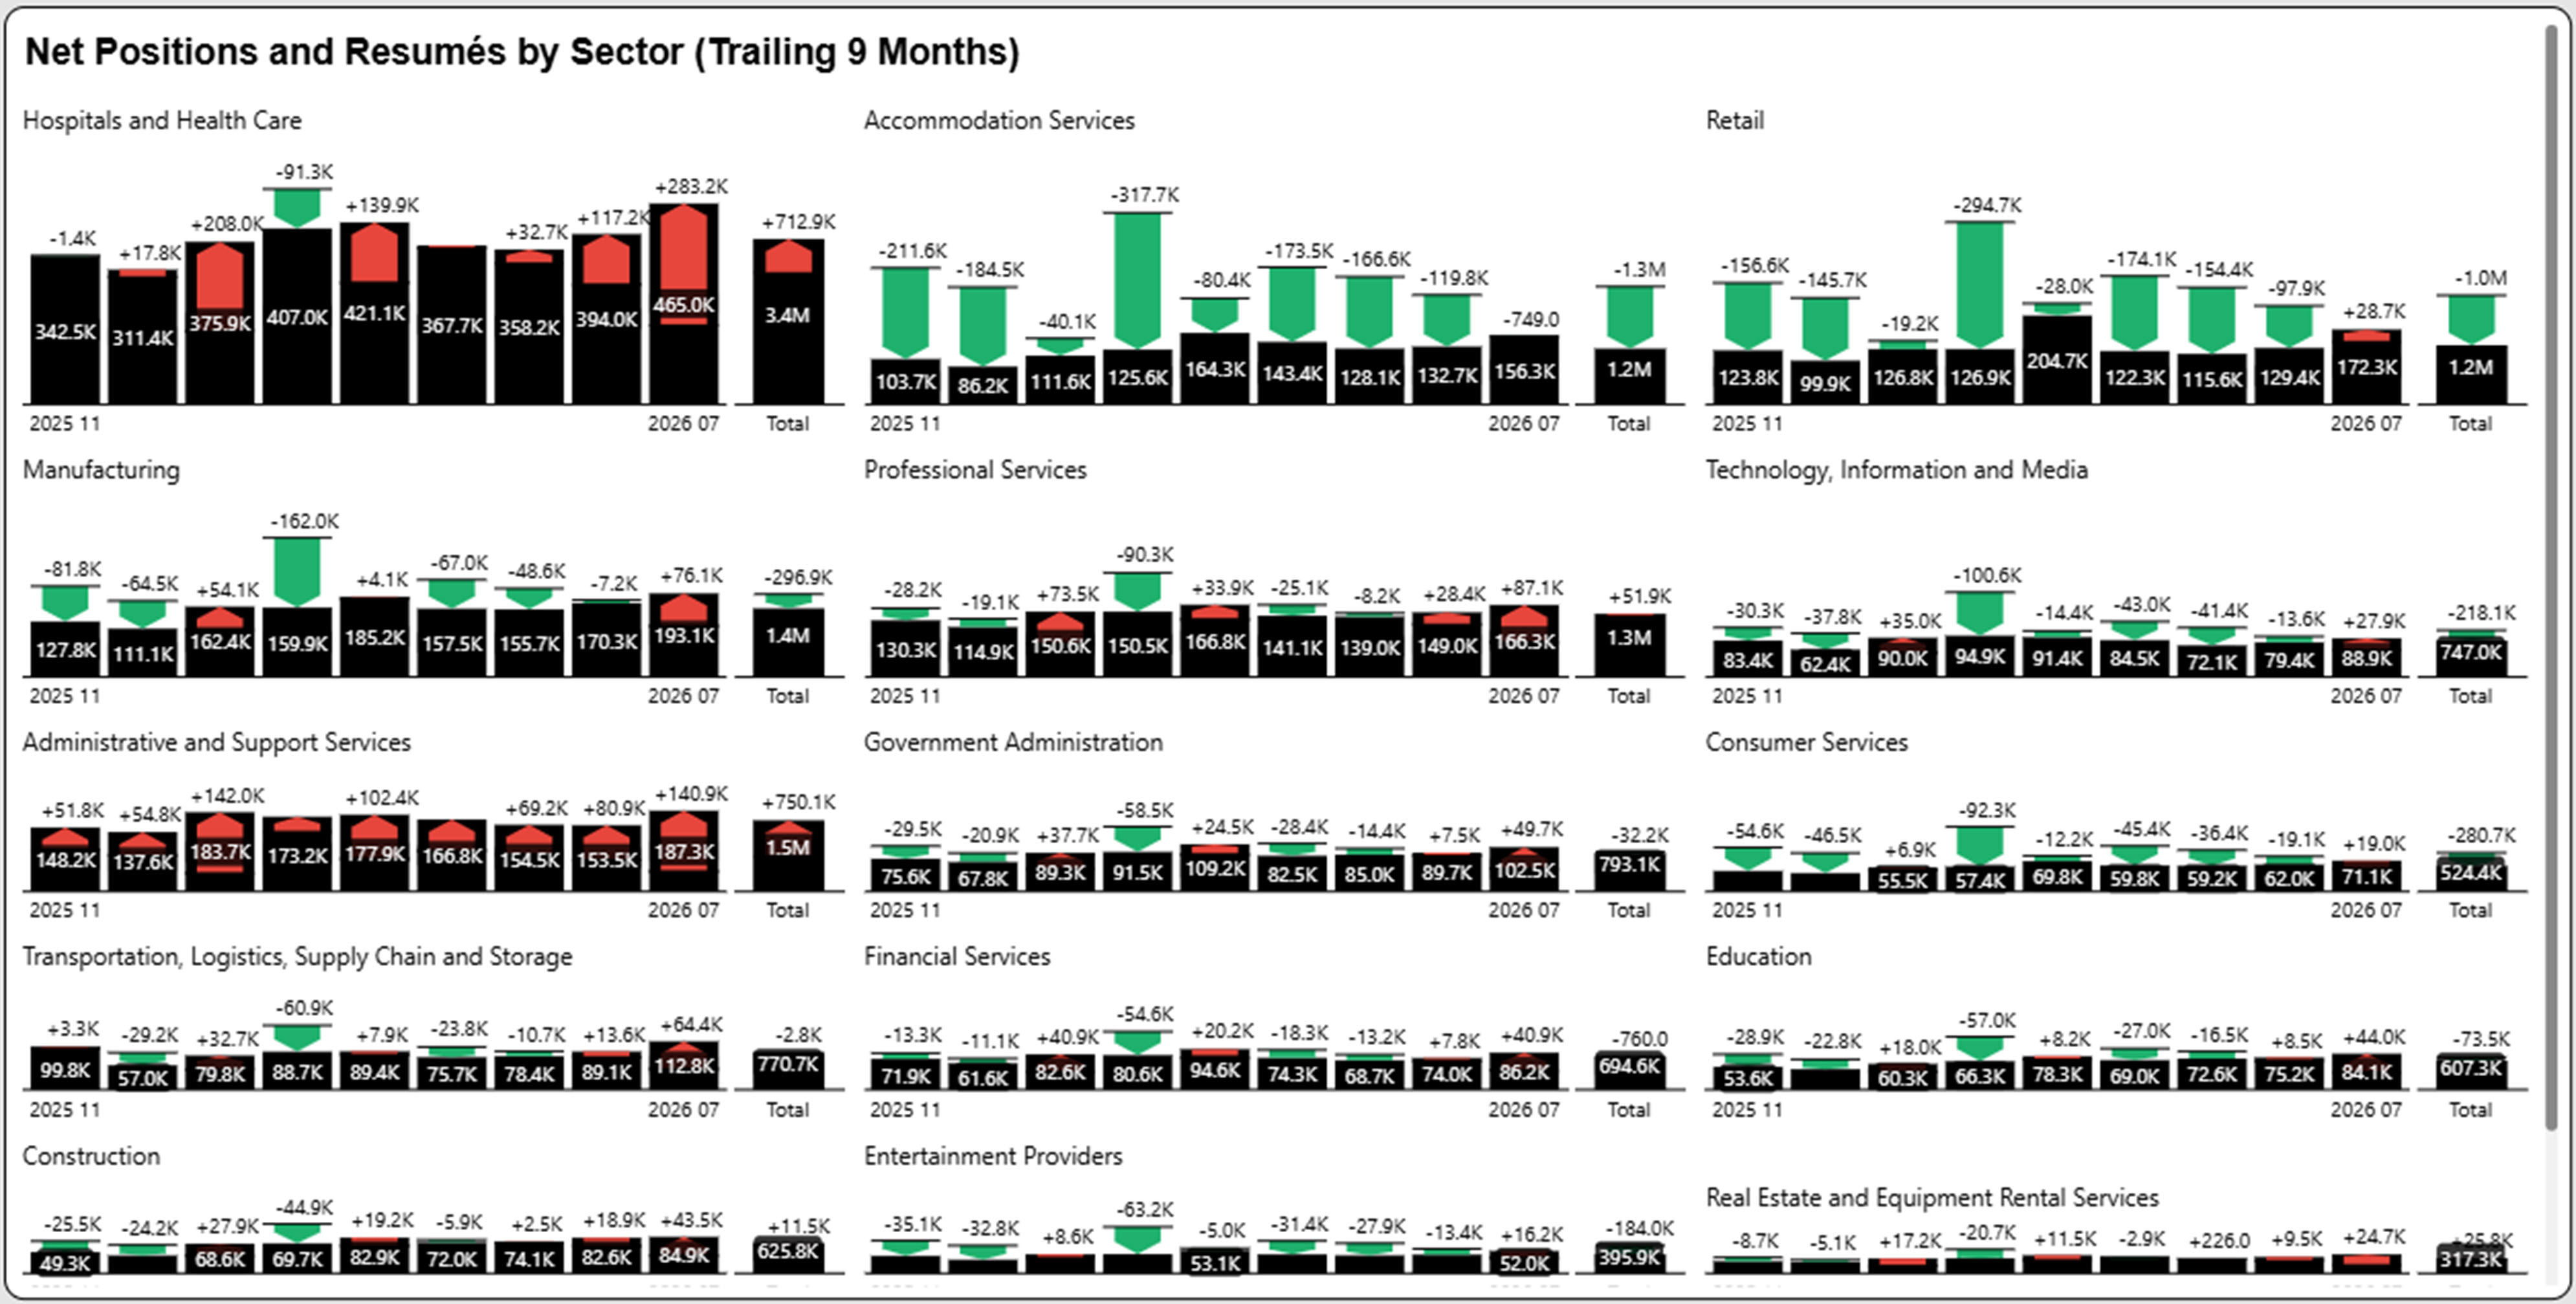
To highlight supply/demand imbalances, we superimpose job seekers based on resumés against net job positions (hires based on unique postings) in black bar. The graphs highlight supply surplus (more job seekers than net postings) shown in green or supply shortage (less job seekers than net postings) shown in red. We picked a time period of nine months, which highlights the current market surplus or shortage. The total bar reflects the summaries of openings and resumés for that time period.
- Hospitals and Health Care and Administrative and Support Services maintain their shortage of workers throughout the year.
- Accommodation Services and Retail maintain their over supply of workers across the last nine months, although Retail had demand increase in July.
- Transportation had demand increases in June and July.
- Several industries had slight upticks in demand in July.
Industry Supply/Demand Scorecard
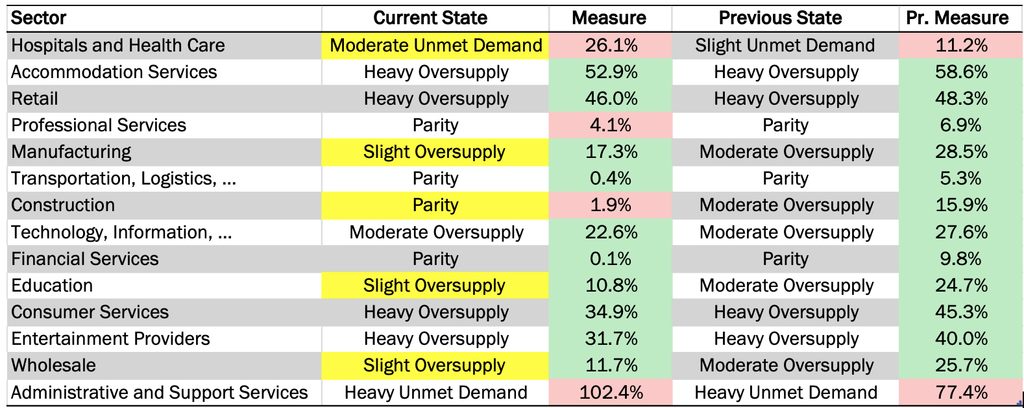
In the scorecard graph below, the Measure column shows the percentage of excess supply over demand (green) or demand over supply (red). The current monthly state is then compared to the previous monthly state with changes (if applicable) highlighted in yellow.
After multiple months of increasing supply over demand, the pendulum is swinging back the other way with the metrics reflecting increasing demand over supply or at least parity. The state of supply over demand is still supply centric with 1.53 resumes to net positions.
What is the Latest Worker Sentiment in the Market?
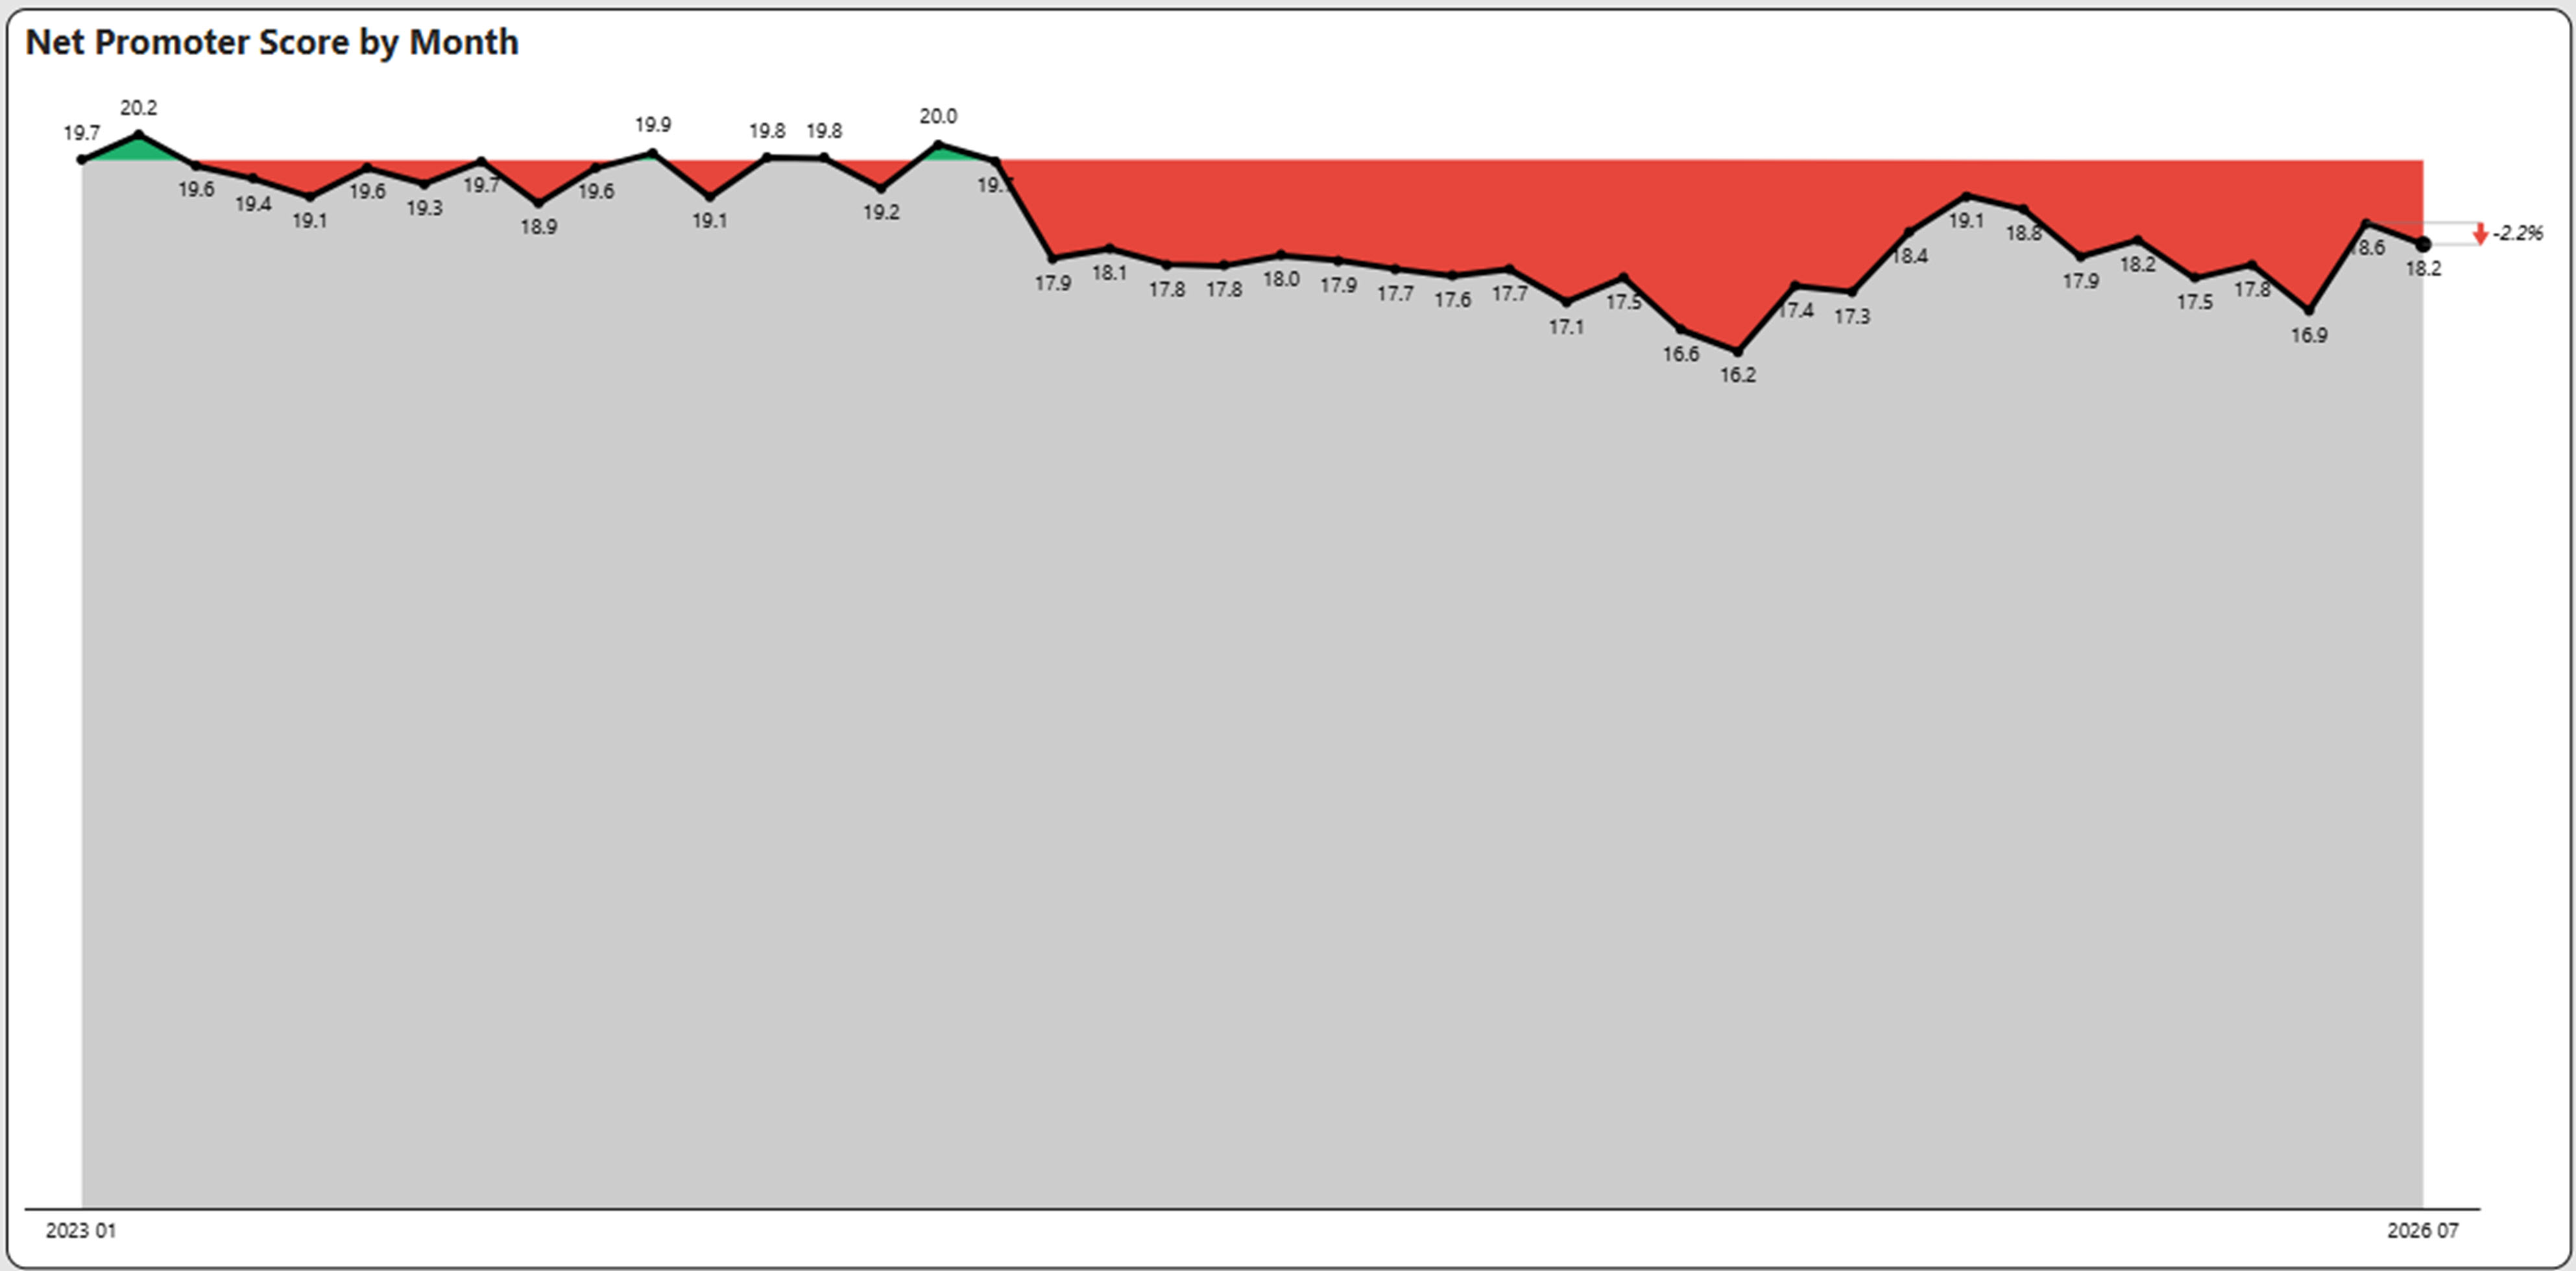
Net Promoter Score (NPS) is Flat in July at 18.2%
In July, Net Promoter Score (NPS) is holding steady at 18.2% with a slight decrease from June. This is still above the multi-year low of 16.2%. Net Promoter Score is defined as the percentage of positive reviews over negative reviews.
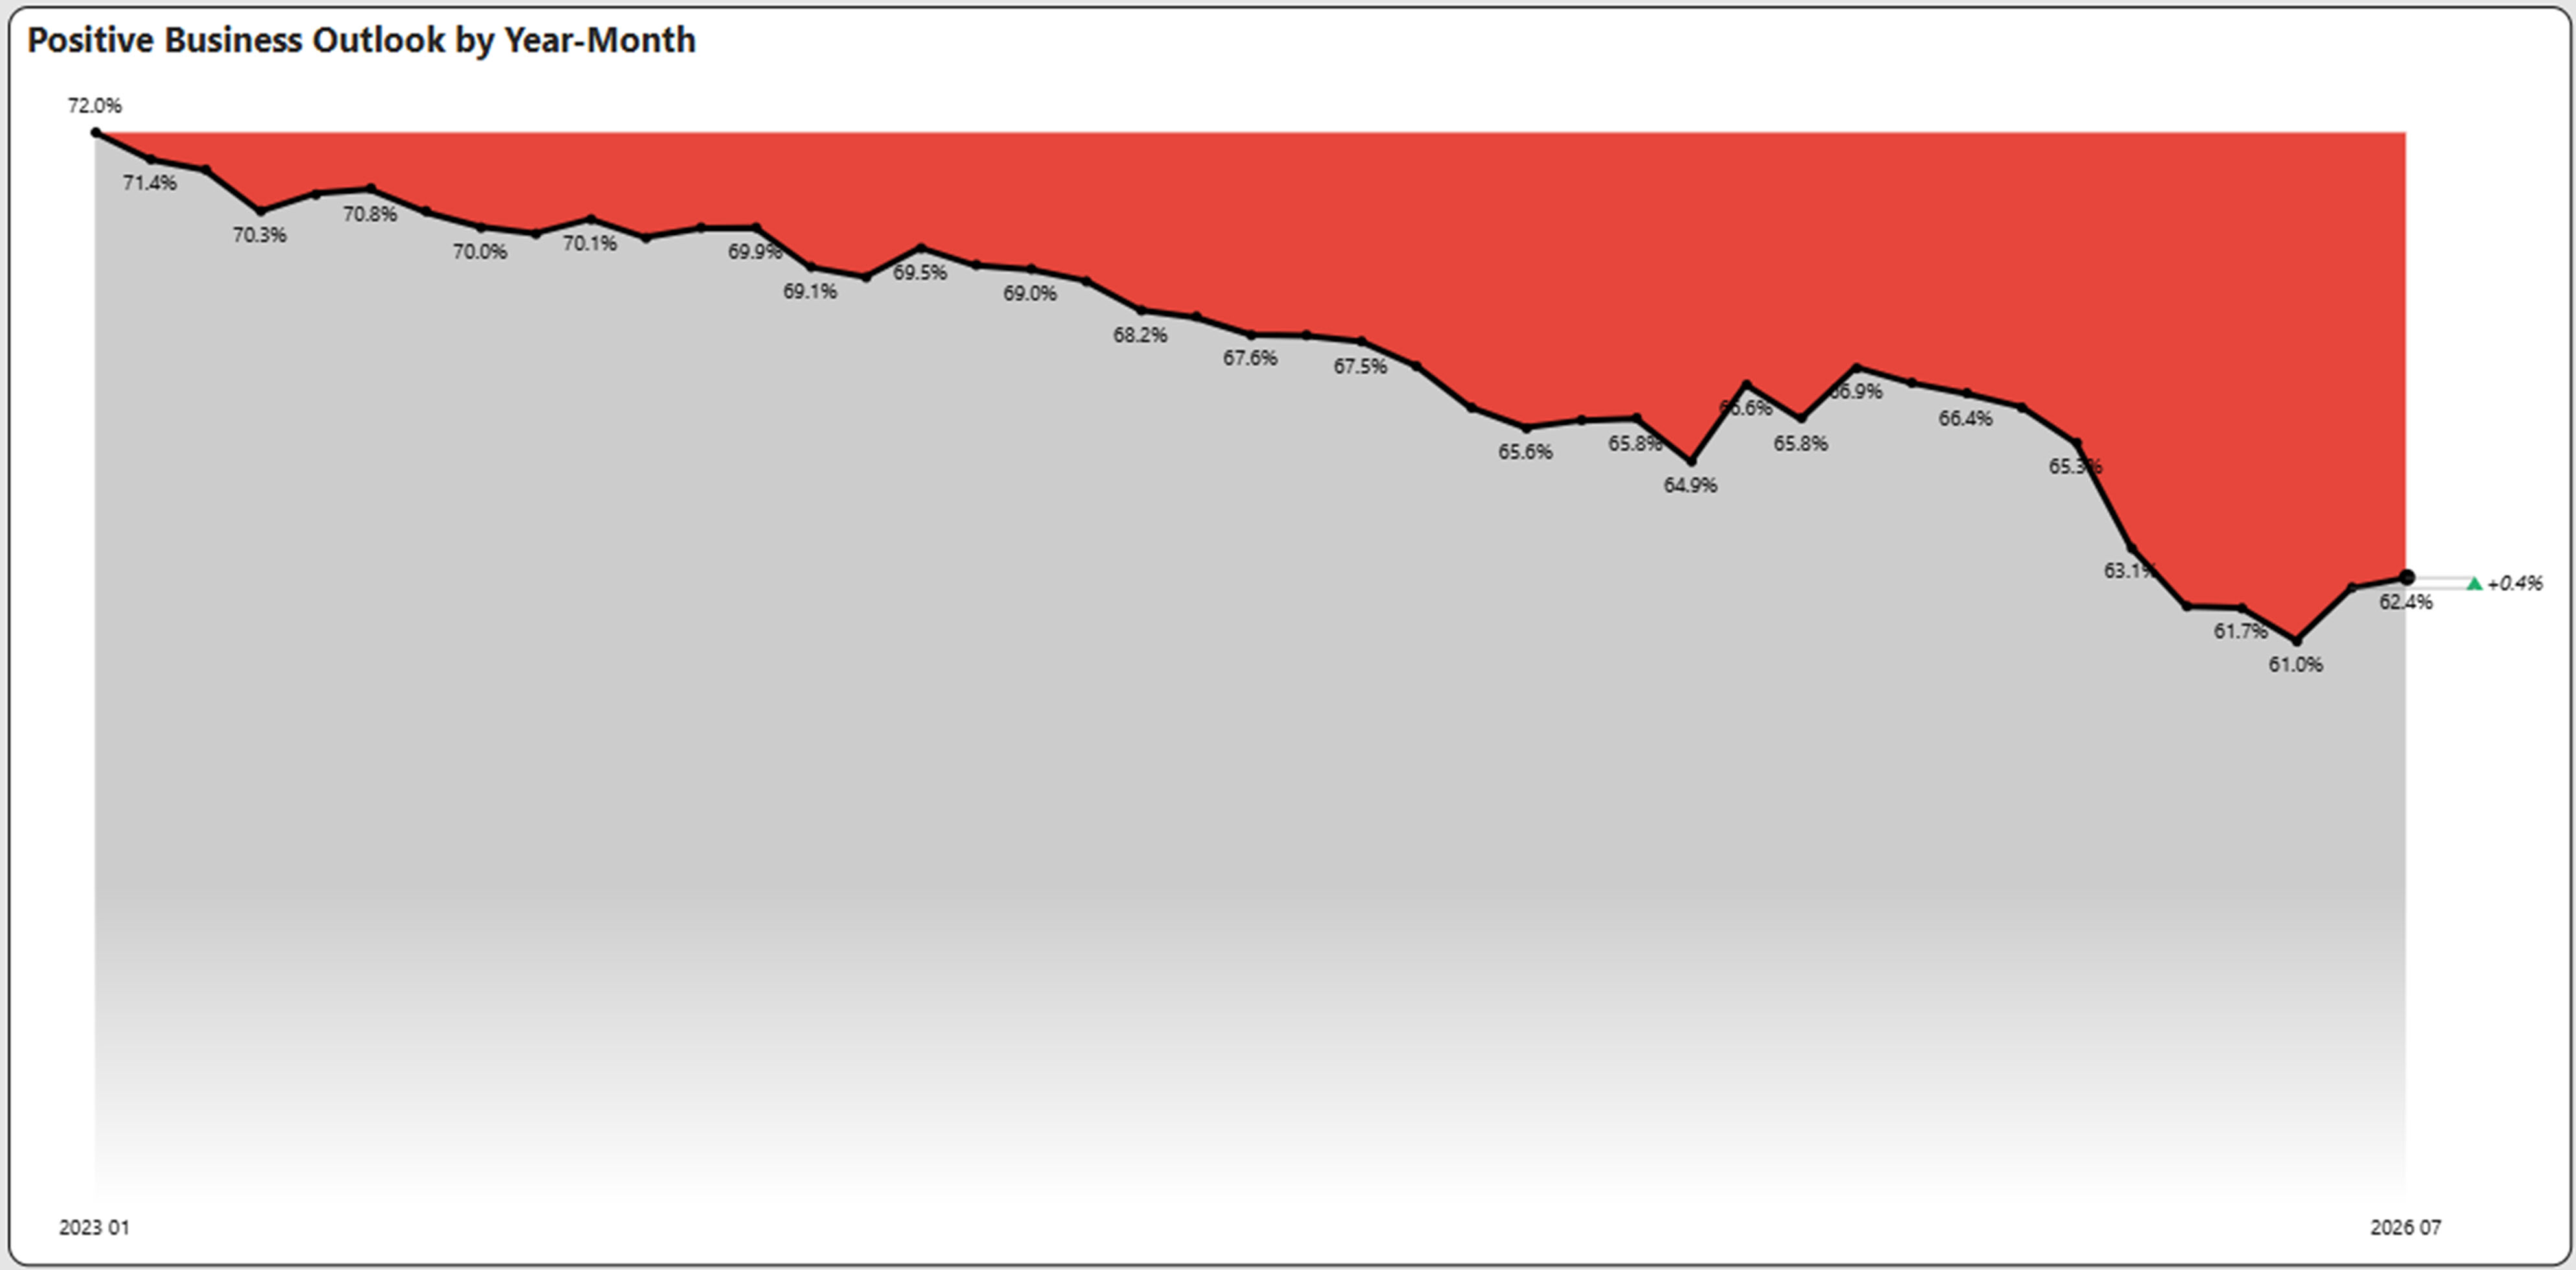
Business Outlook From Employee Reviews Data Increased Slightly to 62.4%
Positive Business Outlook as noted on reviews data has slightly increased from 61% to 62.4%. By comparison the “good old days” of early 2023 stood at over 70%.
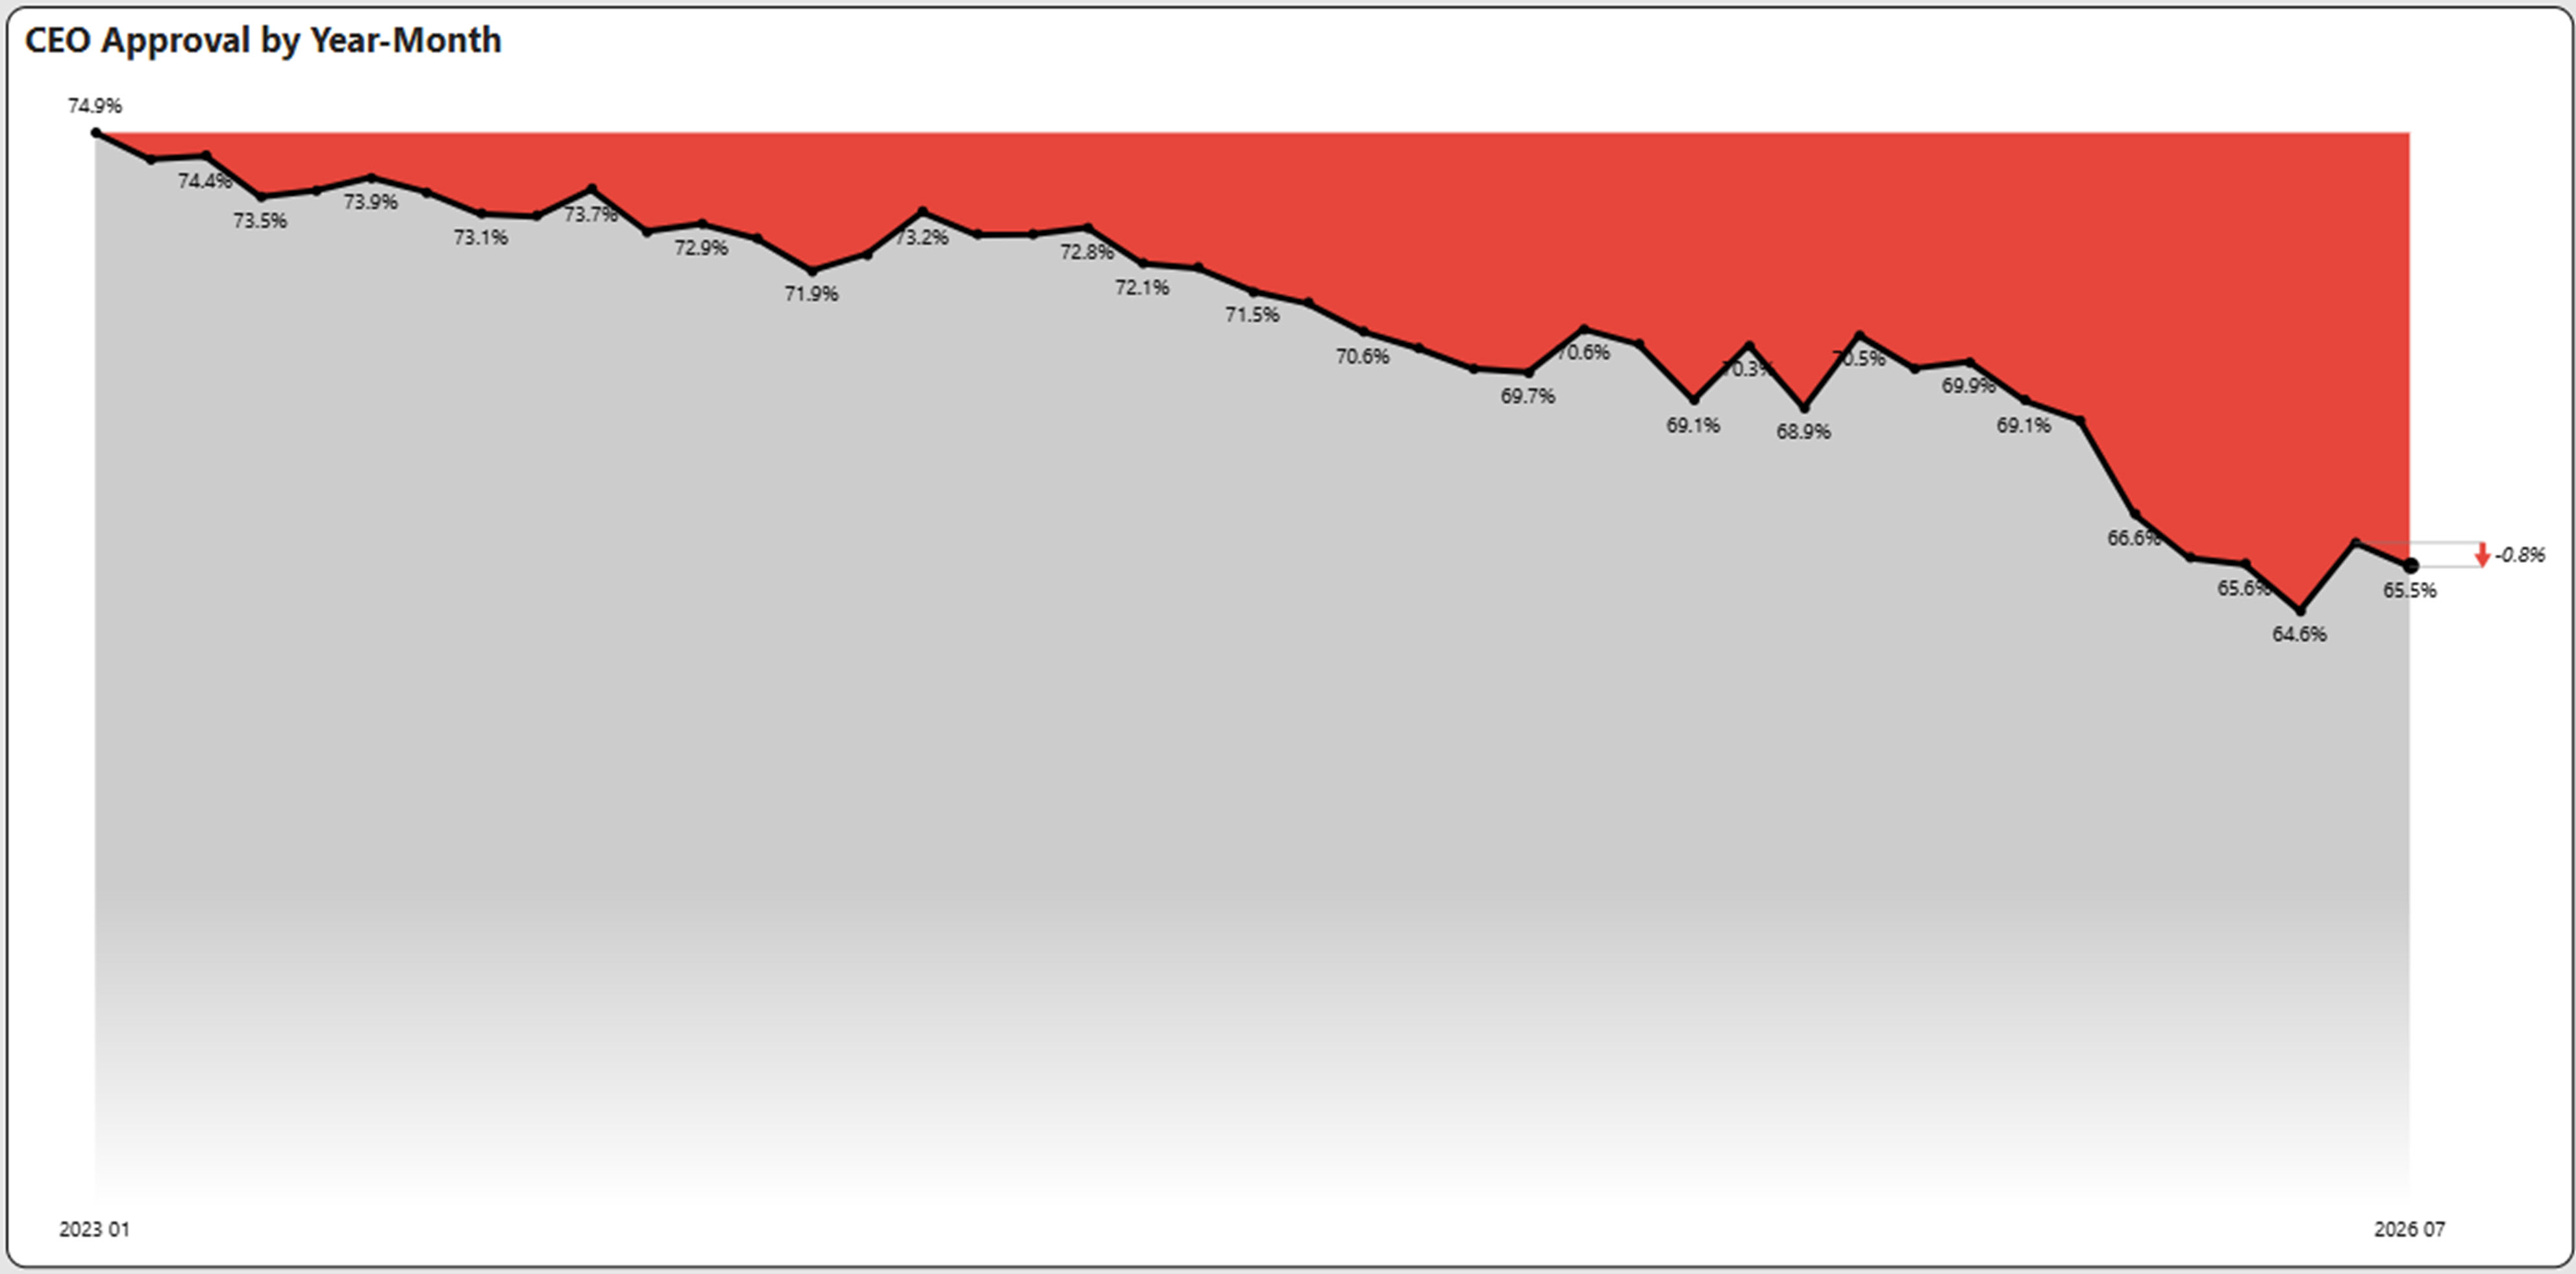
Likewise, CEO Approval is still slightly up at 65.5% from the lowest point of 64.6% in May, but still well below 74.9% at the beginning of 2023.
What are the Labor Market Trends?
June Labor Market Update – Hires at 5.3M and Quits at 3.2M
- Hires has rebounded from a ten-year low of 4.9 million, but is staying at mediocre levels from 5.2 million to 5.4 million.
- Job Openings rebounded to 7.6 million in April and is still in that range after hitting a five-year low of 6.9 million.
- Layoffs and Discharges continue to be within historical levels despite the tightness of the labor market.
- Quits at 3.2 million or a 2% increase compared to May is still close to the ten-year lows (excluding the COVID-19 impact).
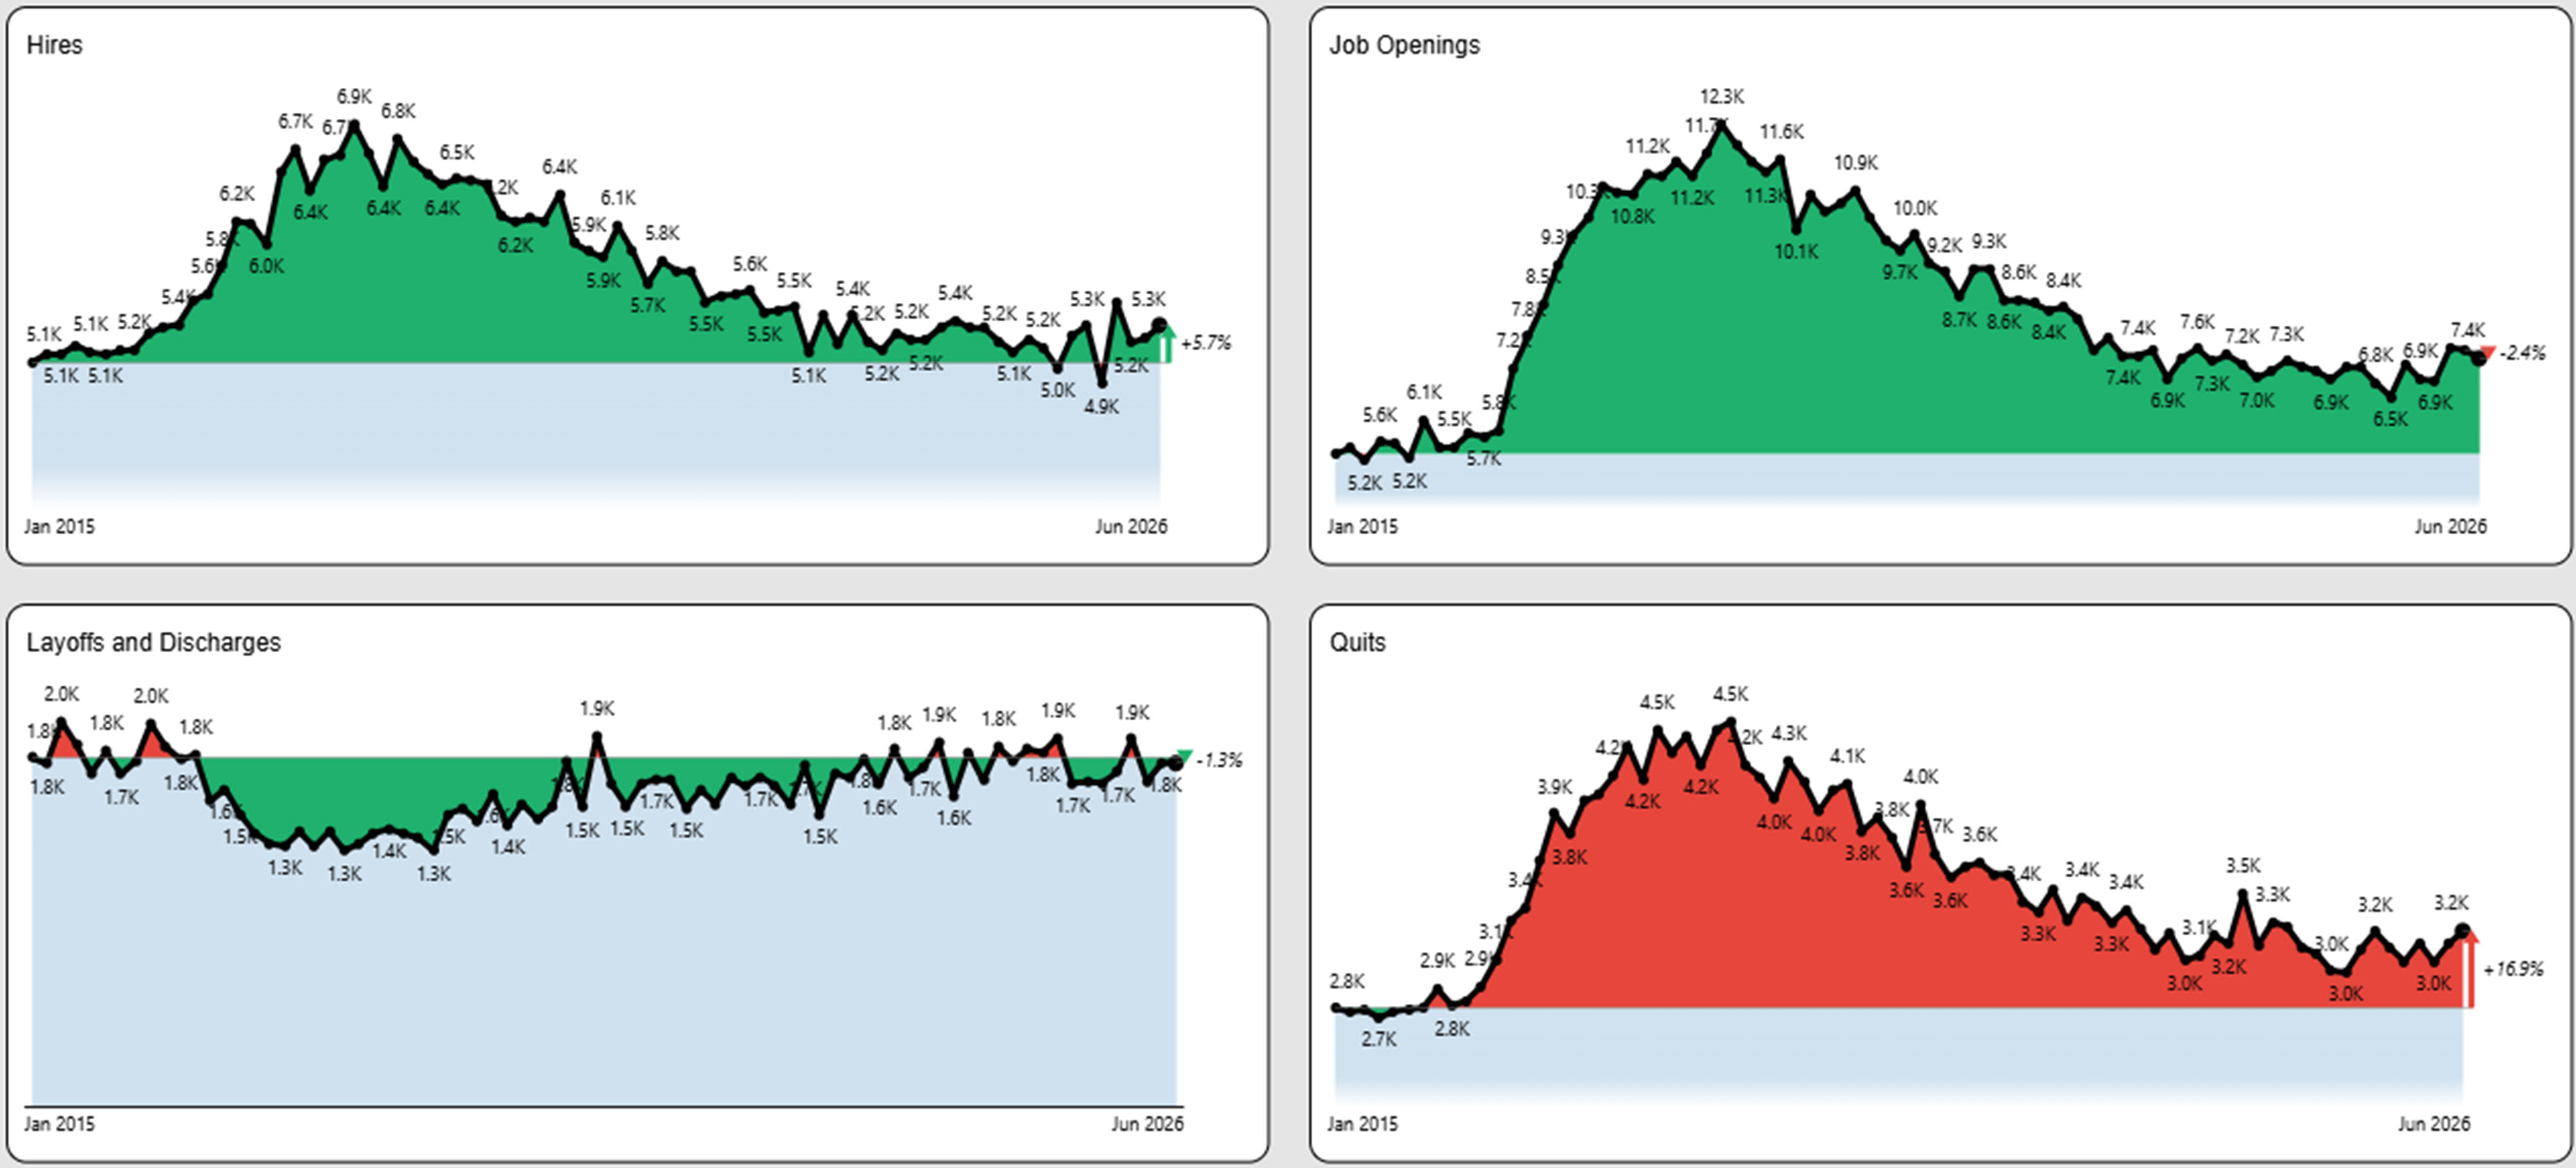
This graph is based on the most current government data available.
Competitive Job Market Data is a Powerful Tool
How Can Must-Have Job Market Data Help You?
Public Insight provides current, enriched and detailed job market data on jobs, titles, salaries, employers, locations, industries, education, reviews, skills, benefits and more. We provide flexible ways to access job market data via your AI agent, API, and exports/feeds. High quality, current job market data can help you with the following:
- Justify Recruiting Decisions and Utilize Data to Tell Your Hiring Story
- Inform Recruitment Marketing Budgets, Strategies and Priorities
- Compare Competitors and Industries
- Understand and Improve College-to-Career Paths and Employment Outcomes
- Enhance Your Solution Offering (Solution Providers)
- Identify Business Development Opportunities (Solution Providers)
- Develop Content for Clients and Marketing (Solution Providers)
Get Started!
Schedule a Call – Let’s discuss how you can leverage job market data
Try it Out – Get a sample data set