Public Insight’s April 2026 Jobs Report summarizes market data from the millions of job postings, resumé updates and employer reviews available in our TalentView platform.
Summary – April 2026 Jobs Report
What are Key Job Market Metrics in April?
What are April’s Job Posting Trends?
April Job Postings Declined 25.1% from March
April 2026 job postings of 1.9 million declined 25.1% from last month, and declined 31.9% from April of last year. Year-over-year declines have become consistent in the current job market. So far this year, March had the highest amount of job postings at 2.6 million.
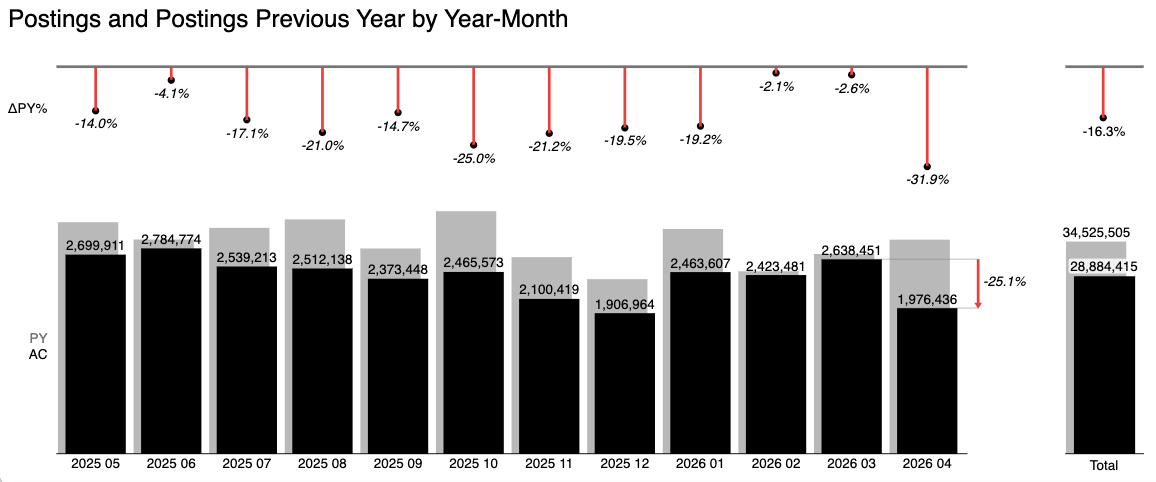
Also noteworthy is the possible impact in job posting counts resulting from a change that Indeed® has made starting April 1st to limit or eliminate free, organic, single-source XML/API job feeds. Approved Integrated ATS solutions can still push jobs via Indeed Apply.
Industry Job Posting Trends – Retail Sector Declined the Most from Last Month by 34.53%, and Transportation Declined the Least by 6.58%
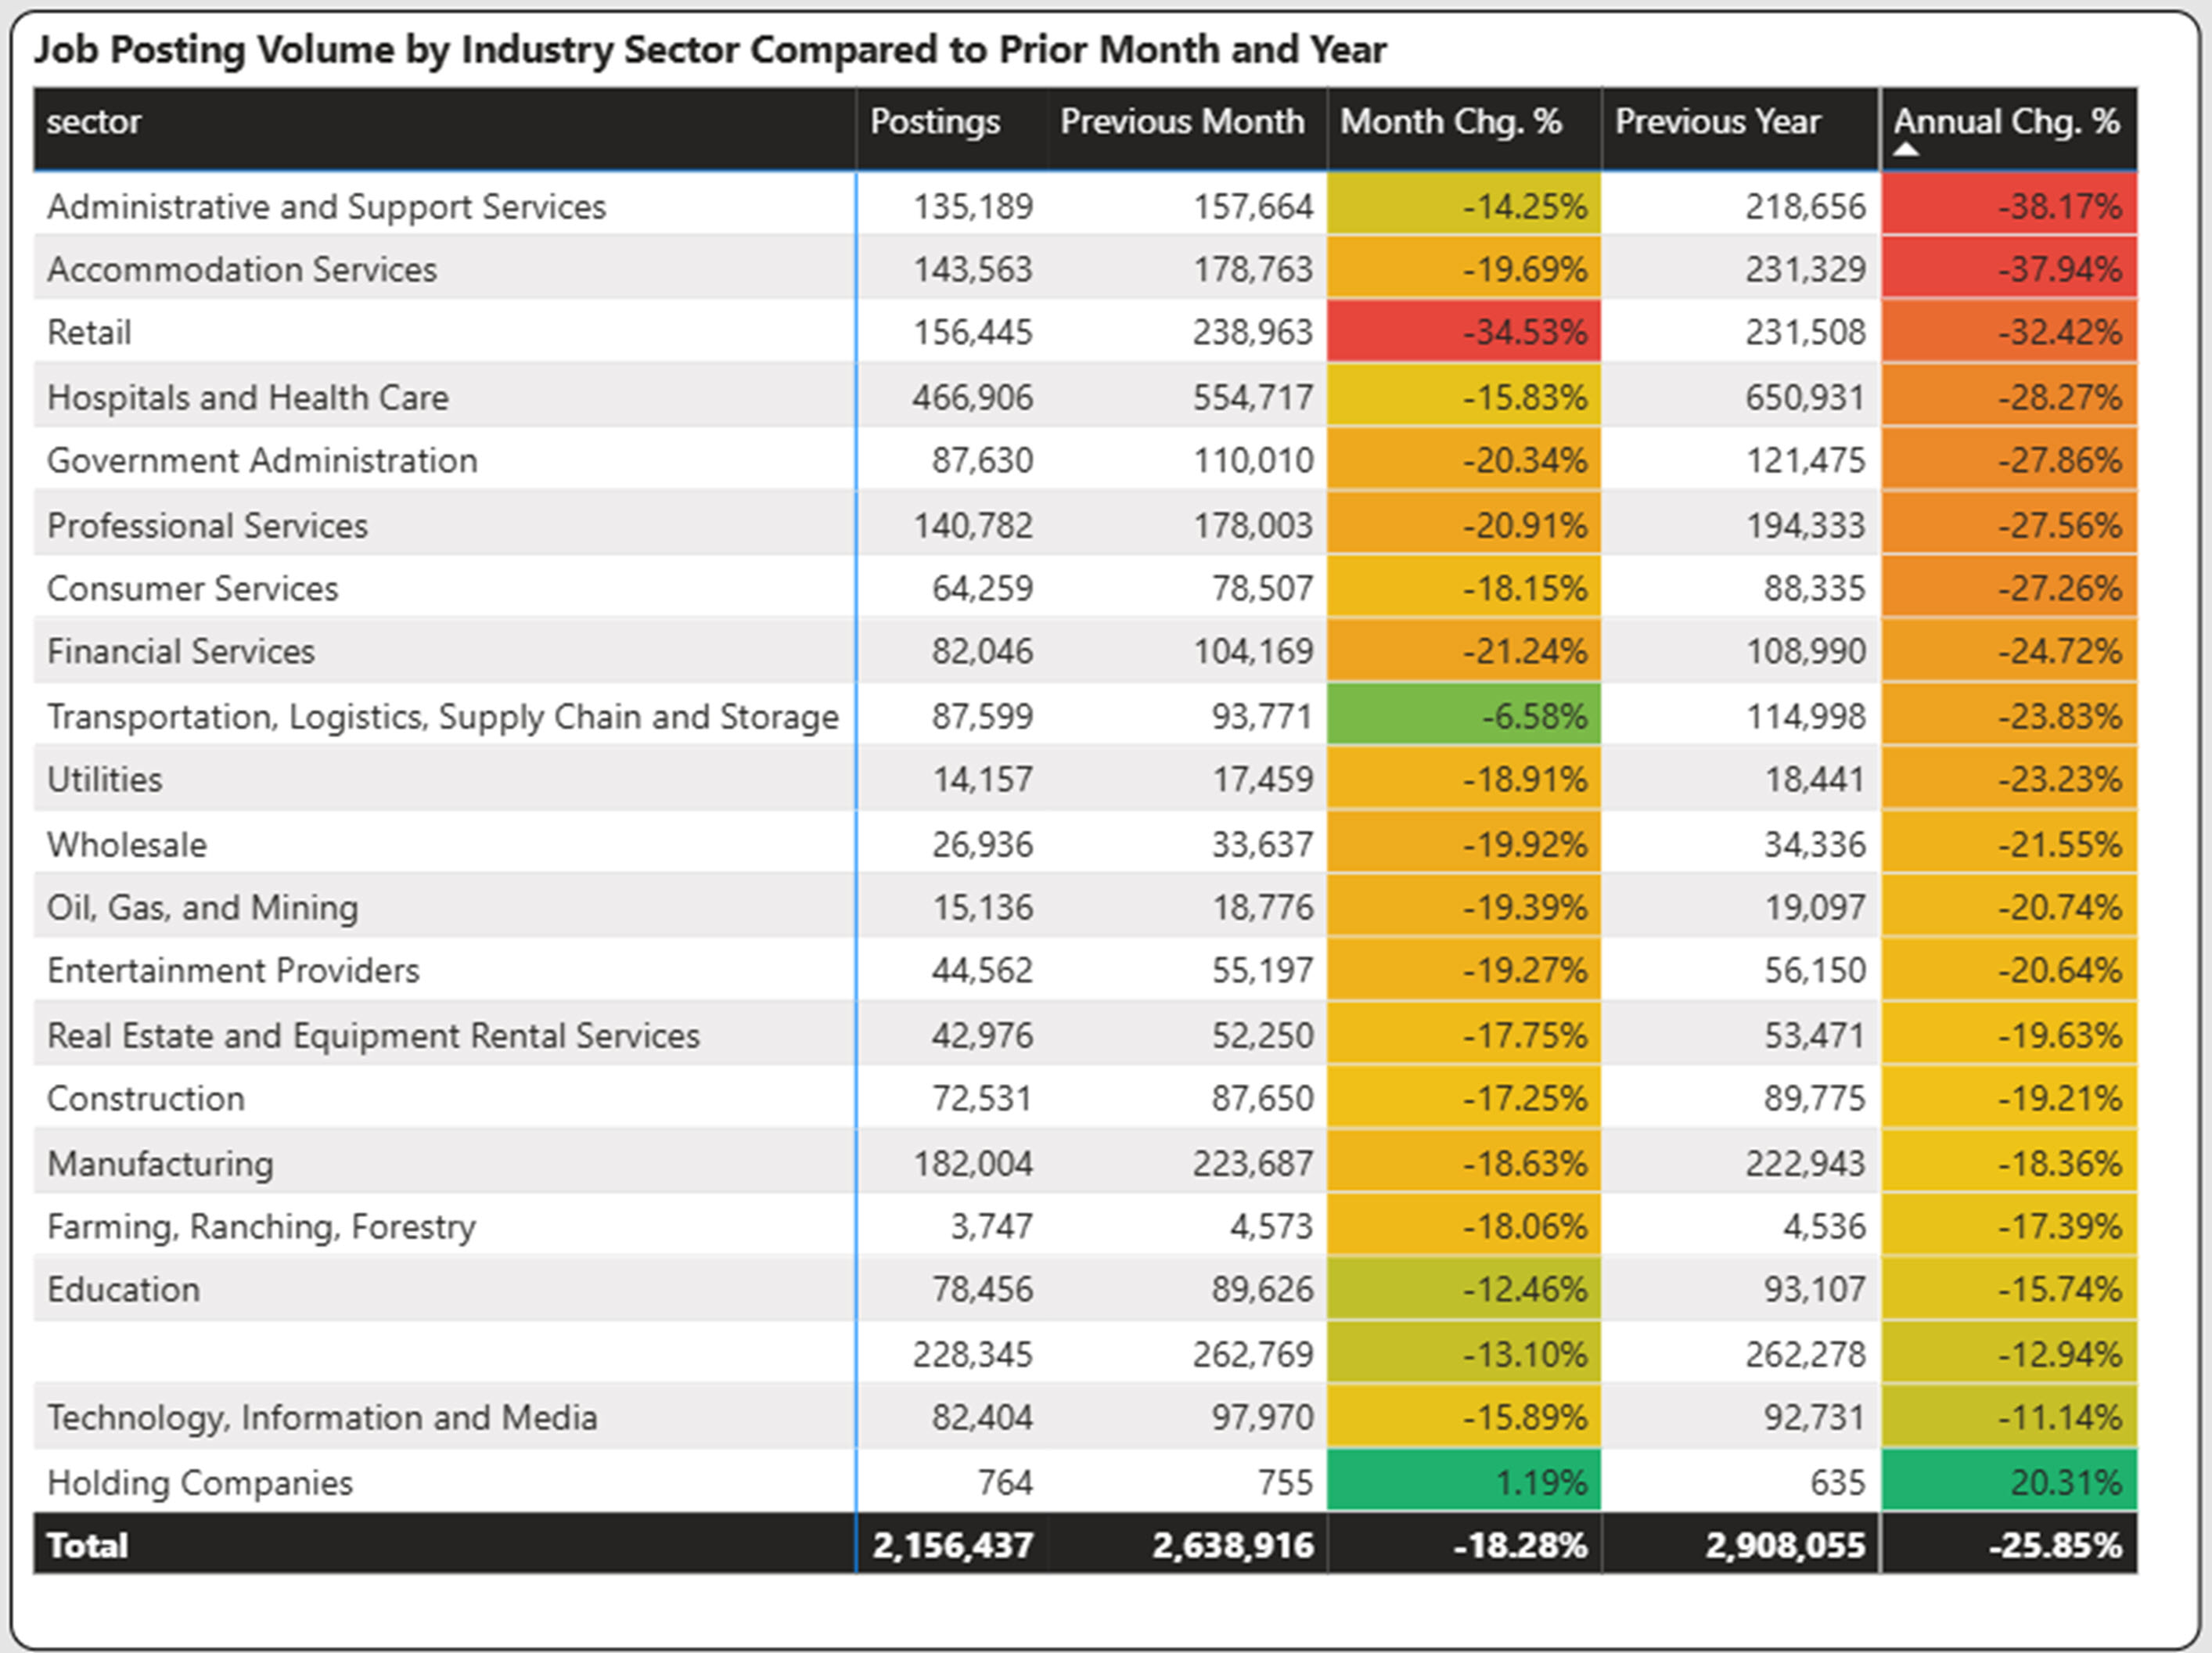
Every sector declined in April 2026 vs April 2025. The top three decliners were Administrative and Support Services (-38.17%), Accommodation Services (-37.94%), and Retail (-32.42%), respectively.
The Retail industry showed a significant decline of 34.53% in April compared to March. Transportation had the smallest decline by 6.58%. The graph below compares April postings by industry to the previous year and last month.
Sponsored and Quick Apply Job Ad Rates Spike in April
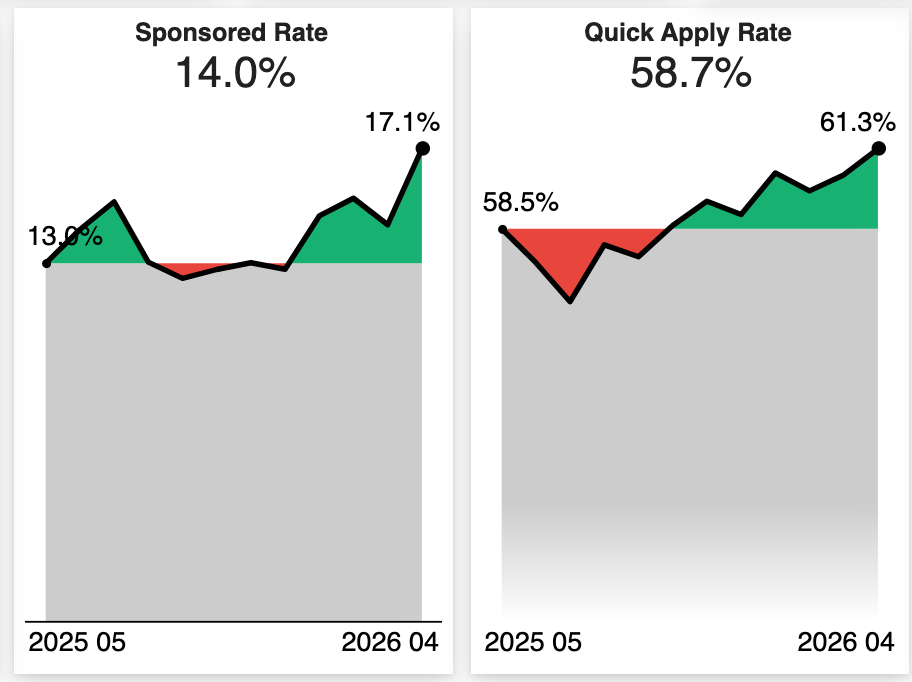
Sponsored rate is the percentage of job advertisements that have had a paid sponsorship at some point over the time period. This is a measure of job boards’ activity.
Indeed Quick Apply jobs (often labeled as “Easily Apply”) are job listings where you can apply directly on Indeed without being redirected to an external company website.
Both of these job posting metrics hit their highest points in April over the last 12 months. This could be driven by the change Indeed made to limit organic postings via single-source XML/API job feeds.
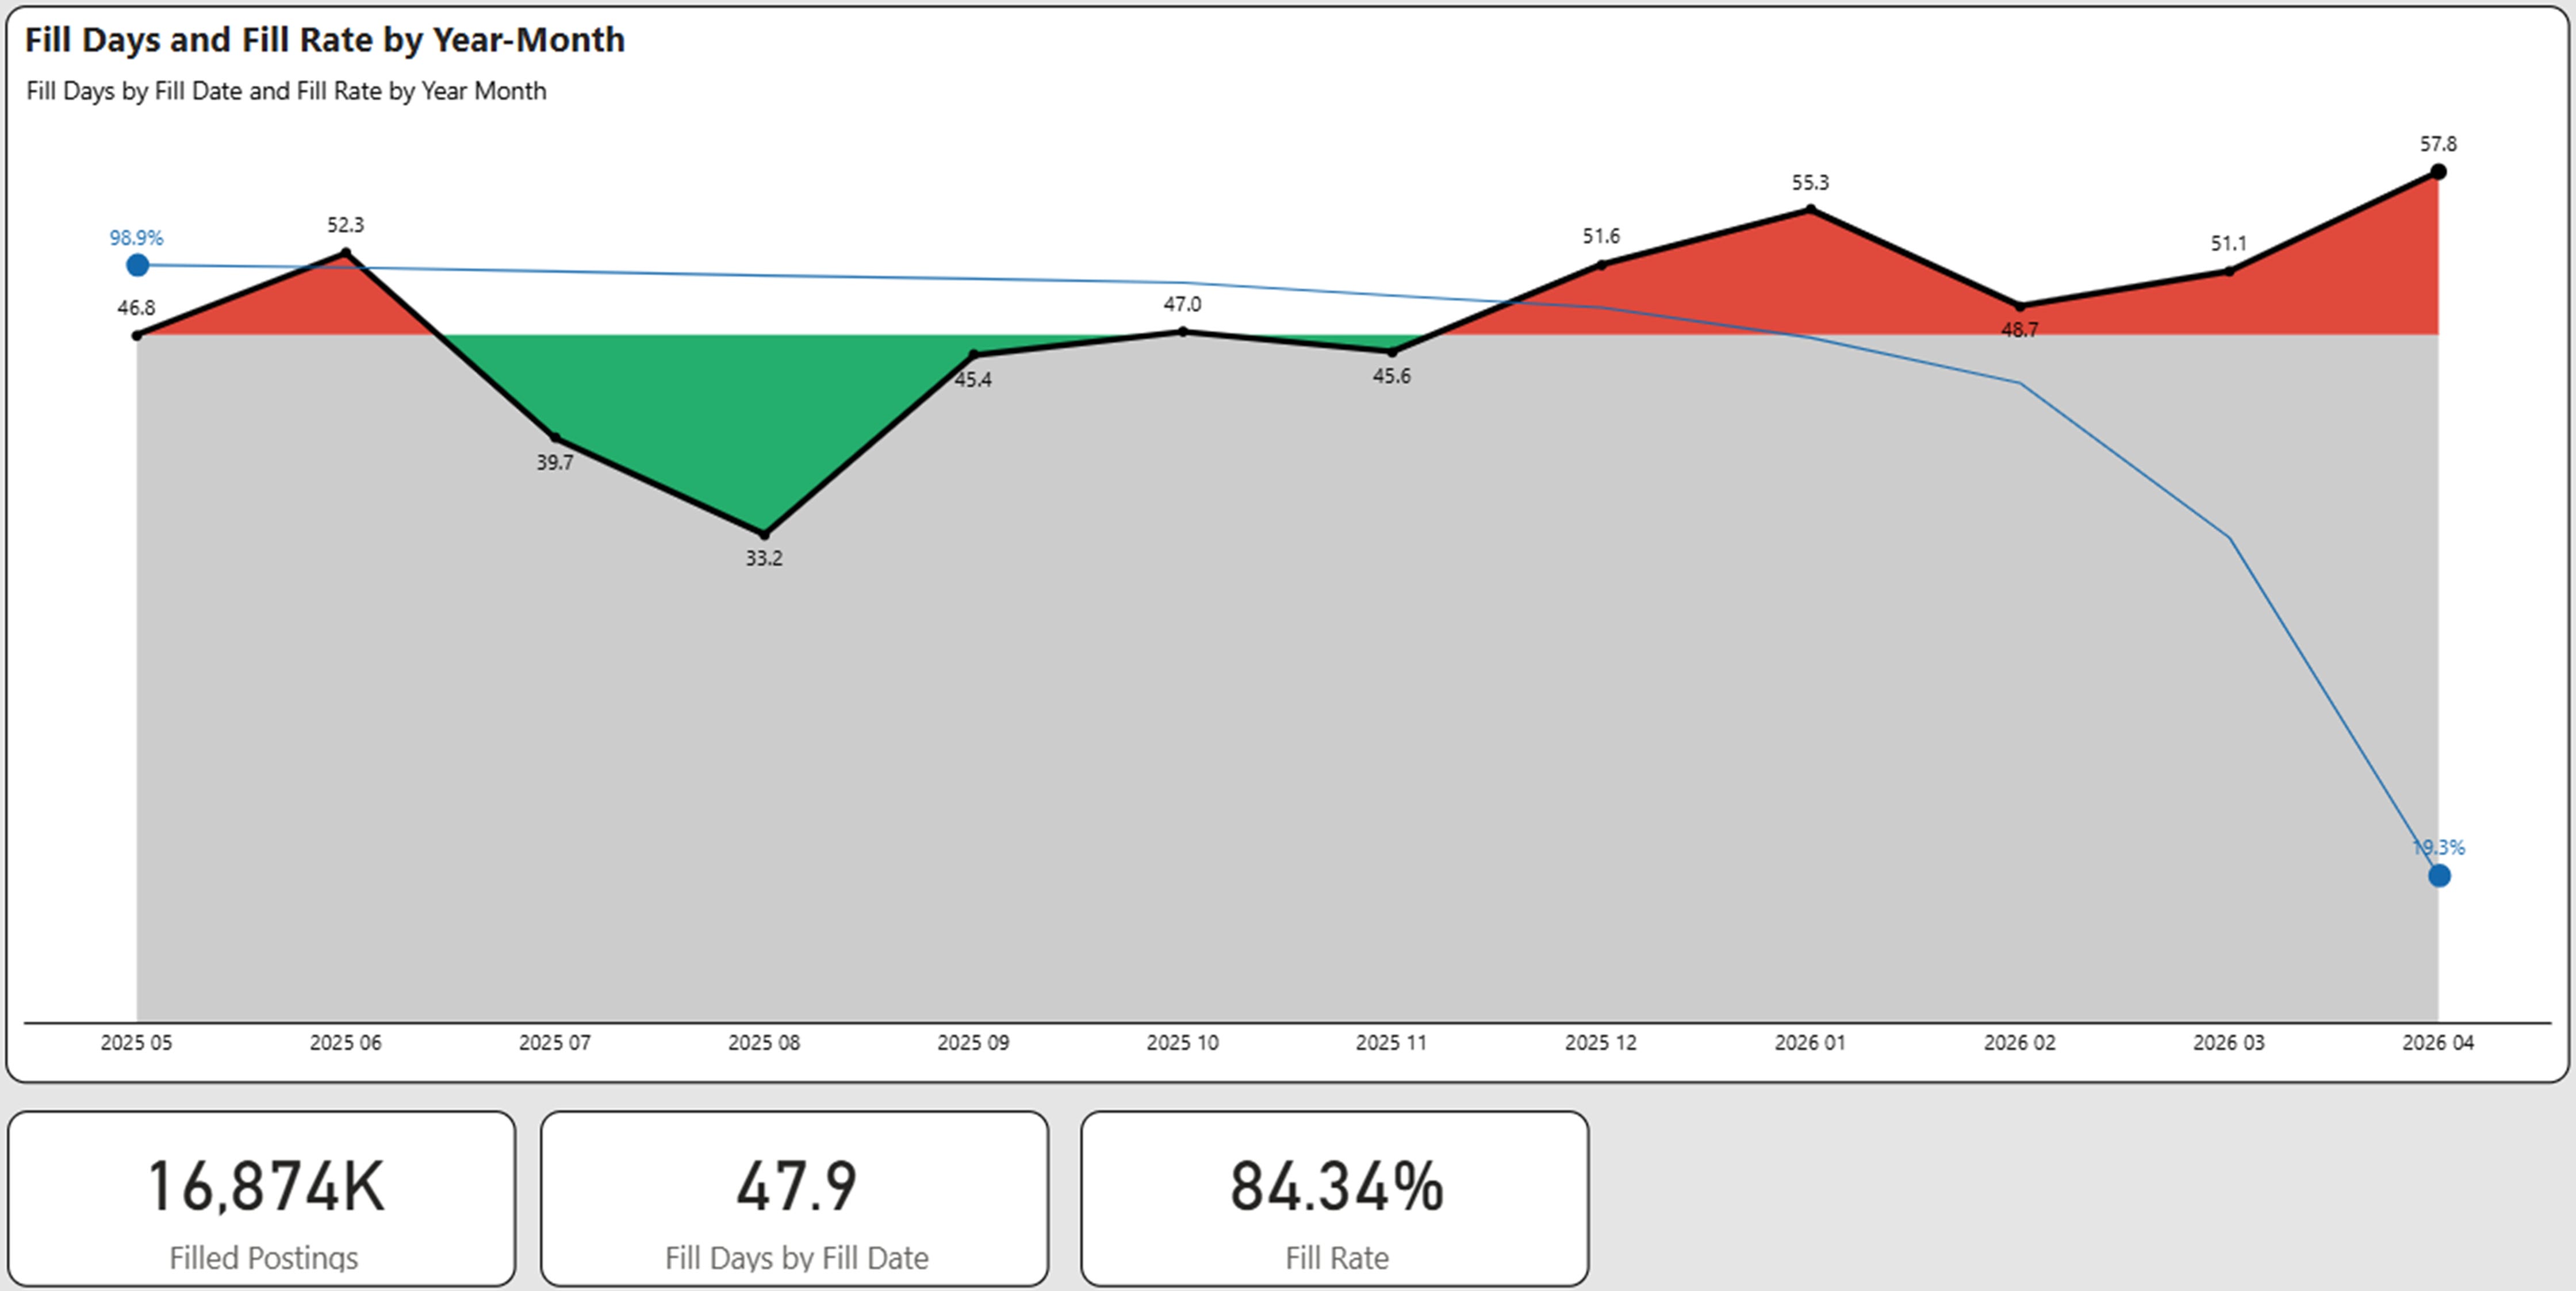
Average Fill Days are Flat at 47.9 Days
For fill days we use ad expiration and ad removal to determine a presumptive hire. When measured over a prolonged period of time and over millions of postings, this provides a strong view of the overall market. The trailing 12 months is used as a time period for our analysis.
In the graph below, we show the fill days by month along with the percentage of ads (blue line) that have been filled. Obviously, the newer ads have a lower fill rate.
The average fill days over the last 12 months was flat in April at 47.9 days compared to March at 47.8 days. However fill rates decreased from 85.93% in March to 84.34% in April. This rate is still below late 2025 levels of 86-87%.
Average Open Postings is 57 Days
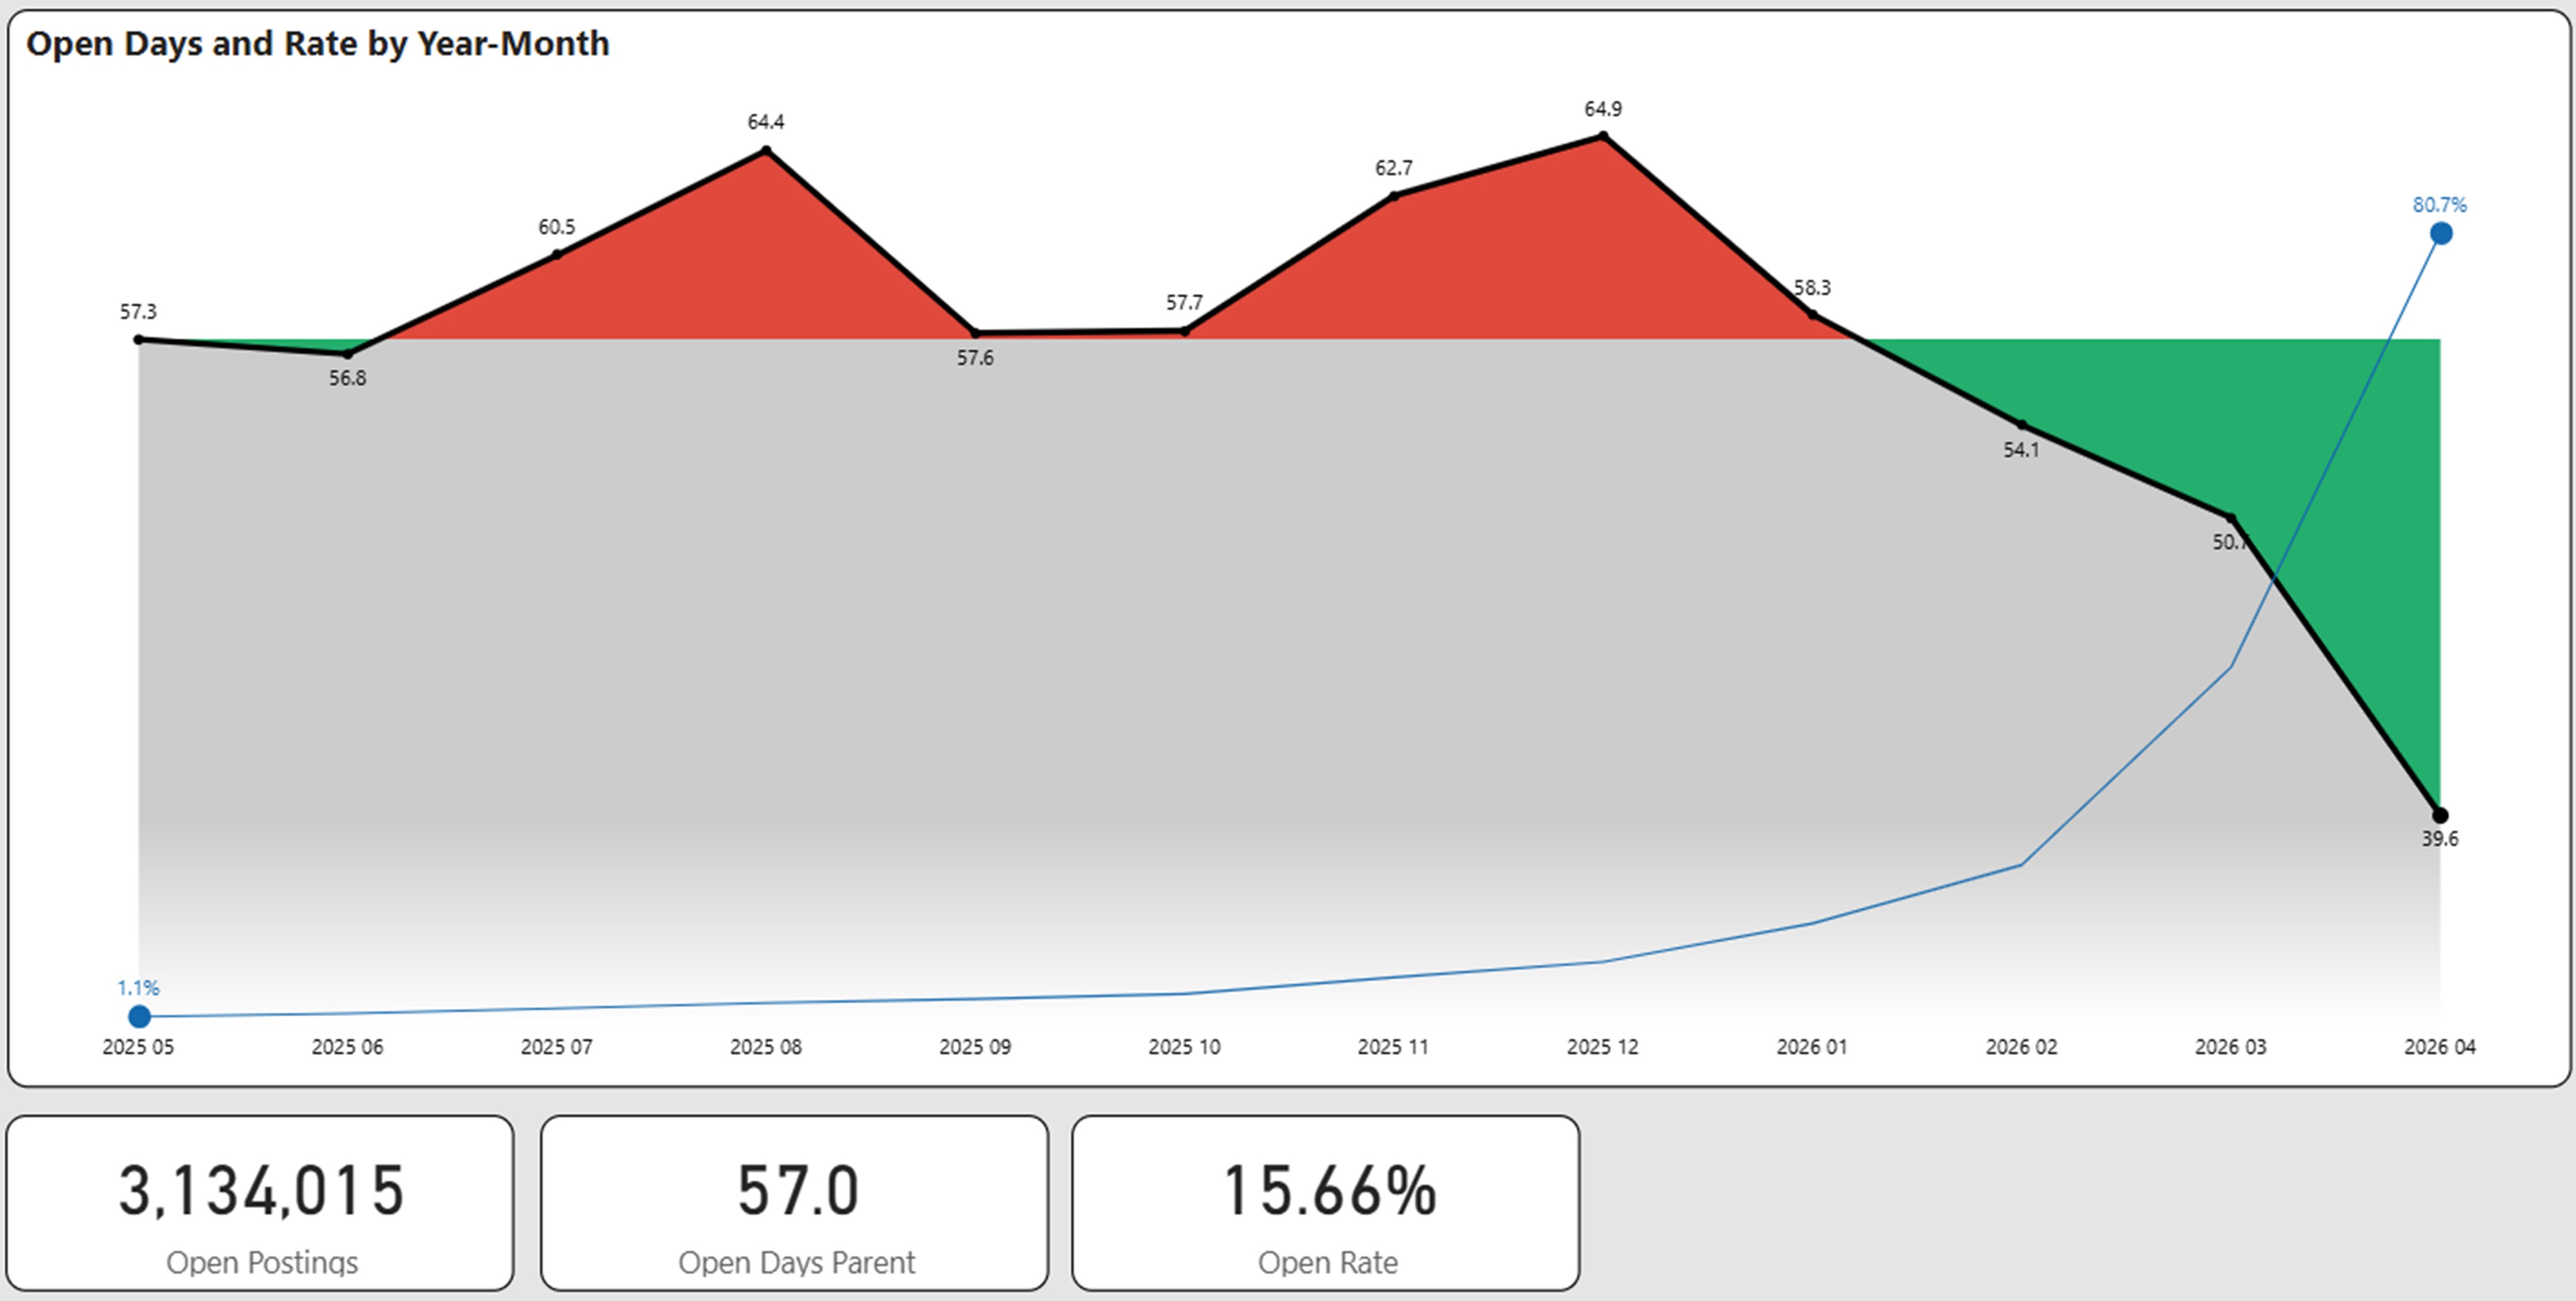
We track every job posting uniquely and ascertain its fill status on a weekly basis. Open days is the average age of postings that are still determined to be open. Generally, we have found that 12 months to be a suitable time period to evaluate the age of open days. Older postings may distort the open days as they may represent “evergreen” postings. For this reason we eliminate implied evergreen ads that are older than one year from our analysis.
What is the Average Salary in the U.S.?
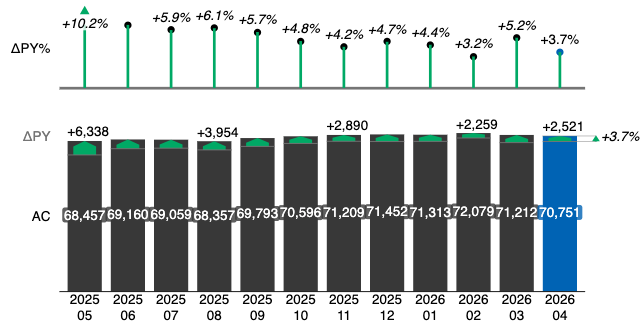
Average Salary in April is $70,751 – Up 3.7% From Prior Year and Slightly Down from March
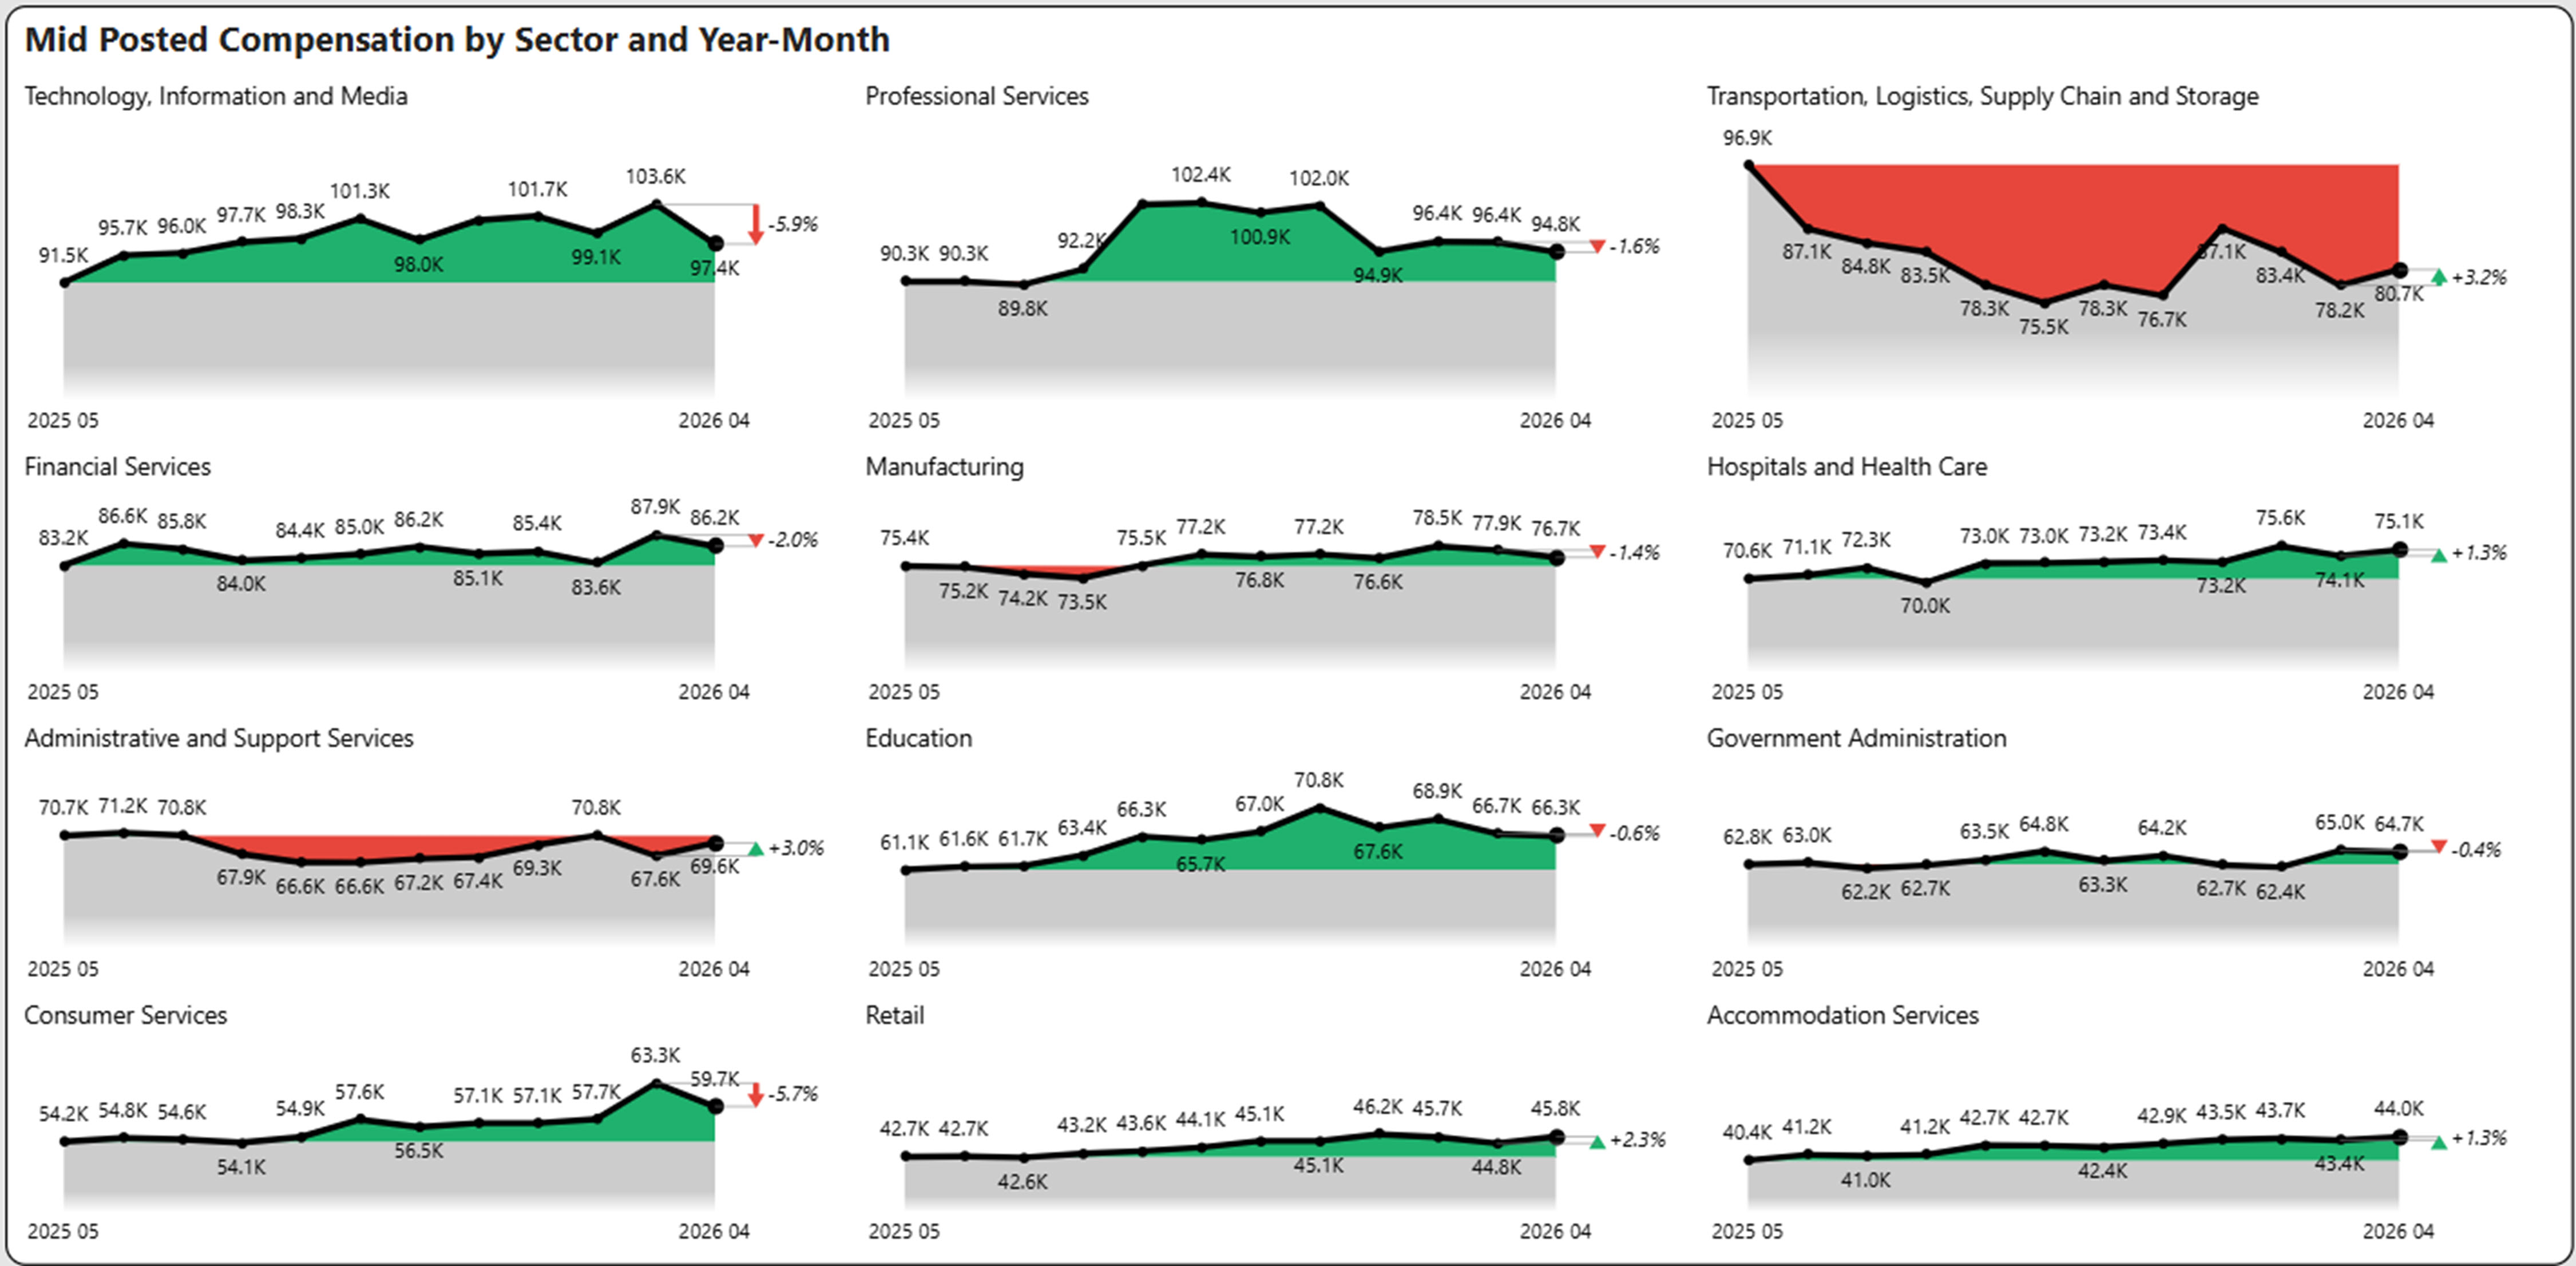
Average Compensation by Industry Shows Technology Declined by 5.9% and Transportation Increased by 3.2%
The chart below shows the compensation by industry sector for the past 12 months, highlighting the winners and losers.
What are Labor Supply and Demand Trends?
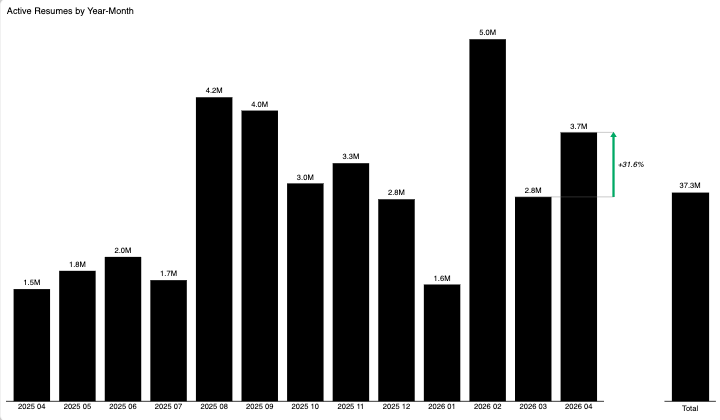
New Resumes Increased in April by 31.6%
We looked at total resumes over the trailing 12 months as an indicator to measure overall job seeker interest. Total trailing resumes over 12 months now stand at 37.3 million. Compared to this same time period last year (April 2024-April 2025), total resumes were at 40.3 million.
In a month-to-month comparison, total new resumes in April increased by 31.6% compared to March and more than doubled compared to April of last year.
Which Industries Have Labor Supply or Demand Challenges?
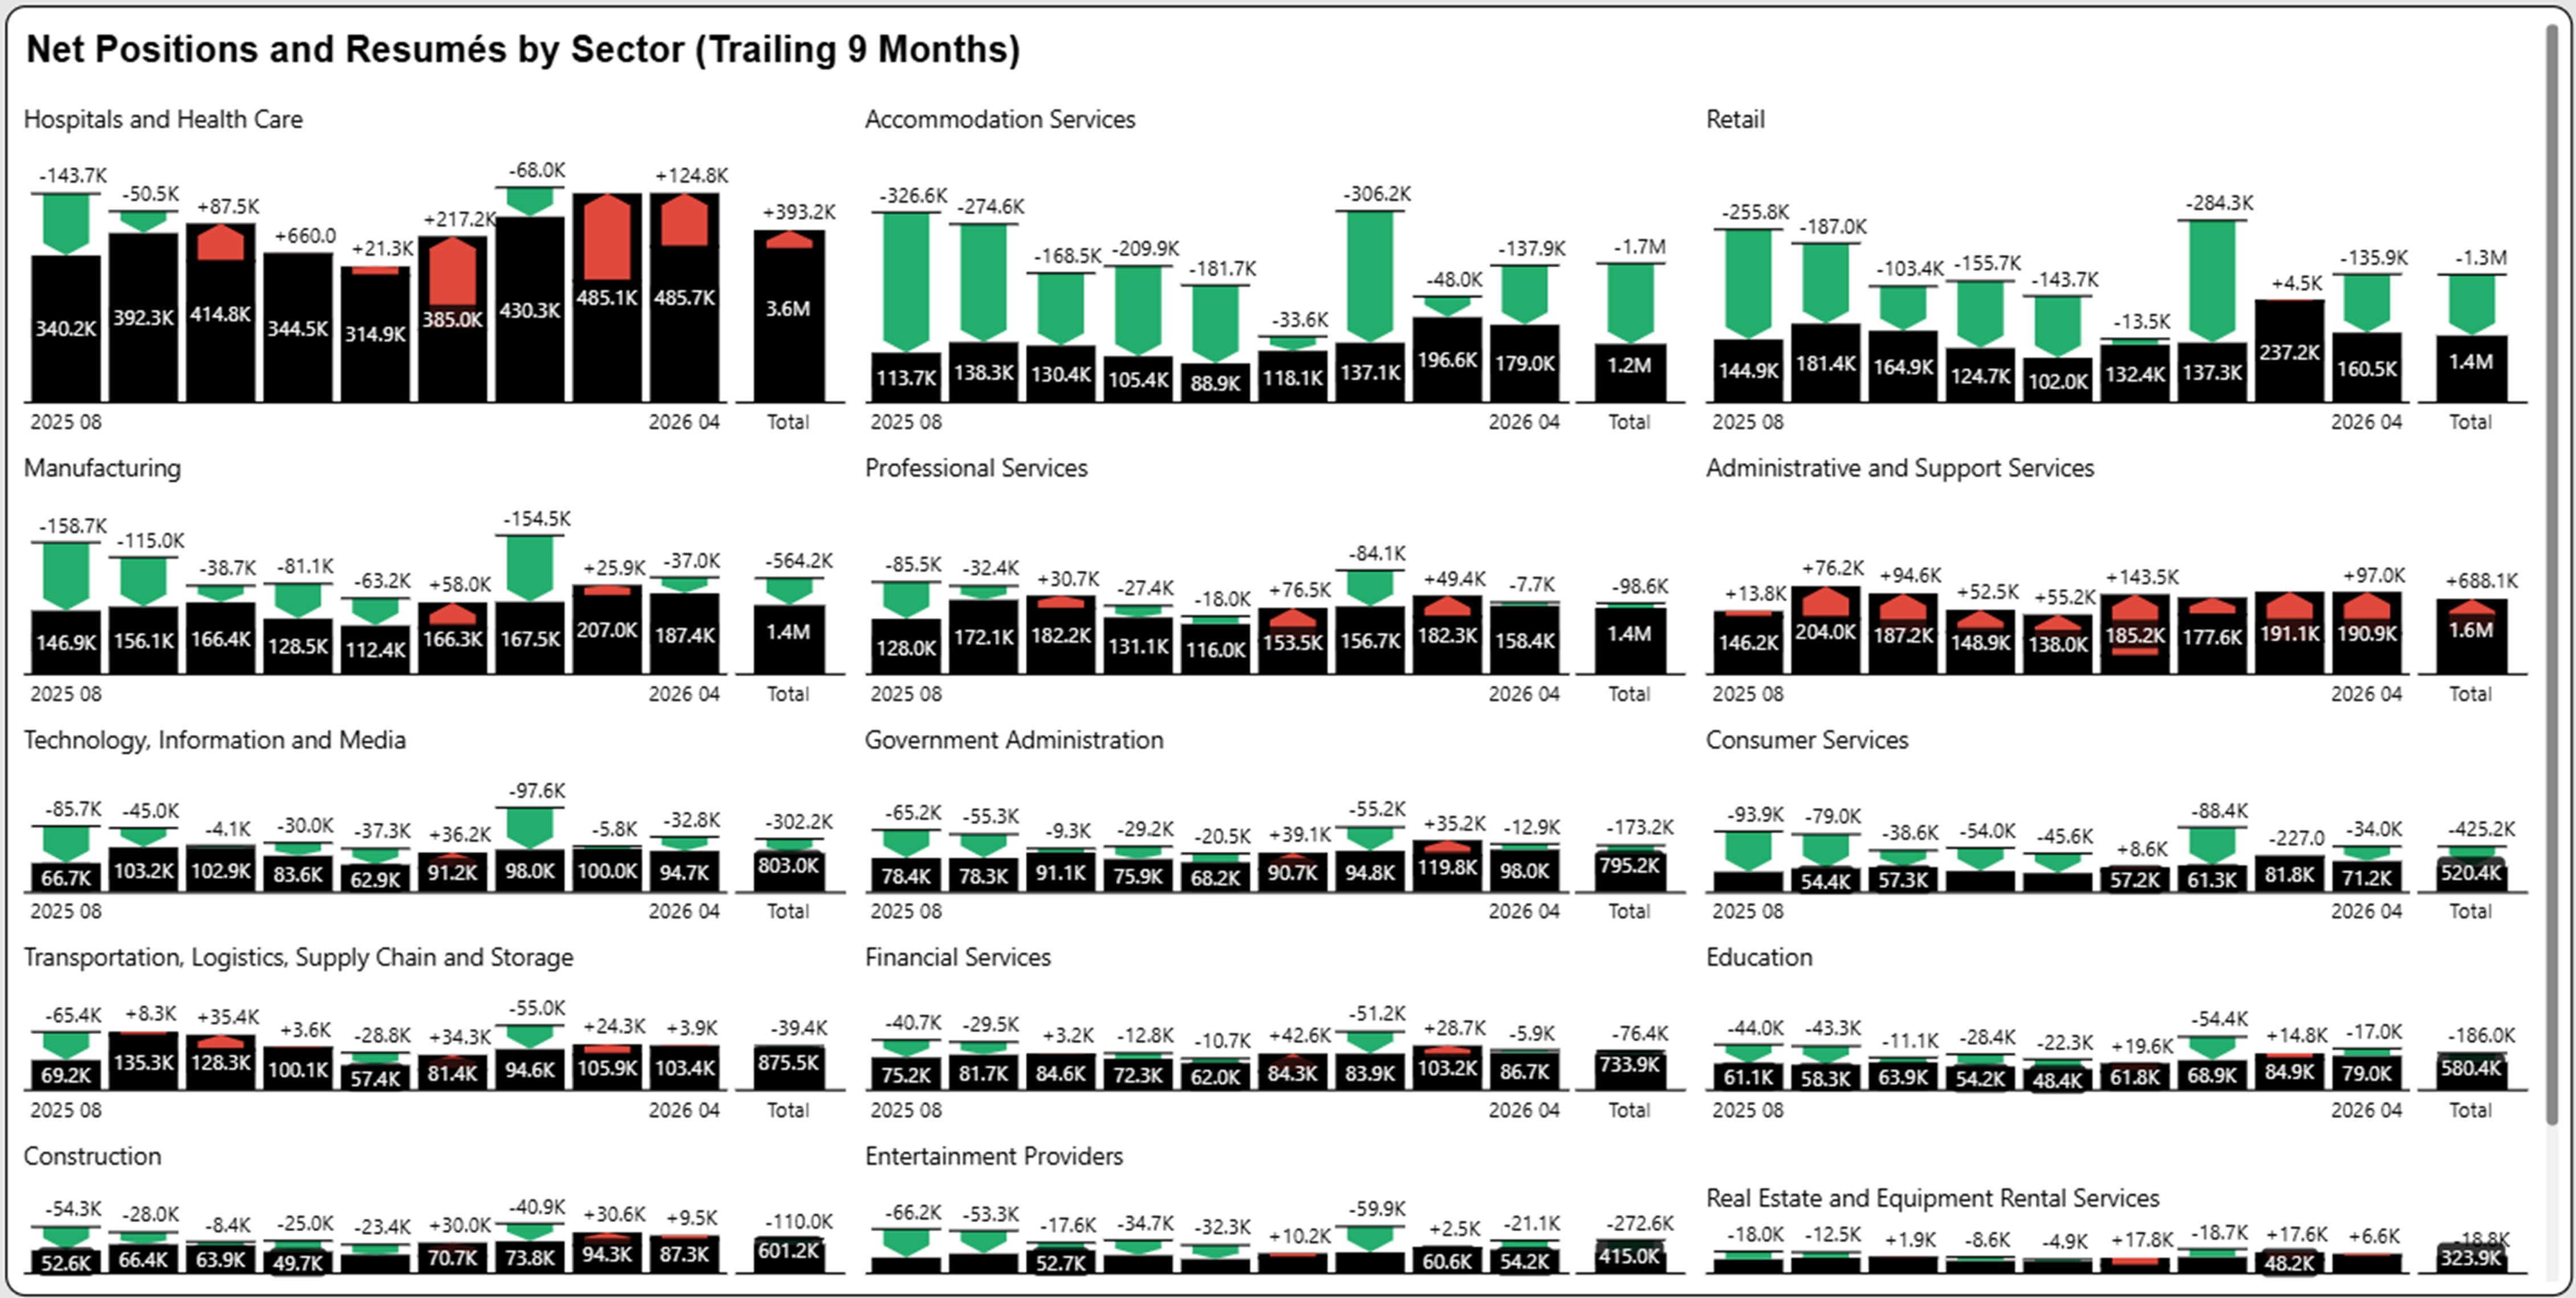
To highlight supply/demand imbalances, we superimpose job seekers based on resumés against net job positions (hires based on unique postings) in black bar. The graphs highlight supply surplus (more job seekers than net postings) shown in green or supply shortage (less job seekers than net postings) shown in red. We picked a time period of nine months, which highlights the current market surplus or shortage. The total bar reflects the summaries of openings and resumés for that time period.
Industry Supply/Demand Scorecard
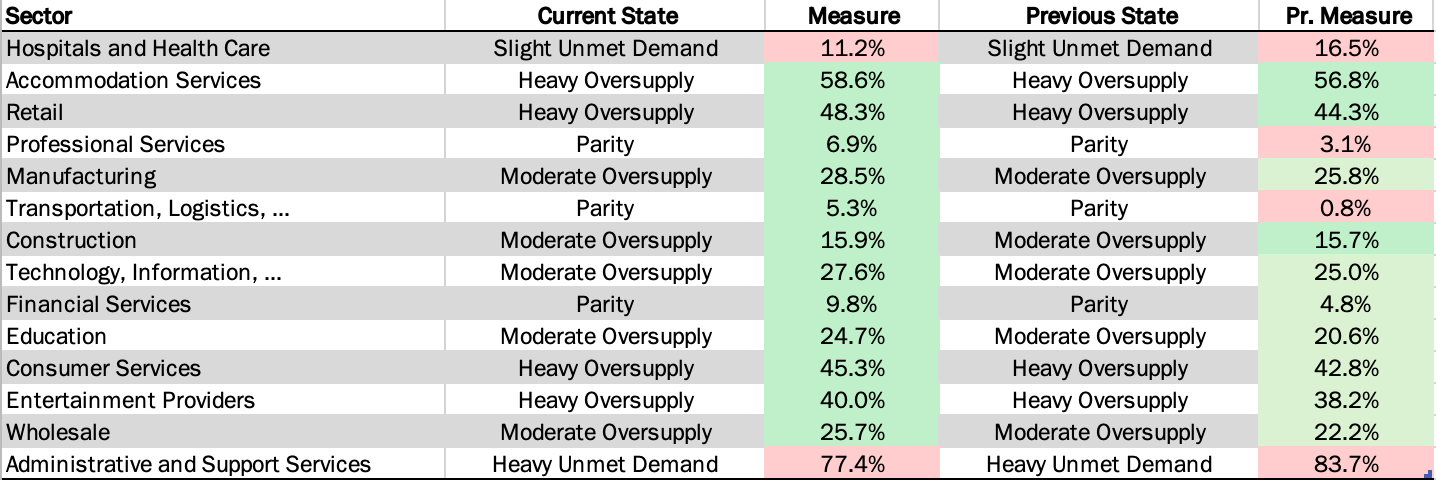
In the scorecard graph below, the Measure column shows the percentage of excess supply over demand (green) or demand over supply (red). The current monthly state is then compared to the previous monthly state with changes (if applicable) highlighted in yellow.
Change is not necessarily good or bad, but we have highlighted changes in supply/demand gaps that significantly impact the current trends.
The trend of a heavy supply market continues from last month.
Hospitals and Health Care is approaching parity after many months at a Heavy Unmet Demand state.
What is the Latest Worker Sentiment in the Market?
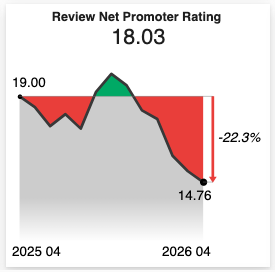
Net Promoter Score (NPS) Hits All-Time Low Over 12 Months
In April, Net Promoter Score (NPS) hit its all-time low of 14.76 over the last 12 months. Net Promoter Score is defined as the percentage of positive reviews over negative reviews.
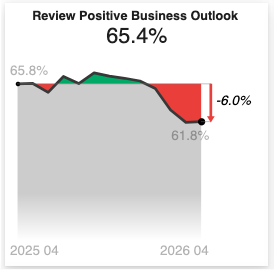
Business Outlook From Employee Reviews Data Drops to 61.8%
Positive Business Outlook as noted on reviews data continues its decline. In April, positive business outlook was at 61.8%, which is a tiny bit lower than March was at 61.9%. The graph below covers the last 12 months. By comparison the “good old days” of early 2023 stood at over 70%. It is cause for alarm when nearly one out of two reviewers think that business outlook is negative.
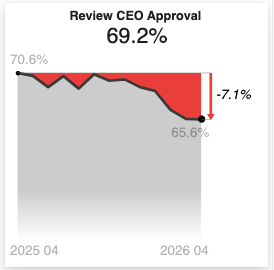
Likewise, CEO Approval also continues its decline at 65.6% in April compared to 65.9% in March. At the beginning of 2023 CEO Approval was at 74.9%.
What are the Labor Market Trends?
Key Labor Market Trends in March – Hires Increased by 9.7% and Quits Increased by 14.7%
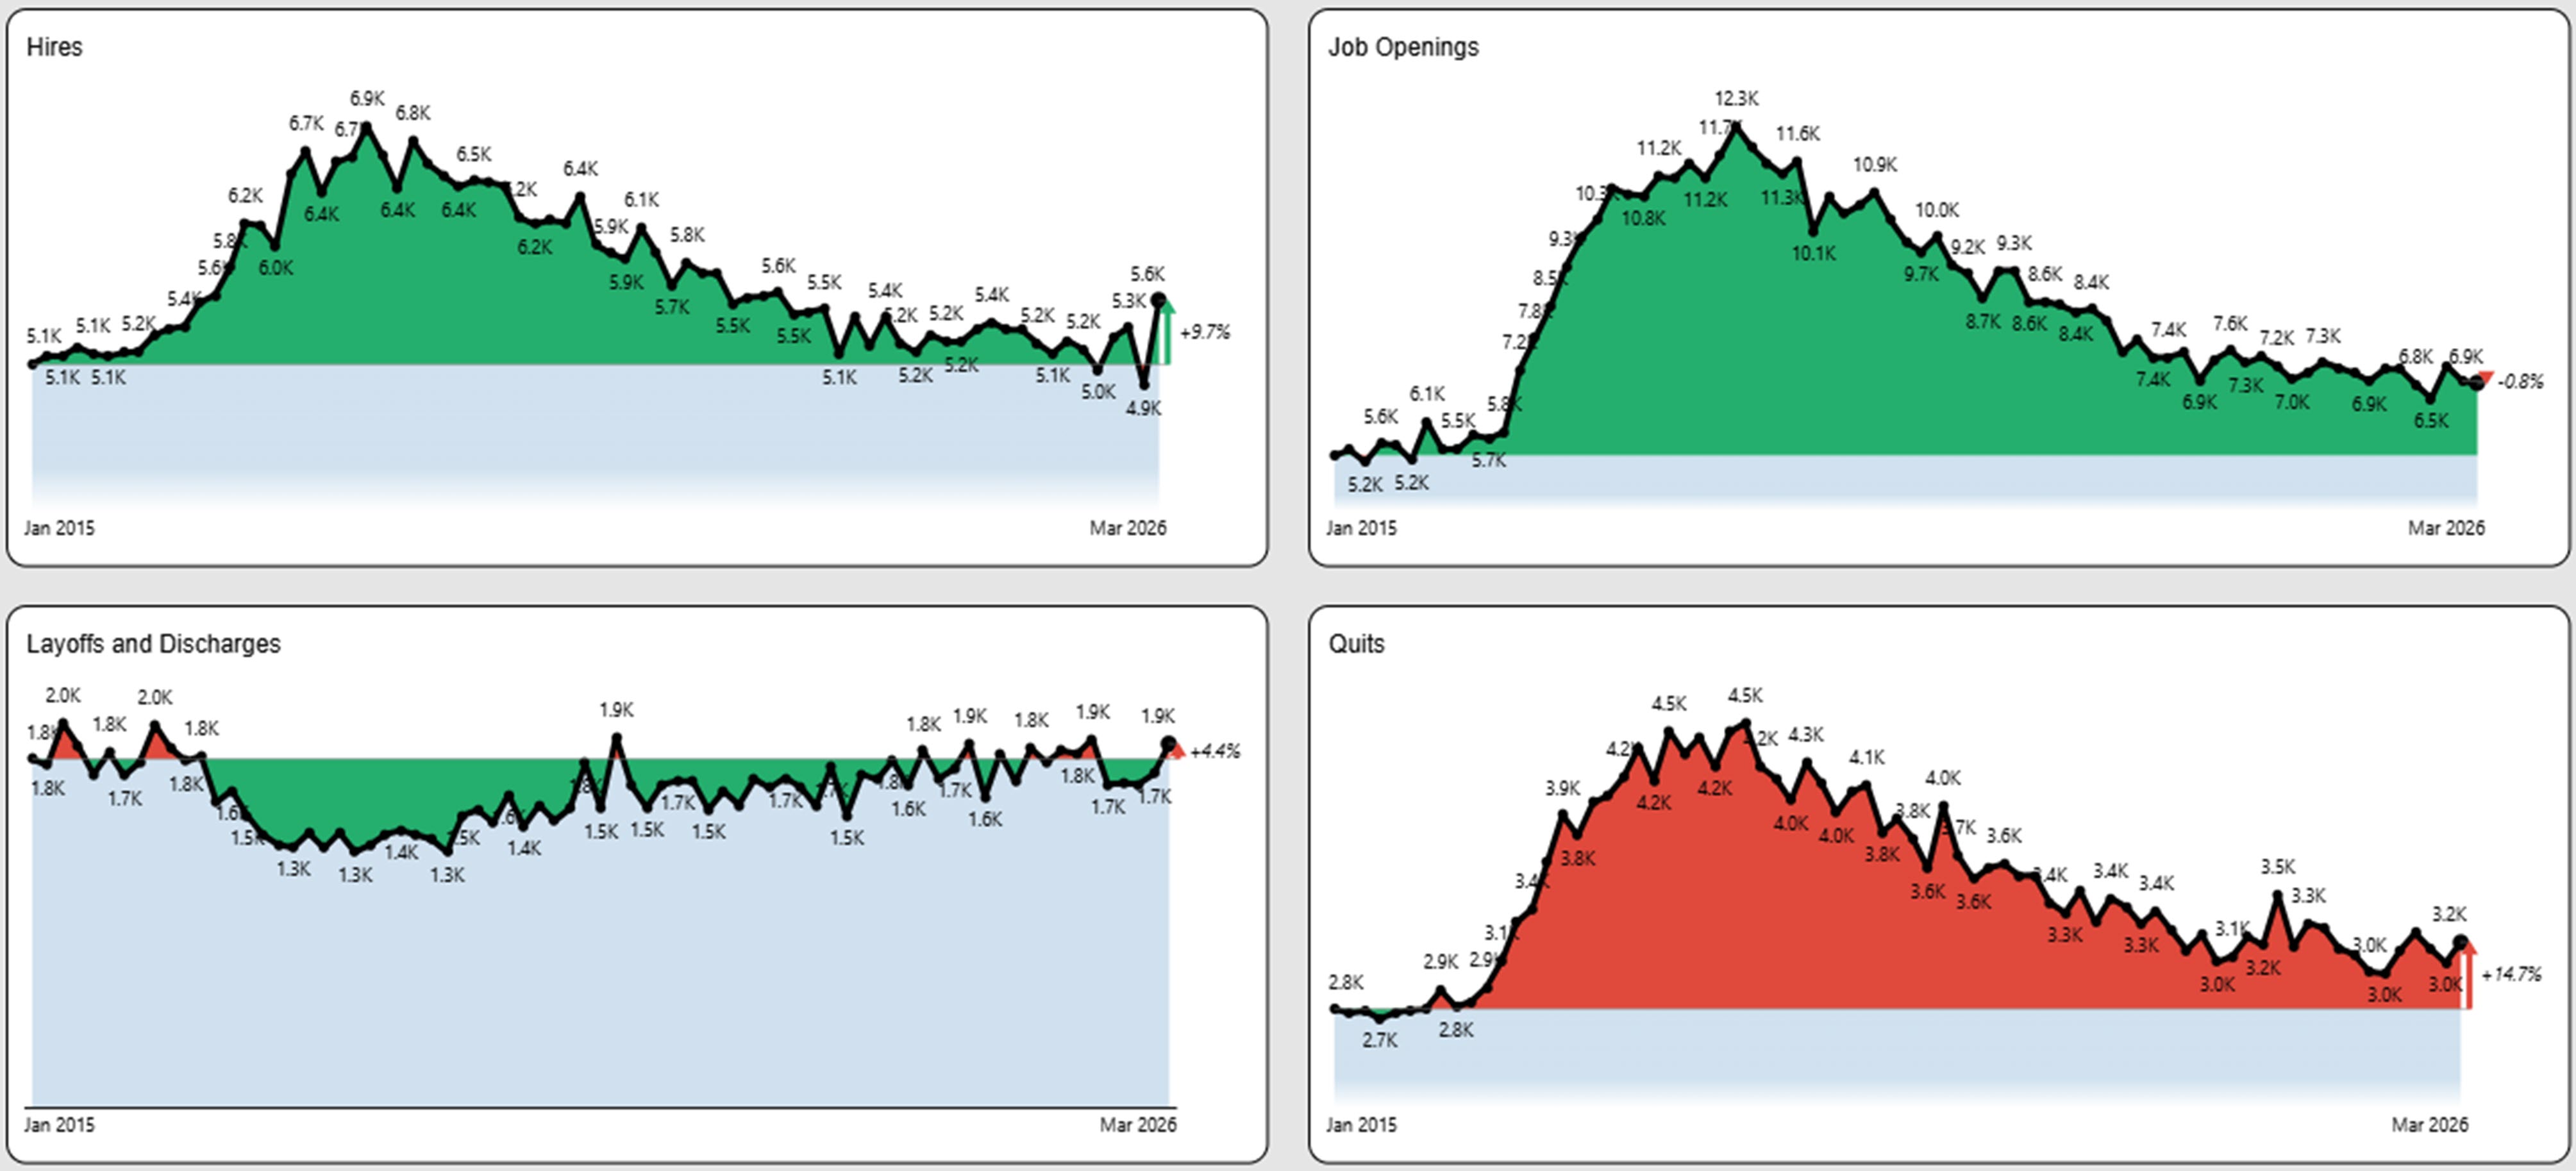
This graph is based on the most current government data available.
Competitive Talent Market Data is a Powerful Tool
How Can Must-Have Talent Market Data Help You?
Public Insight provides current, enriched and detailed talent market data available by title, employer, location, industry and more. We provide flexible ways to utilize talent market data via AI agent Integration, API, data feeds, and interactive dashboards. High quality, current job market data can help you with the following:
- Justify Recruiting Decisions and Utilize Data to Tell Your Hiring Story
- Inform Recruitment Marketing Budgets, Strategies and Priorities
- Competitor and Industry Comparisons
- Enhance Your Solution Offering (Solution Providers)
- Identify Business Development Opportunities (Solution Providers)
- Develop Content for Account Management and Marketing (Solution Providers)
Get Started!
Schedule a Call – Let’s discuss and demonstrate how you can leverage talent market data and insights
Sign Up for a Trial – Try out our interactive dashboards or get sample data