Public Insight’s May 2025 Jobs Report summarizes market insights from the millions of job postings, resumé updates and employer ratings/reviews available in our TalentView talent market intelligence platform.
Summary
Dashboard – Comparisons of Key Metrics from May 2025 to April 2025 and to May 2024

Postings
Posting Volume Declines
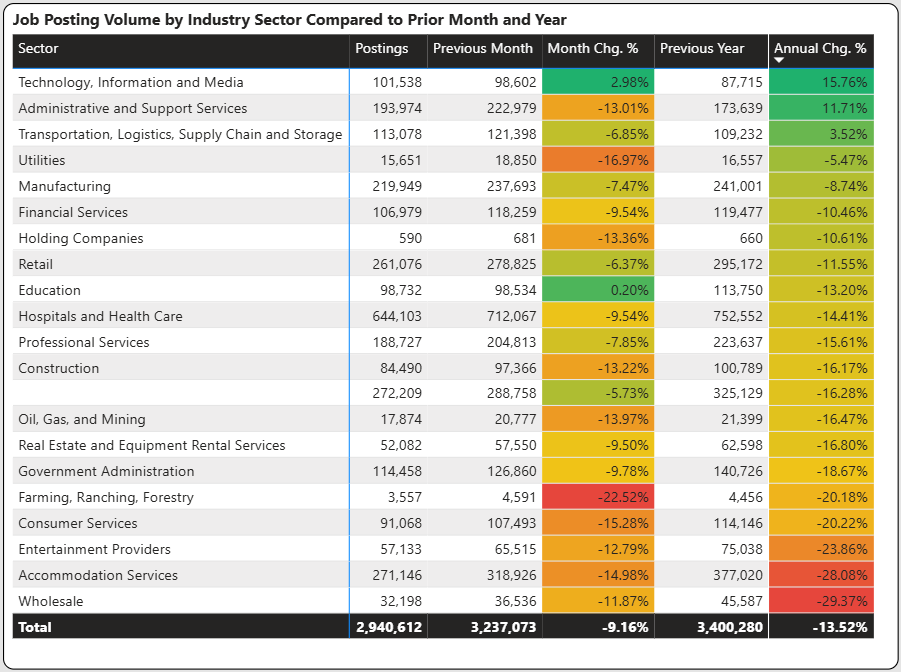
May job postings declined 13.5% from the same period last year to 2.94 million. Postings have declined from the prior year in each month in 2025. However, the percentage of decline is substantially less than the 18% declines in February and March. Postings after increasing in March and April declined sequentially 9.2% in May.

Posting Volume By Industry
Year-over-year volume declines occurred in 17 of the 20 sectors. Highlights include:
Fill Days Increase and Show Gradual Upward Movement
Fill days use ad expiration and ad removal to determine a presumptive hire. When measured over a prolonged period of time and over thousands and millions of postings provides a strong glimpse of the overall market. The trailing twelve months is used as a time period for our analysis.
In the graph below, we show the fill days by month along with the percentage of ads (blue line) that have been filled. Obviously, the newer ads have a lower fill rate.
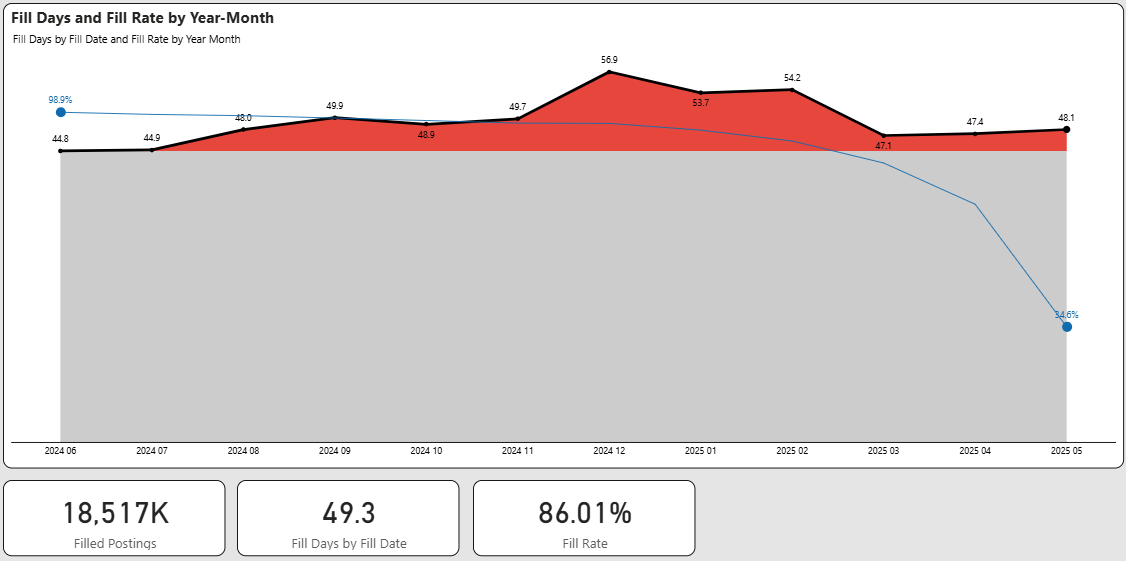
Fill days as a composite rebounded back to 49.3 days from 45.0 days last month. The composite has held fairly steady in a tight range between 45 and 50 days. The percentage of ads filled during that timeframe increased from 84% to 86% indicating good market movement.
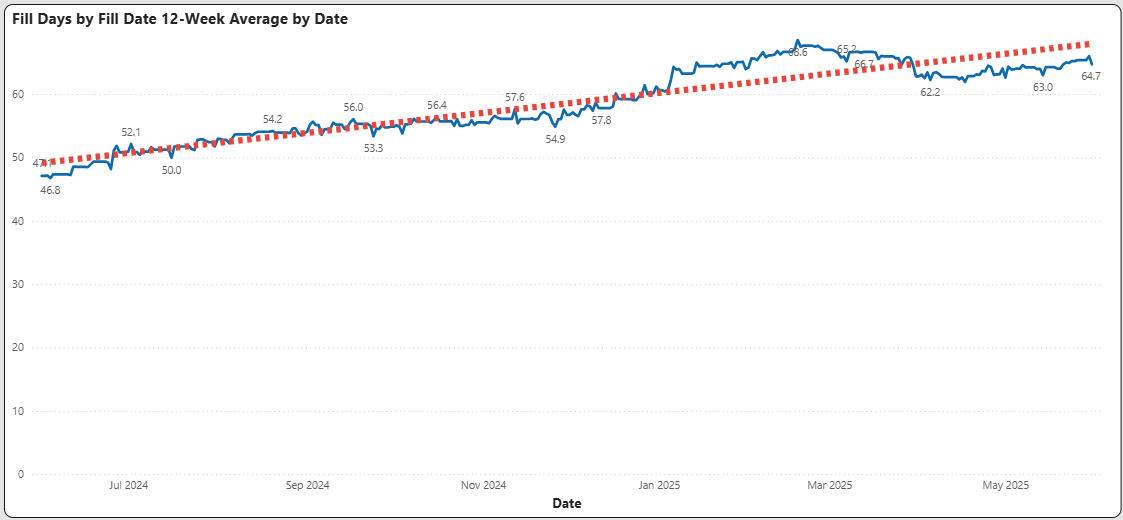
If we pull back the lens a little further, we can see fill days increasing by using a 12-week moving average rather than specific posting and fill dates. The trend line while gradual does show increasing fill days since mid last year.
Open Days Holds Steady
Open days are postings that are still determined to be open. We track every job posting uniquely and ascertain its fill status on a weekly basis. Generally, we have found that twelve months to be a suitable time horizon to evaluate the age of open days. Older postings may distort the open days as they may represent “evergreen” postings. For this reason we eliminate implied evergreen ads that are older than one year.
The graph below shows the aging of open postings for the past twelve months. This value has held fairly steady, ranging from 64 to 67 days. The current number of open postings reflected in the graph is 3.0 million. The composite aging of open postings is 65.1 days representing 14% of all postings during this period. The blue line shows the percentage of ads for that month that are still open.
As indicated in the previous section, the percentage of ads that are open is the most concerning as it dropped two percentage points when compared to last month (16 to 14%).

Compensation
Compensation Composite Relatively Unchanged
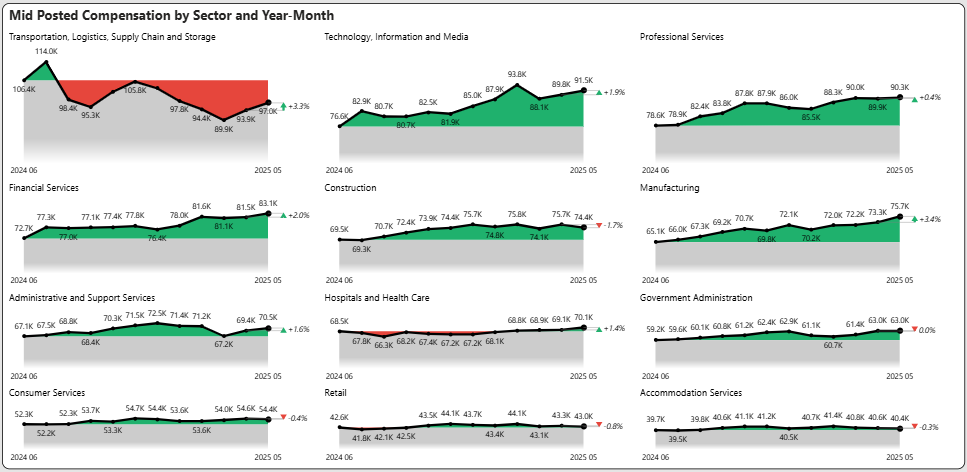
Mid-posted compensation slightly increased .5% in May to $67,000 on a composite basis across all job postings. Compensation by and large has remained flat since November 2024. The range of pay between max and min as a percentage of the midpoint remained steady at 25.5%. However this number is higher than a year ago at 23.6%. This suggests that employers are giving themselves more negotiating room for advertised compensation.

Compensation by Industry Sector
Supply and Demand
Resumes Increased in May, But it’s Still a Passive Job Seeker Market
The number of unique resumes that were published on the Indeed platform increased 15.3% in May, which is a rebound from the 35% drop in April. However, the number of unique resumes published during the trailing nine months (a measure of current job seeker interest) declined from 29.8 million to 28.1 million. Individuals are holding onto jobs and are not as active in job seeking.

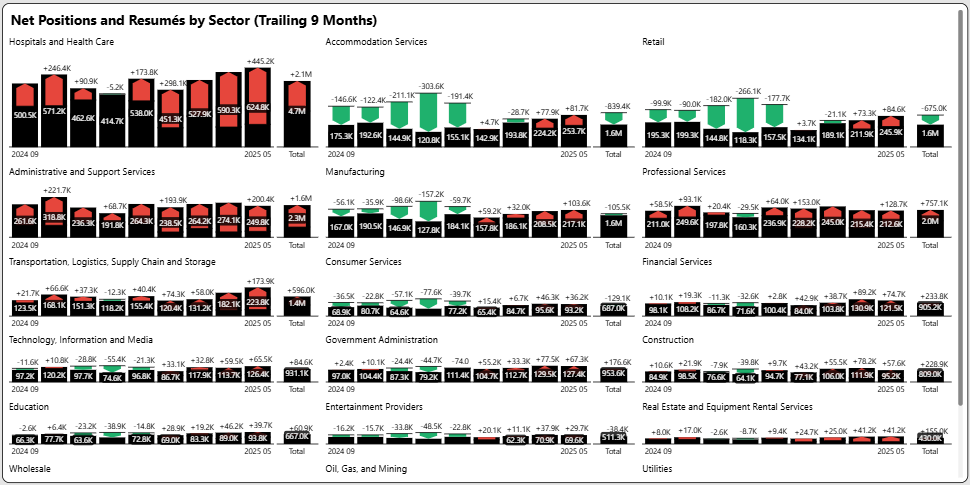
Supply/Demand Imbalances Tilt Towards Demand
To highlight supply/demand imbalances, we superimpose job seekers based on resumés against net job positions (hires based on unique postings) in black bar. The graphs highlight supply surplus (more job seekers than net postings) shown in green or supply shortage (less job seekers than net postings) shown in red. We picked a time period of nine months, which highlights the current market surplus or shortage. The total bar reflects the summaries of openings and resumés for that time period.
Supply/Demand Scorecard
We highlight the current state at the end of May as well as the most recent changes over the last nine months. A change is not necessarily good or bad, but we have highlighted changes in supply/demand gaps that significantly impact the current trends.
Many sectors have tilted towards demand heavy. The movement below highlights movement toward unmet demand in blue vs. movement towards oversupply in green. Professional Services, Construction, and Financial Services have all progressed towards increasing unmet demand. Manufacturing has progressed from an oversupply position to parity.
| Sector | Current State | Previous State |
| Hospitals and Health Care | Heavy Unmet Demand | Heavy Unmet Demand |
| Accommodation Services | Moderate Oversupply | Moderate Oversupply |
| Retail | Moderate Oversupply | Moderate Oversupply |
| Professional Services | Moderate Unmet Demand | Slight Unmet Demand |
| Manufacturing | Parity | Slight Oversupply |
| Transportation, Logistics, … | Heavy Unmet Demand | Heavy Unmet Demand |
| Construction | Moderate Unmet Demand | Slight Unmet Demand |
| Technology, Information, … | Parity | Parity |
| Financial Services | Moderate Unmet Demand | Slight Unmet Demand |
| Education | Parity | Parity |
| Consumer Services | Moderate Oversupply | Moderate Oversupply |
| Entertainment Providers | Parity | Parity |
| Wholesale | Parity | Parity |
| Administrative and Support Services | Heavy Unmet Demand | Heavy Unmet Demand |
Worker Sentiment
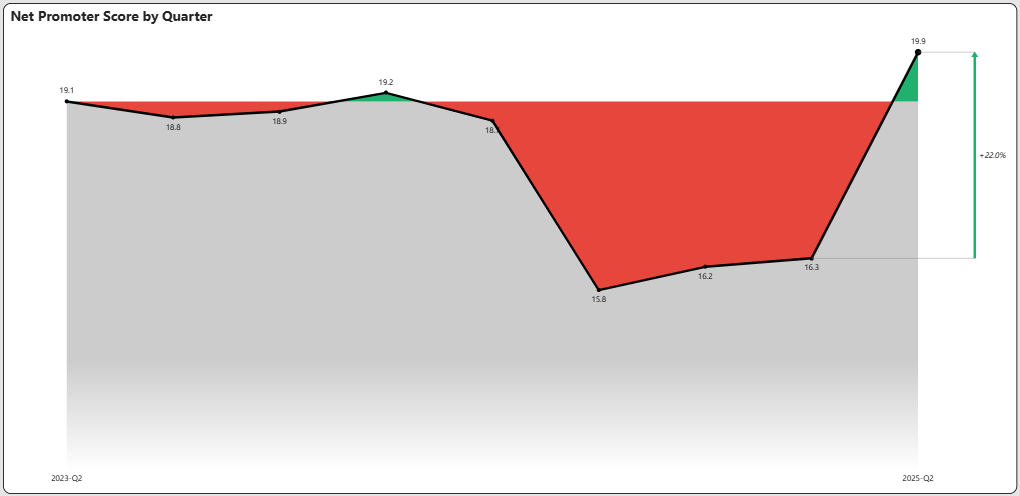
Net Promoter Score Continues Improvement
We have been harping about Net Promoter Score (NPS) for many months, but May continues a solid trend of improvement. The graph below is the NPS by quarter since 2023 and it is now at the highest level since that point.
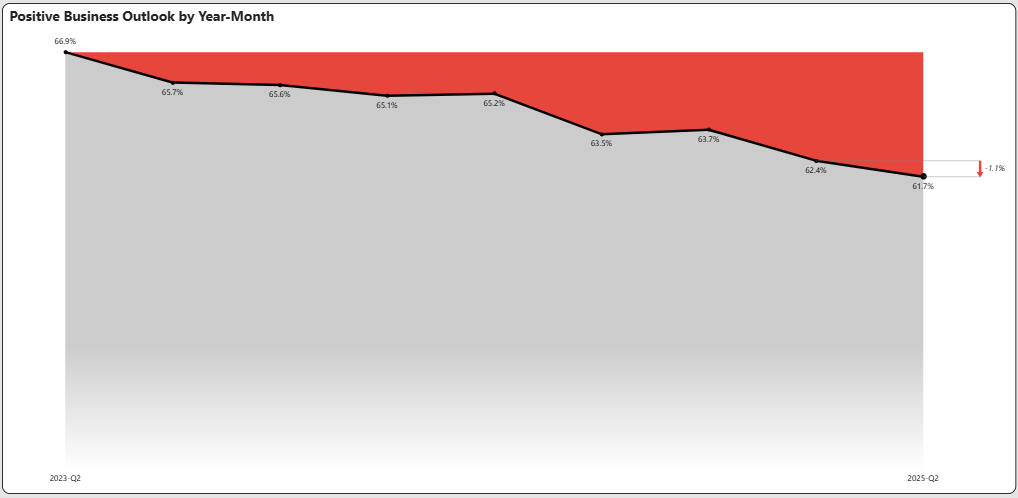
Business Outlook
On the flip side, Positive Business Outlook (shown below) declined again to the lowest point since June 2023. This may be more of a reflection of the overall business climate than specific issues with companies.
Labor Market
Key Labor Market Takeaways From April
Get More Insights!
Try Our Free Version of TalentView to Get Instant Compensation, Postings, and Fill Days Insights By Title, Company and Location (No Sign Up Required)

How Would Your Company, Competitors, Industry and Job Titles Compare?
Wouldn’t you want these insights for your industry, job titles, locations and to compare against competitors?
What is TalentView?
Public Insight develops TalentView, a talent market intelligence solution that generated these insights. The most current and detailed insights are available by title, employer, location, industry and more. We provide flexible ways to utilize talent market intelligence, which include interactive dashboards, reports, analytics feeds and data integration via API.
How Can Our Must-Have Insights Help You?
- Inform/Justify Recruiting Decisions and Prepare For Hiring Manager Discussions
- Inform Recruitment Marketing Budgets, Strategies and Priorities
- Benchmark Employers Against Competitors
- Enhance Your Solution Offering (Solution Providers)
- Identify Business Development Opportunities (Solution Providers)
- Develop Content for Account Management and Marketing (Solution Providers)
Get Started!
Schedule a Call – Let’s discuss and demonstrate how you can leverage job/talent market insights
Sign Up for a Trial – Try out our interactive dashboards or get sample data for proof of concept