Consumer ratings are always controversial. You can always ask the wrong question or ask the right question the wrong way. In an attempt to shed transparency on our nation’s healthcare system, the Centers for Medicare and Medicaid Services (CMS) instituted the star ratings system. CMS’ star-rating system is meant to help consumers shop for the best hospital experience by identifying facilities with high quality of care and positive outcomes. The agency uses 62 quality measurements to rate hospitals on a five-star system.
As with any ratings system, it sets up winners and losers. The recent CMS delay announcement was specifically to address survey design flaws against teaching hospitals that treat patients from the lower end of the socioeconomic scale, as well as patients requiring more complicated procedures.
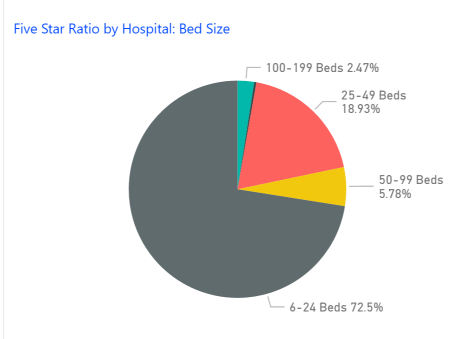
We used Public Insight OmniView to take a quick look at the 118 hospitals that consistently earned five stars as an overall rating for the trailing four quarter periods. These 118 represent only 3.3% of the 3564 hospitals with ratings. A number of things stand out in this standout list:
-
These hospitals are very small with an average of only 40 beds compared to 200 beds for the complete list. The largest hospital in the five-star group only has 324 beds.
-
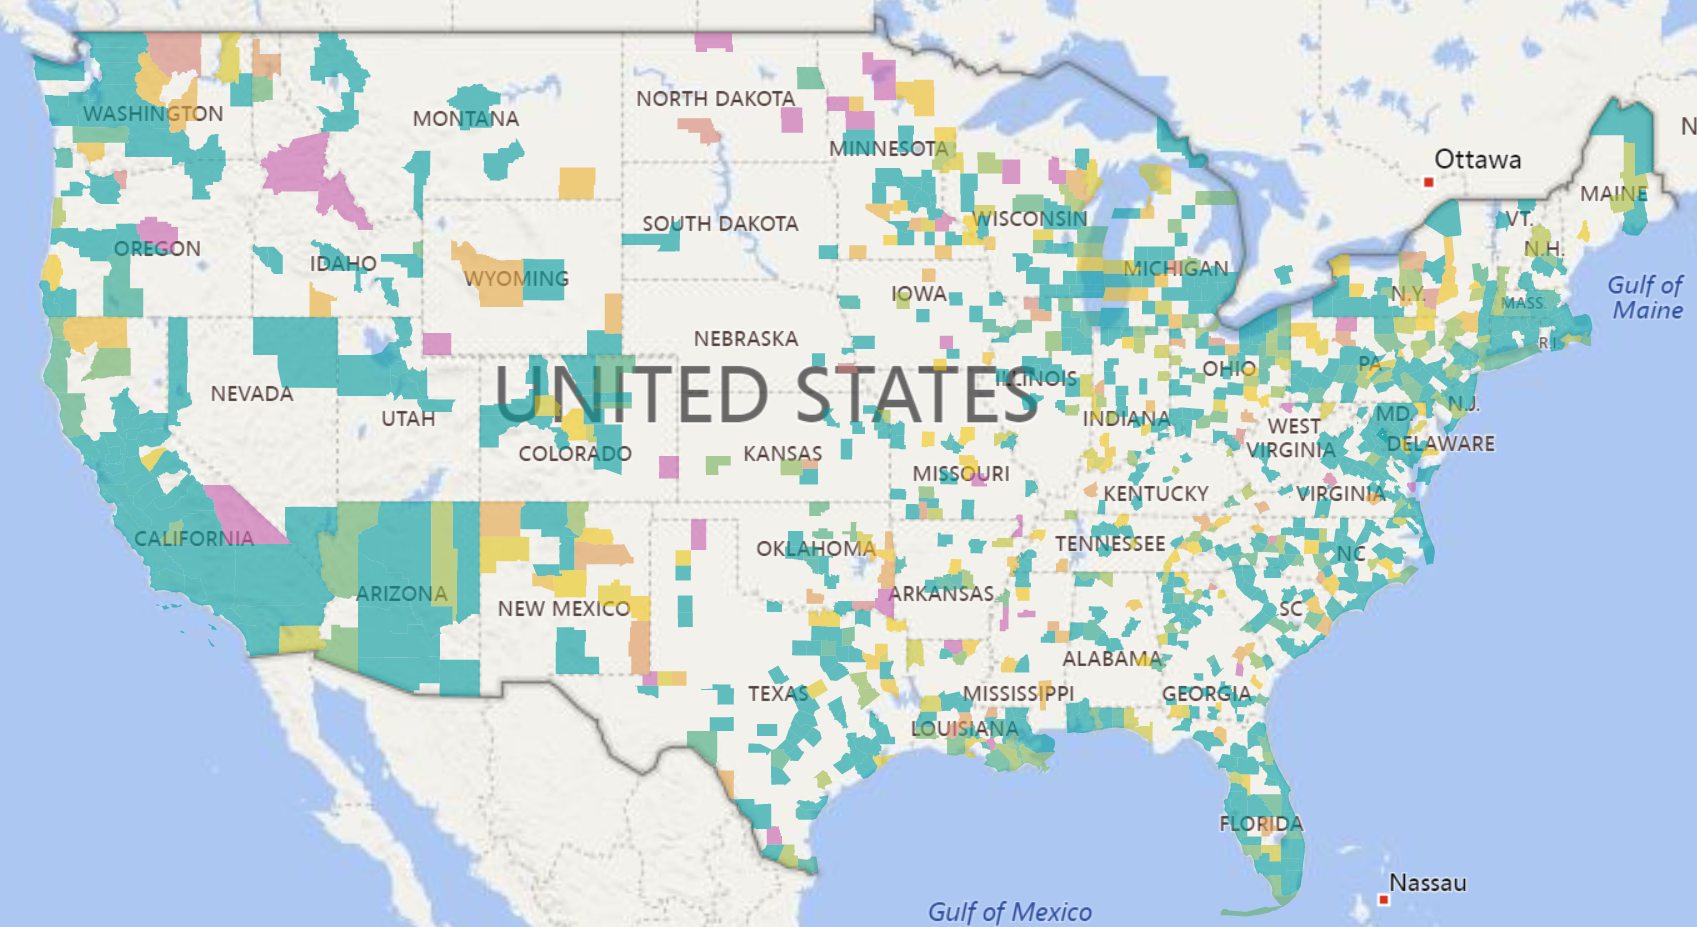
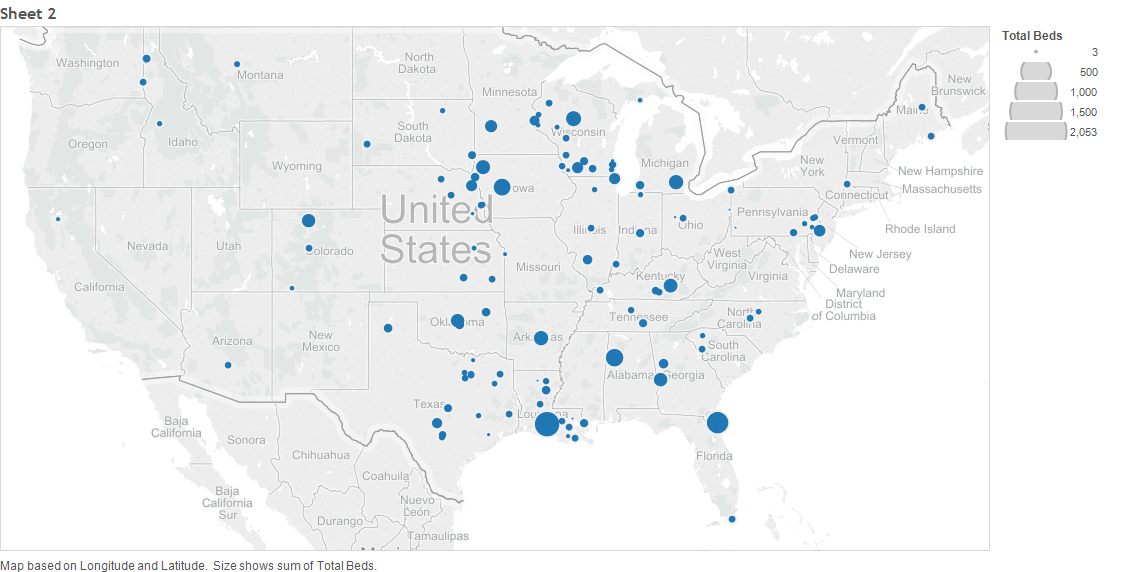
Geographically these hospitals are centered in the Midwest and not in urban areas which is consistent with the concern over design flaws. Only one hospital made the list in the entire state of California and none are in New York City. The following map illustrates the geographic dispersion and bed size.

With thousands of metrics from primary data sources such as the American Hospital Association Annual Survey and Hospital Cost Report Information System (HCRIS) to choose from in OmniView, we can construct virtually any analysis. Our five-star ratings list for example tends to have a newer physical plant. For examples of additional benchmark criteria, see the video blog below:

As with every analysis done in our blog posts, you can conduct the same type of research using Public Insight’s Premium Tools like OmniView. These tools include a 30-day risk-free guarantee. If you don’t like the analysis features of Public Insight, contact us for a full refund. To find out more about Public Insight’s Premium Tools and how they can benefit you and your organization, click HERE.