Students Moving Back on Campus

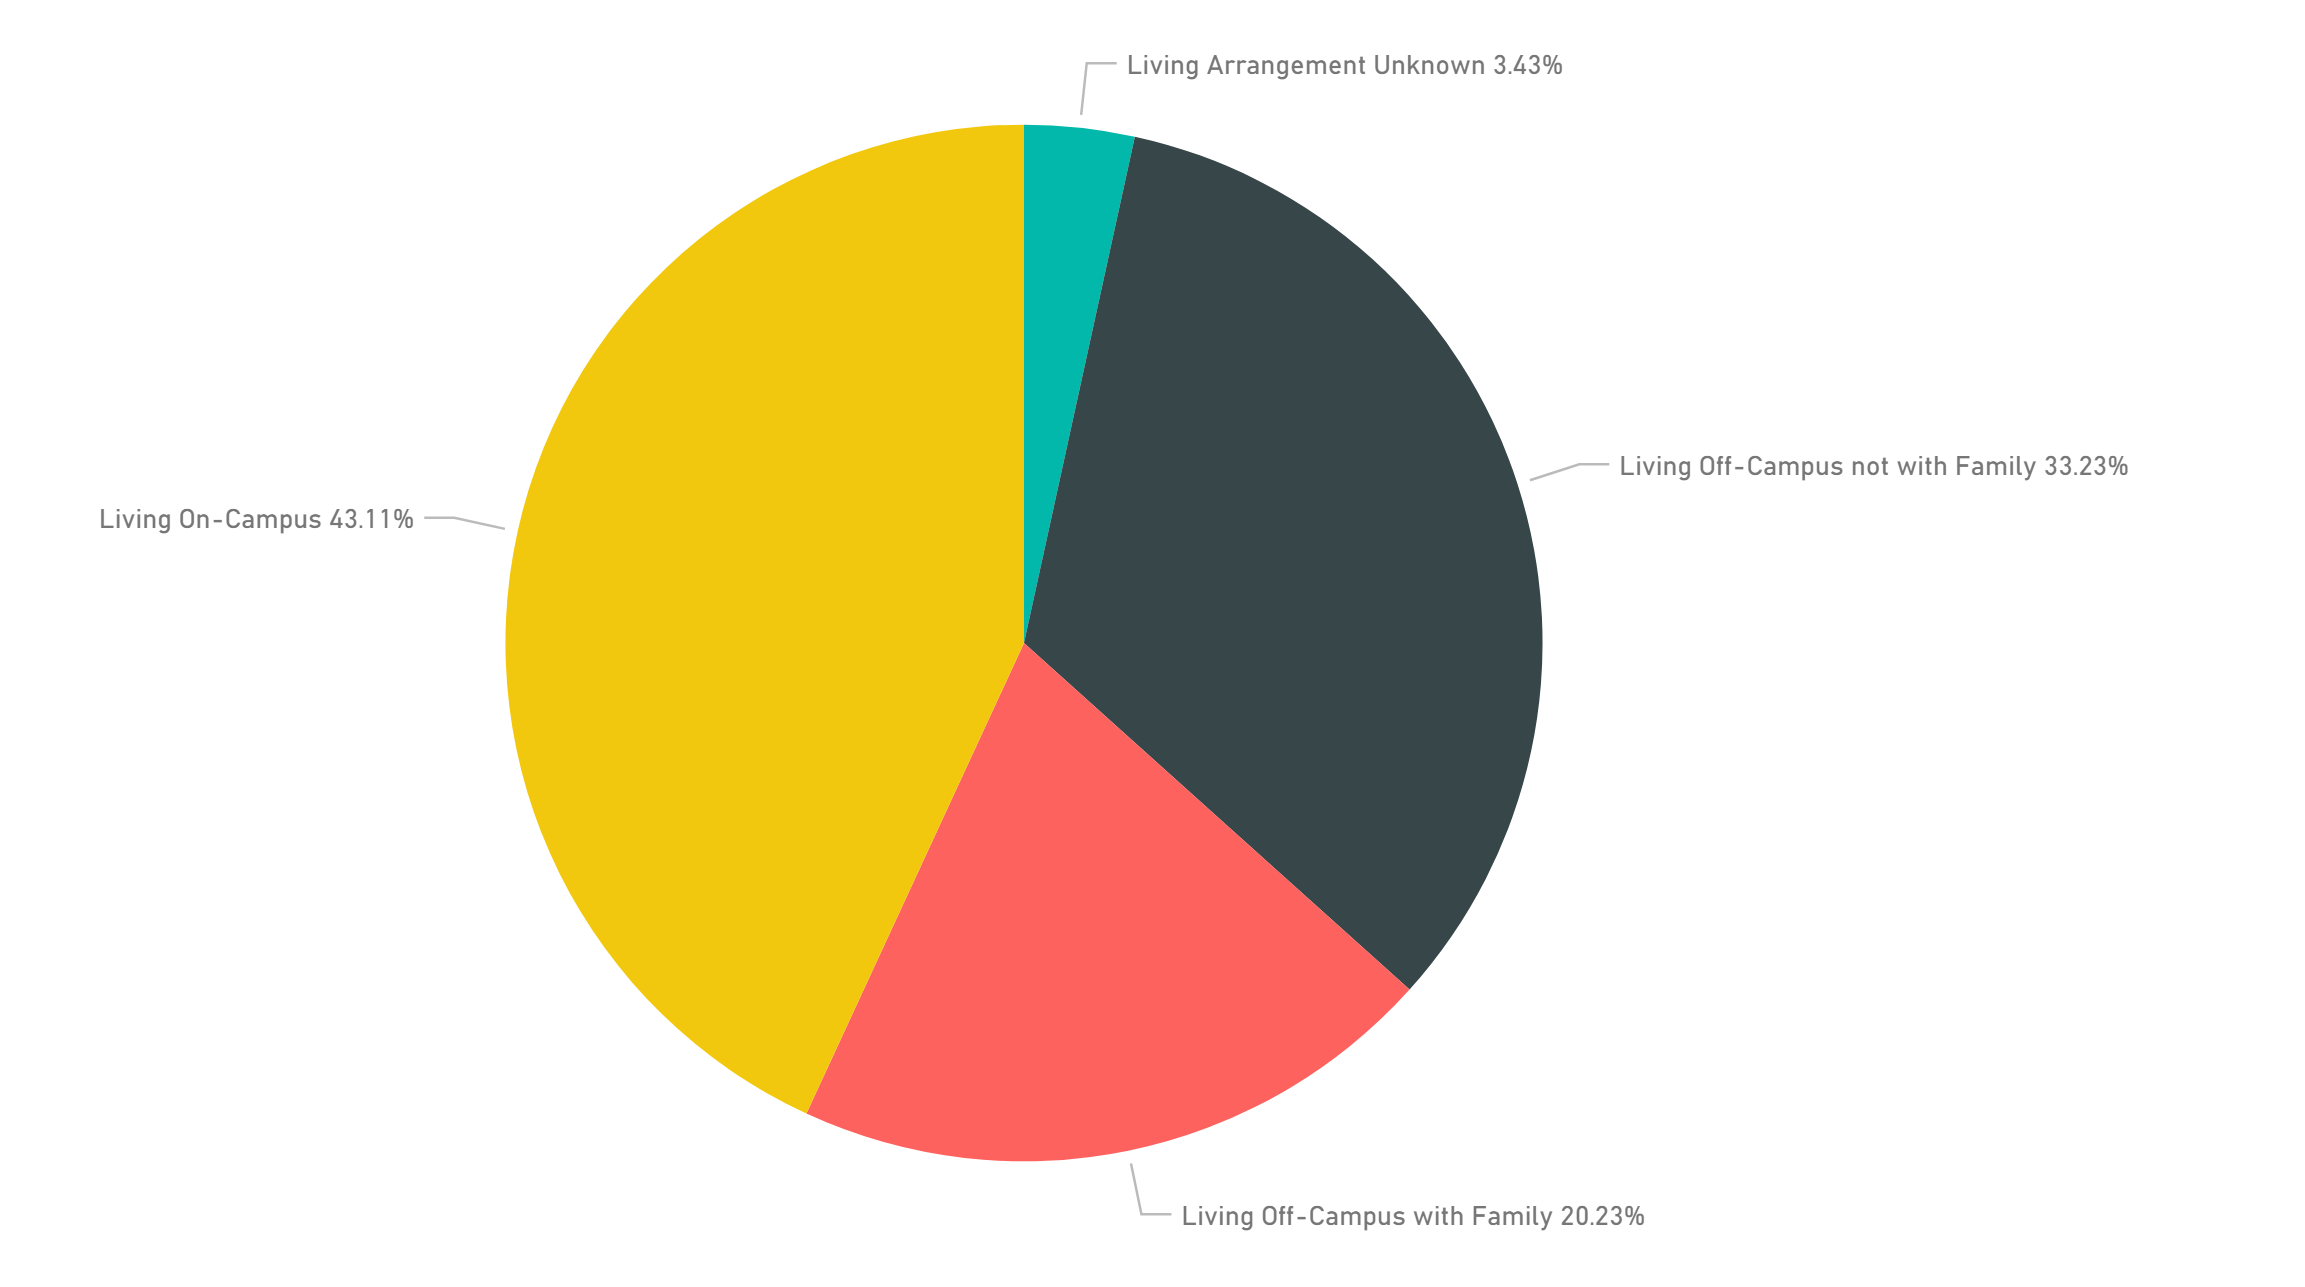
The number of students living on-campus for the approximately 4,500 non-state institutions has increased from just over 43% in 2011 to nearly 53% just four years later in 2015. The pie graph below shows the movement from 2011 to 2015 with the yellow slice indicating the percentage of students living on-campus. 


2011


2015

Initially, I thought it was in keeping with an economic recovery, but the the off campus changes are interesting:

  • Students living off campus with family declined just one percentage point from 20-19%

  • Students living off campus, not with family, declined from 33% to 26%

The costs of living off campus can range widely depending on location. This recent article by Ben Myers suggests high variability in the best guess of off campus living. This just simply might not be a cost savings measure. Perhaps living on campus is simply a cool thing again and the value and benefits of being near the action are driving this change.


Share This Story

Similar Posts

  • Infection Rates and the Long-Term View

    My Cleveland Indians have now won 13 games in a row. That along with their overall record and stellar play over the entire season tells me they are a good team. However, at any given point the Indians or any particular player could play really poorly. The similar challenge with…

  • Breaking Down Net Price, Tuition, and Aid

    Reports by College Board and others have indicated that net price, the true measure of what a student pays to attend college, continues to rise. College Board has maintained that the actual net price has been increasing for six to eight straight years.    Net price is defined as the…

  • The 13 College Scorecard Title IV Outcomes

    Where Students Go Based on the Latest College Scorecard Data In our last post, we provided some insight into the IPEDS Outcome Measures data. The IPEDS Outcome Measures data was designed as a supplement to graduation rate data which has always been questioned as an effective measure for measuring student…

  • The Debt Service Cost of PLUS Loans

    Last week, we observed that the PLUS loan program continues to escalate both in terms of dollars borrowed and in terms of recipients. Using the newly published Financial Aid Interactive, we projected the number of dollars borrowed by PLUS loan borrowers will increase 1.25 billion for the year ending June,…

  • Regional Variations in Opioid Prescribing Rates

    Given the state of the opioid crisis, any meaningful data is valuable. So when CMS released three years of Opioid Part D prescription data in November, we all rejoiced. CMS also released a mapping tool to analyze the data. While mapping tools can be effective, they can also get in…