Hot Growth Industries

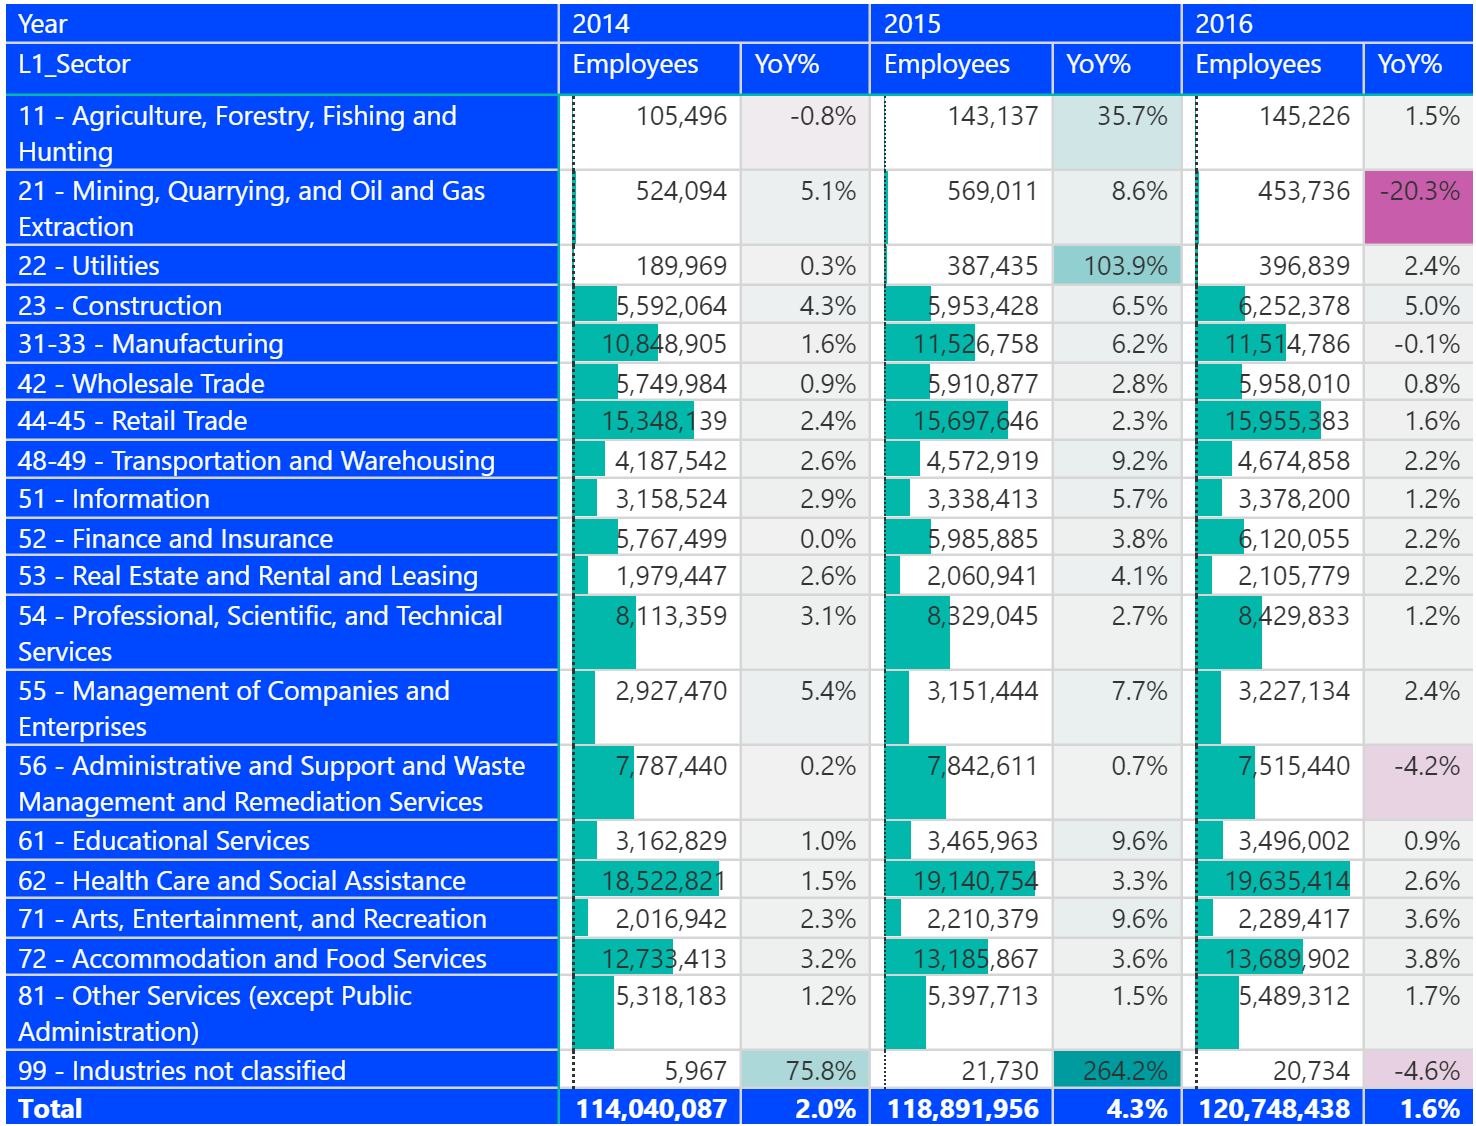
The building boom is officially back after a long hiatus. The number of construction employees increased 5% in 2016 according to the most recent County Business Patterns released by the U.S. Census.  The sector however with the most number of new establishments is the Information sector (NAICS 51) which increased 5%. This sector may be flattening out though as the number of employees only increased 1.2% and payroll only increased 1.5%. Information industries include telecommunications and hosting services possibly indicating a rapid growth in new entrants to this emerging area. The fastest growing sectors by number of employees over the trailing three years is summarized in the table below.


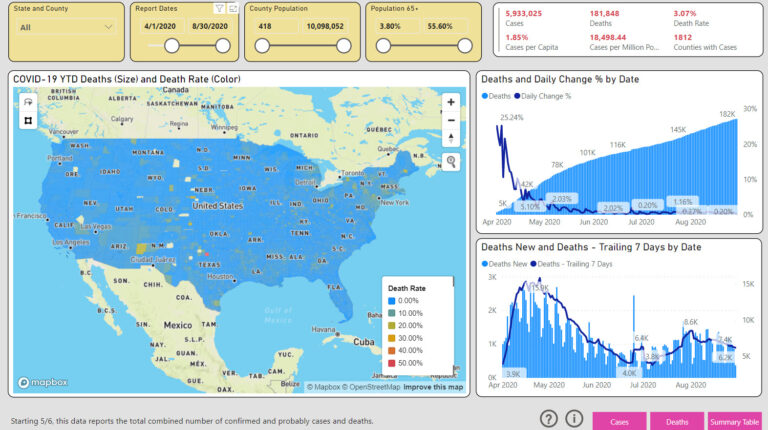
The business patterns data shows regional concentrations by county and zip code. For example, the health sector as a whole is fairly geographically diverse but within particular subsectors (nursing care for example), there are pockets of regional concentration. 


We have updated the Business Patterns Interactive to include the latest data from the County Business Patterns data for 2016. The Business Patterns Interactive provides industry analysis at a county level using U.S. Economic Census data over a 5 year period for over 3,000 counties. The Interactive easily identifies industry growth for over 1,000 industries at regional and state level. This Interactive is a powerful support tool for institutional and program planning, and regional economic development. This update is automatically available to our subscribers. You can purchase this as an individual Interactive for $295 or as part of the Higher Education Institution library.


Share This Story

Similar Posts

  • Students Increasingly Opting for High Cost Debt

    Many prognosticators are projecting a coming economic crisis caused by student debt. This is typically focused around an inability to pay off the principal of the loan. But it really appears that we are also setting ourselves up for a real problem with the cost of debt.    Overall new…

  • Visualizing Student Debt and Earnings

    Leveraging Scatterplots to Analyze the New College Scorecard Data There has always been a symbiotic relationship between student debt and student earnings. As student debt has creeped up in recent years, there has also been a data gap with post-graduation earnings. The most recent College Scorecard data is a first…

  • On Faculty Compensation and Gender Disparity

    It will take many years for the faculty gender pay gap to close at the current rate of change. From 2014 to 2015, women received around half a percent higher pay increase from men over the various institutional sectors. There is still a 16% and 14% gender pay gap for full professors…

  • The Race for Nurses

    There is a race that is brewing between millenials who are becoming registered nurses and the hiring that has started at U.S. hospitals. A Health Affairs study concluded that Millennials are becoming registered nurses at nearly twice the rate of baby boomers, but that still won’t necessarily prevent a nursing shortage…

  • Violence Against Women Offenses Up 9.5%

    This is the third year that the Campus Safety and Security (CSS) data has released separate violence against women (VAW) offenses. This data captures three types of offenses; domestic violence, dating violence, and stalking and analyzes it for both on campus and off campus locations. Overall, there were 16,183 VAW…

  • COVID-19 Dashboard with NYT Data

    Analyze COVID-19 Cases by National, State and County Level It is important for today’s business leaders to consider the impact of COVID-19 when making decisions and allocating resources. The accuracy of COVID-19 data reported by news sources and online publications goes beyond the numbers themselves, the interpretation of the statistics…