Free-Lance Economy Continues Upward Climb

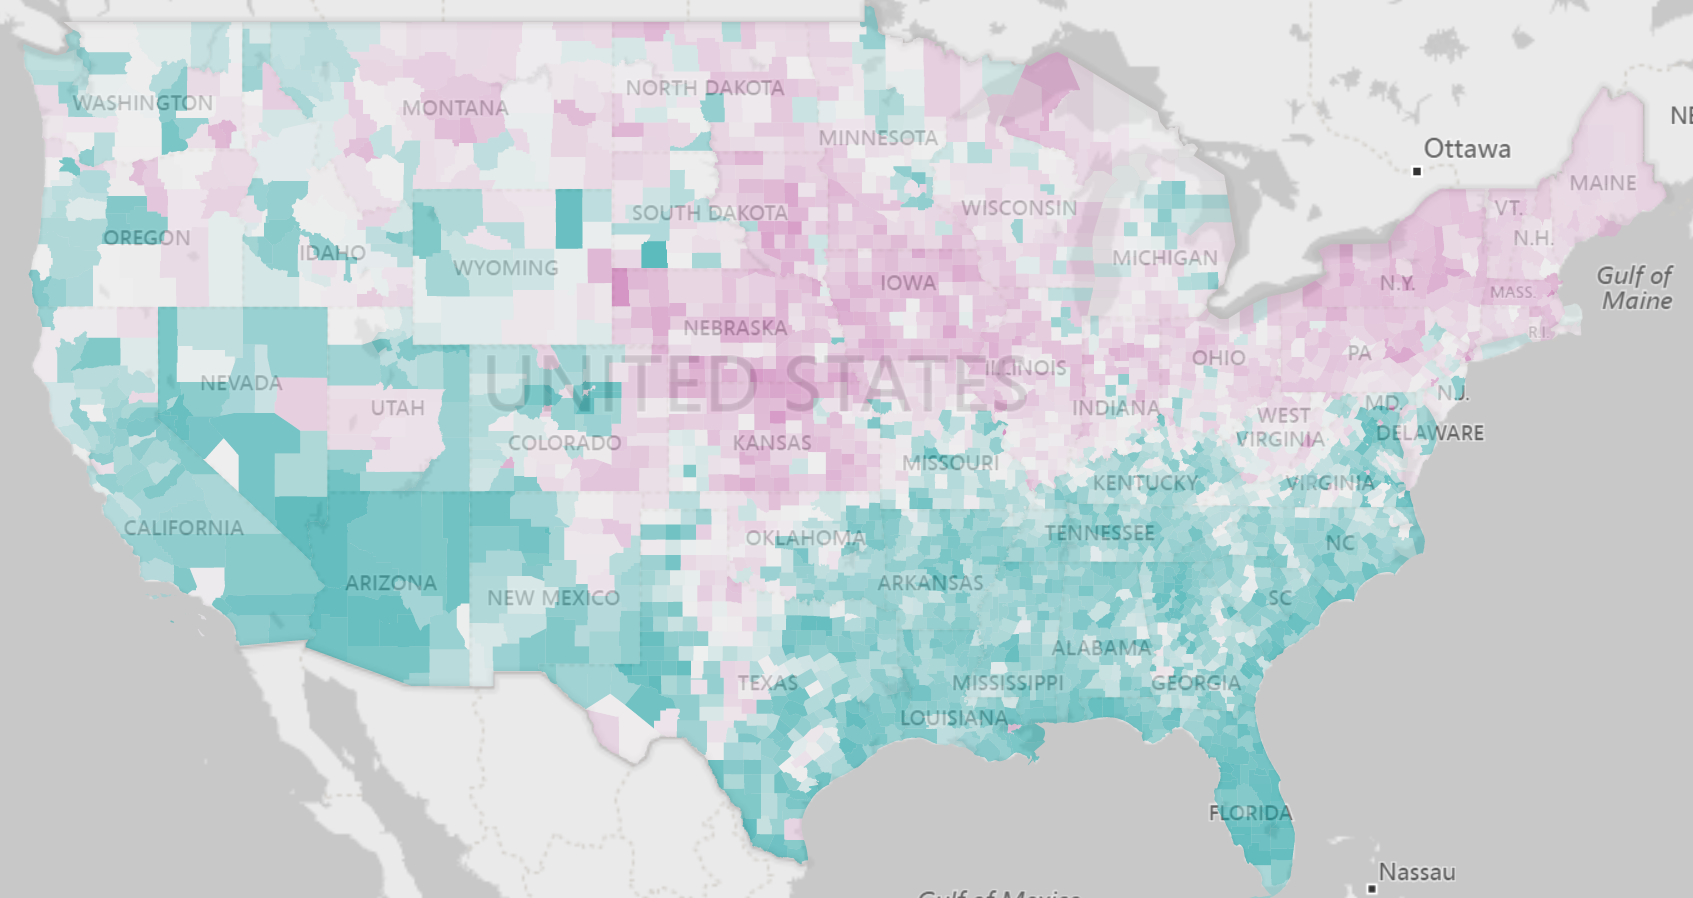
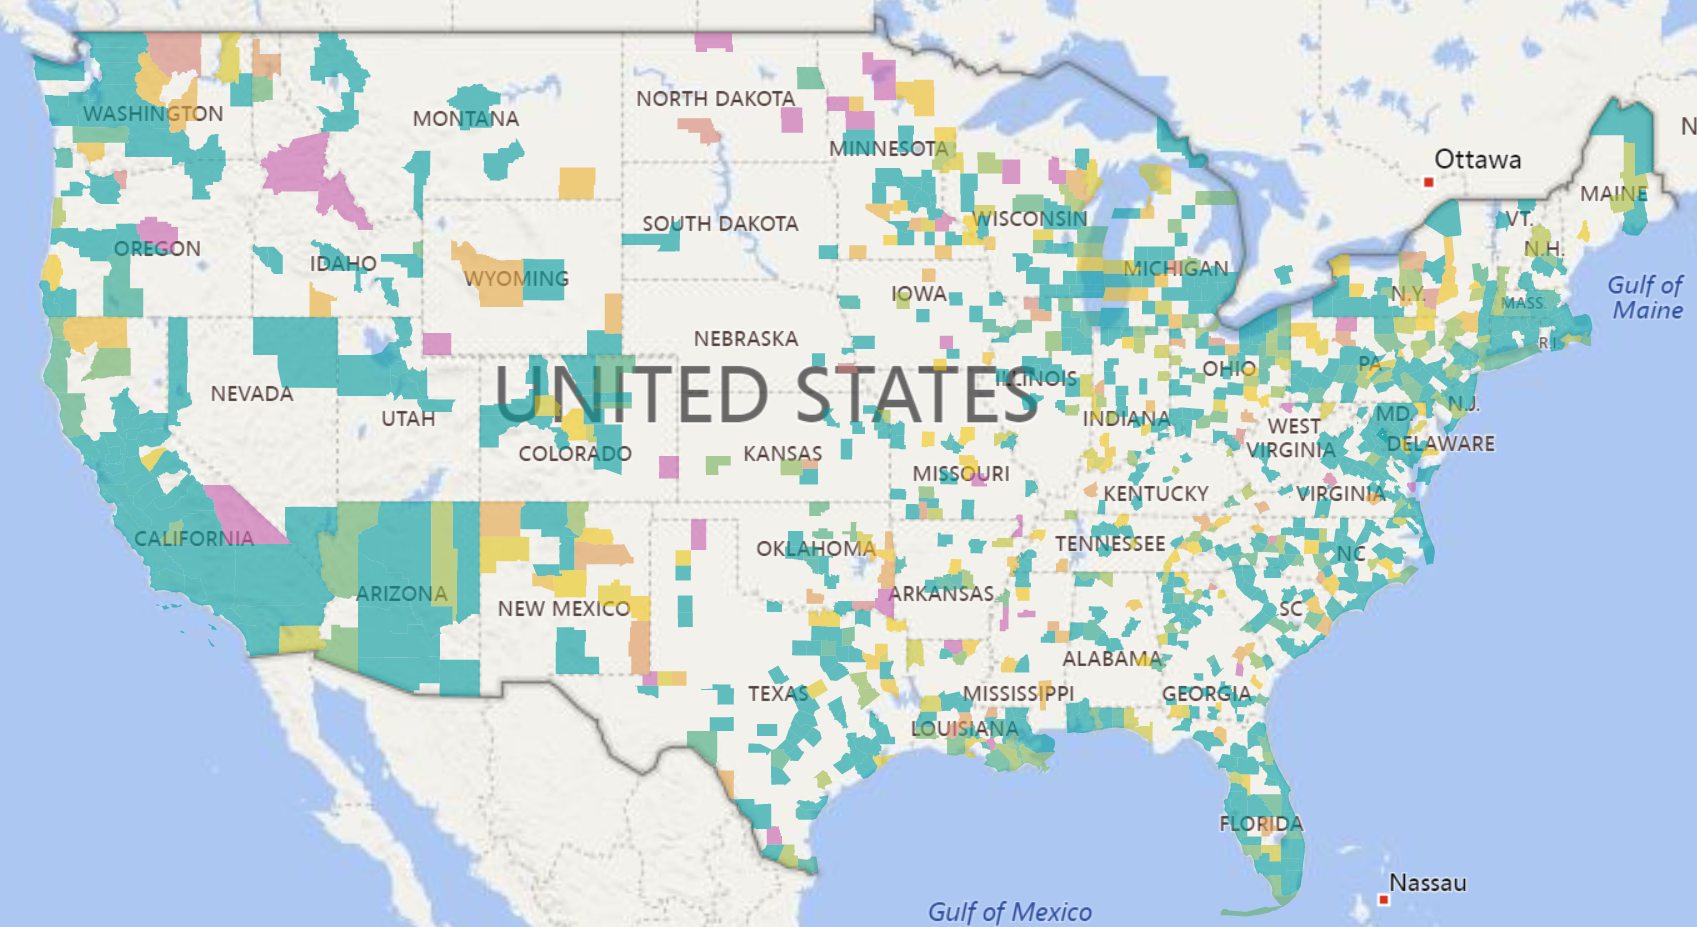
Moonlighting used to be a term that described a minority of people. If you moonlighted, you were supplementing your income. You either did it for extra cash or because you had to just to pay the bills. The freelance economy and the growth of the personal transportation industry alone have made many of us moonlighters and freelancers according to the latest Nonemployer Statistics released last month by U.S. Census.Gross receipts for transportation industries with NAICS codes of 4853 and 4859 have increased over 86% over the past four years. In spite of the economic boom we are in and low unemployment, these industries continued to show over 20% growth in gross business receipts from 2015 to 2016. The counties shown below in blue have receipts growth over four years of above 50% in these industries.


The Census defines a nonemployer business as one that has no paid employees, has annual business receipts of $1,000 or more ($1 or more in the construction industries), and is subject to federal income taxes. Most nonemployers are self-employed individuals operating very small unincorporated businesses, which may or may not be the owner’s principal source of income. Nonemployer statistics originate from Internal Revenue Service tax return information. This data is the companion to the County Business Patterns which covers employer businesses. In addition to the boom in the transportation industries, there has been steady upward growth in healthcare support and educational services. Interestingly, construction freelancing has leveled off with meaningful growth in employer payroll.
Share This Story

Similar Posts

  • STEM Enrollment Fields Show Strong Growth

    The IPEDS Enrollment by Major Fields of Study is collected every other year and 2016 is a new reported year. IPEDS collects nine major fields of study and the enrollment is disaggregated by attendance status (full-time, part-time), level (undergraduate, graduate), race, and gender.   There are numerous ways to breakdown…

  • Students Moving Back on Campus

    The number of students living on-campus for the approximately 4,500 non-state institutions has increased from just over 43% in 2011 to nearly 53% just four years later in 2015. The pie graph below shows the movement from 2011 to 2015 with the yellow slice indicating the percentage of students living…

  • Is Bureau of Labor Statistics Data Adequate?

    Several weeks ago, the Bureau of Labor Statistics (BLS) released updated Occupational Employment Statistics (OES) survey data. BLS OES is one of those foundational programs and datasets that are used for comprehensive occupational analysis. It produces employment and wage compensation estimates annually for nearly 800 occupations. These estimates are available…

  • Has Distance Education Hit Its Peak?

    Programs offered through distance education or what we might conventionally refer to as online programs actually declined as a percentage of all programs from 10.8% to 10.5% in 2017 and 2016 respectively. This was the first time that distance education has actually declined since this data started being collected by…

  • As the Economy Grows, So Does Poverty

    There is a general perception that a rising economy raises all economic boats. But poverty rates would indicate that the poorest of the poor just seem to get poorer. Many counties have actually experienced a rise in poverty rates from 2012 to 2016. We took a quick look at the…