Will Voter Unpredictability Continue in 2018?

Much has been written about the increased polarization of America and its collective impact on communities. There were many surprises in the 2016 election and people are bracing for a potentially tumultuous 2018 mid-term election. Ohio, where I live, is one of the swing states. The average county in Ohio changed nearly 8% (based on election over election % change) in the 2016 presidential election to Republican but this is a reversal of the 8% movement towards Democrat in the 2008 election. Are voters fickle or are traditional parties becoming less dominant?


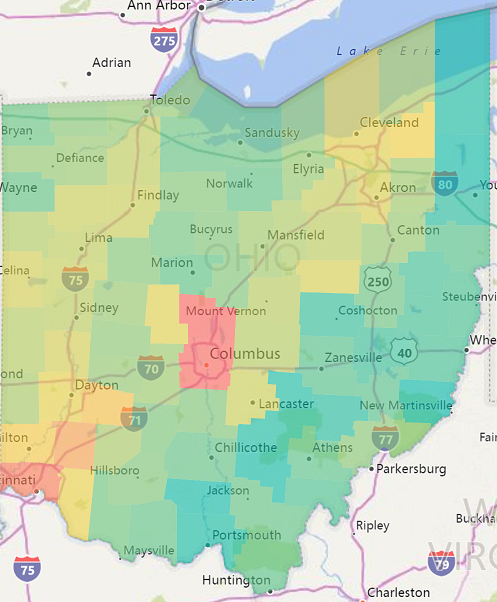
The map below shows the movement from Democrat to Republican (shift is in blue) from 2012 to 2016. No big surprise there, but the map following shows the same movement from Democrat to Republican (shift is in red) from 2004 to 2008; in essence the big reversal. Some counties stayed and moved within their dominant party (e.g. Franklin County), but most simply swung heavily from one party to the other.


2016 Election


2008 Election


So what does that have to do with communities? Voter data is increasingly in the conversation when it comes to community health, planning, and economic development. We are pleased to announce the immediate availability of the Leip Atlas of U.S. Presidential Elections data through the Public Insight On-Demand Data Service. Dave Leip has been a leading authority on election results since 1992 and is frequently cited in many healthy communities analyses. The data includes president, governor, house, and senate election results as well as voter registrations and, where available, voter participation. You can download this data at a state or county level.   

Share This Story

Similar Posts

  • Income Inequality Marches On

    Welcome to 2018!  We are making some fundamental shifts to our Weekly Insights which I hope you will enjoy.  We are moving our content towards more video and free self-service analysis around our weekly topical theme. We welcome your feedback and your ideas.    Over 70% of population health is…

  • Distance Learning Growth Continues

    In one of my favorite videos of my kid’s era, Grover from Sesame Street taught us the difference between near and far. I don’t think Grover had in mind today’s high tech tools and social media interaction when he taught us this principle. Distance Education continues to be a hot…

  • March 2020 Job Postings Signals Seismic Labor Shifts

    New Labor Market Analysis Application Released by Public Insight The COVID-19 reality is starting to reflect itself in the labor market. Volatility in the labor market will be the new normal for the foreseeable future. We analyzed and coded over 2 million active job postings as of past Saturday, March…

  • FAFSA Application Volume Down 11%

    The FAFSA Application Volume declined nearly 11% for the application cycles from June 30, 2014 through June 30, 2017 based on data from Federal Student Aid and analyzed using the Financial Aid Interactive. FAFSA application cycles are based on an 18-month period for any one particular school year.  Note the…

  • Regional Variations in Opioid Prescribing Rates

    Given the state of the opioid crisis, any meaningful data is valuable. So when CMS released three years of Opioid Part D prescription data in November, we all rejoiced. CMS also released a mapping tool to analyze the data. While mapping tools can be effective, they can also get in…