Student Earnings Experience a Sluggish Recovery

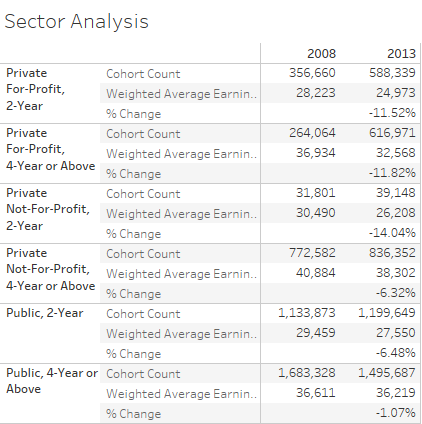
College students are earning 8% less in 2013 than in 2008 per the most recent data published by the US Department of Education College Scorecard database. Students earned $31,382 in 2013 compared to $34,119 in 2008. The earnings were ostensibly flat from 2012 earnings of $31,528.


The College Scorecard database was established last year to encourage competitive evaluation of institutions. The earning data were the first attempt at integrating earnings data from the Treasury data against the specific institution attended. It links the student social security number per tax filings to the FAFSA form. Thus, only students applying for some form of financial aid are included in the earnings calculation. This data used in our analysis is based on student’s earnings six years after entry. The Treasury has no visibility into whether those students graduated from those institutions or even how long they were there.


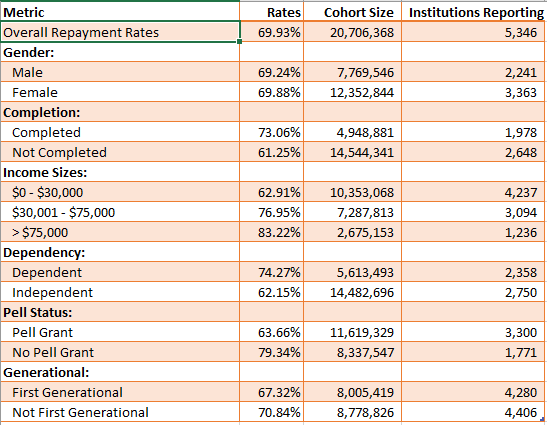
Despite the limitations of this data, it is the first national comparison of earnings data across institutions giving higher education professionals a wide lens look at how students are performing. The College Scorecard database also segments earnings by gender, dependency status, and family income based on these categories on the FAFSA.  You can access a free viz here that gives you institution earnings over the last four reporting years.


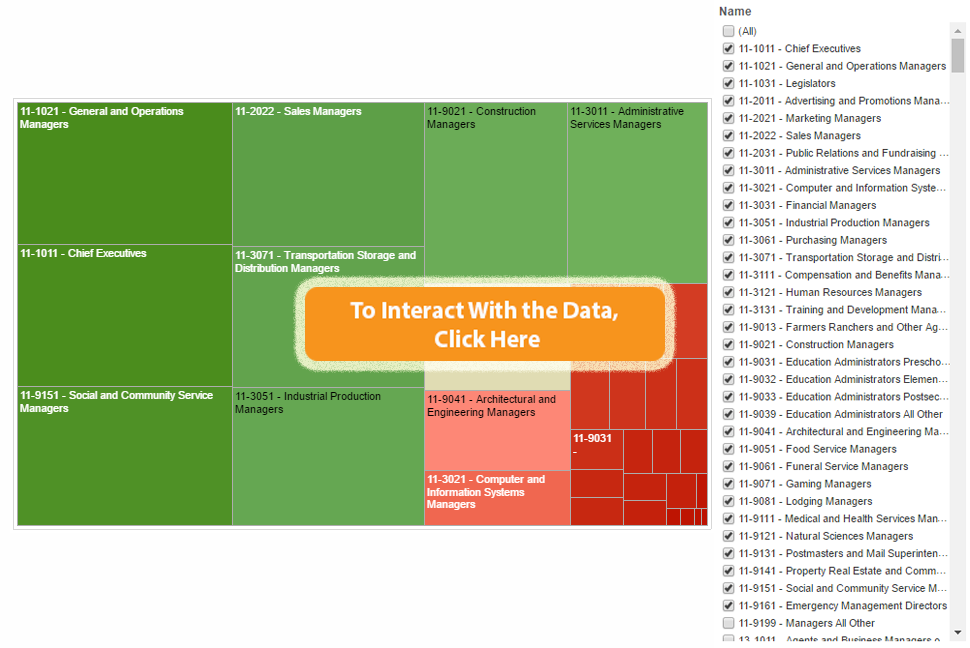
Access Free Viz and Student Earnings Interactive


In analyzing this data, we uncovered some interesting variations by type of institution.  The Public Insight Student Earnings Interactive gives you the ability to define any peer group comparison to see how students compare in and among institutions. For example, comparing institutions by sector, private institutions have experienced less of a recovery than public institutions.  


Share This Story

Similar Posts

  • CMS Releases 2016 Opioid Prescription Data

    This week, CMS released 2016 Opioid Part D Prescribing Rates data which follows on the heels of the original release several months ago. This data release includes Opioid prescriber, claims, and extended release claims at the national, state, county, and zip code level. We have updated our Opioid Prescribing Rates…

  • FAFSA Application Volume Down 11%

    The FAFSA Application Volume declined nearly 11% for the application cycles from June 30, 2014 through June 30, 2017 based on data from Federal Student Aid and analyzed using the Financial Aid Interactive. FAFSA application cycles are based on an 18-month period for any one particular school year.  Note the…

  • Students Moving Back on Campus

    The number of students living on-campus for the approximately 4,500 non-state institutions has increased from just over 43% in 2011 to nearly 53% just four years later in 2015. The pie graph below shows the movement from 2011 to 2015 with the yellow slice indicating the percentage of students living…

  • Is There an Oasis in the New Food Data?

    The recently released updated Food Environment Atlas data by the USDA give us a real glimpse into the progress that we as a nation are making on combating food deserts. The USDA defines food deserts as lack of access to a healthy food retail outlet (a supermarket or large grocery store)…

  • STEM Enrollment Fields Show Strong Growth

    The IPEDS Enrollment by Major Fields of Study is collected every other year and 2016 is a new reported year. IPEDS collects nine major fields of study and the enrollment is disaggregated by attendance status (full-time, part-time), level (undergraduate, graduate), race, and gender.   There are numerous ways to breakdown…

  • The Gender Debt Disparity

    The Huffington Post recently posted a very interesting article on gender debt disparity. The article notes that women hold nearly two-thirds of all student debt – a whopping $833 billion dollars. The article postulates that women also take longer to pay off the debt because they earn less than men….