
Public Insight’s November 2025 Jobs Report summarizes market insights from the millions of job postings, resumé updates and employer ratings/reviews available in our TalentView talent market intelligence platform.
Summary Dashboard
Comparisons of Key Metrics from November to October, September, and August 2025 and to November 2024
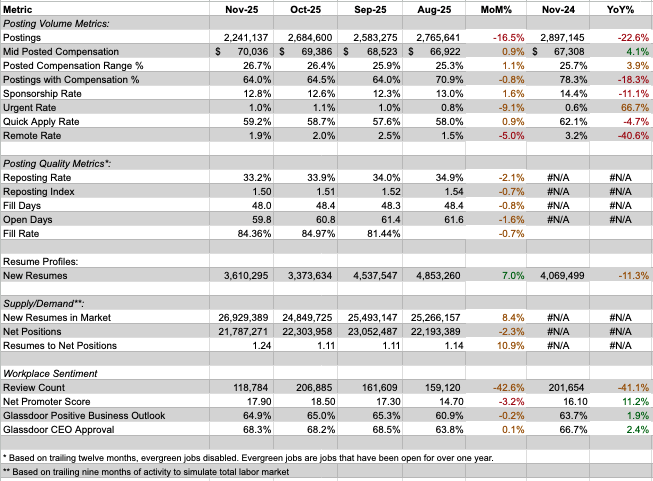
Postings
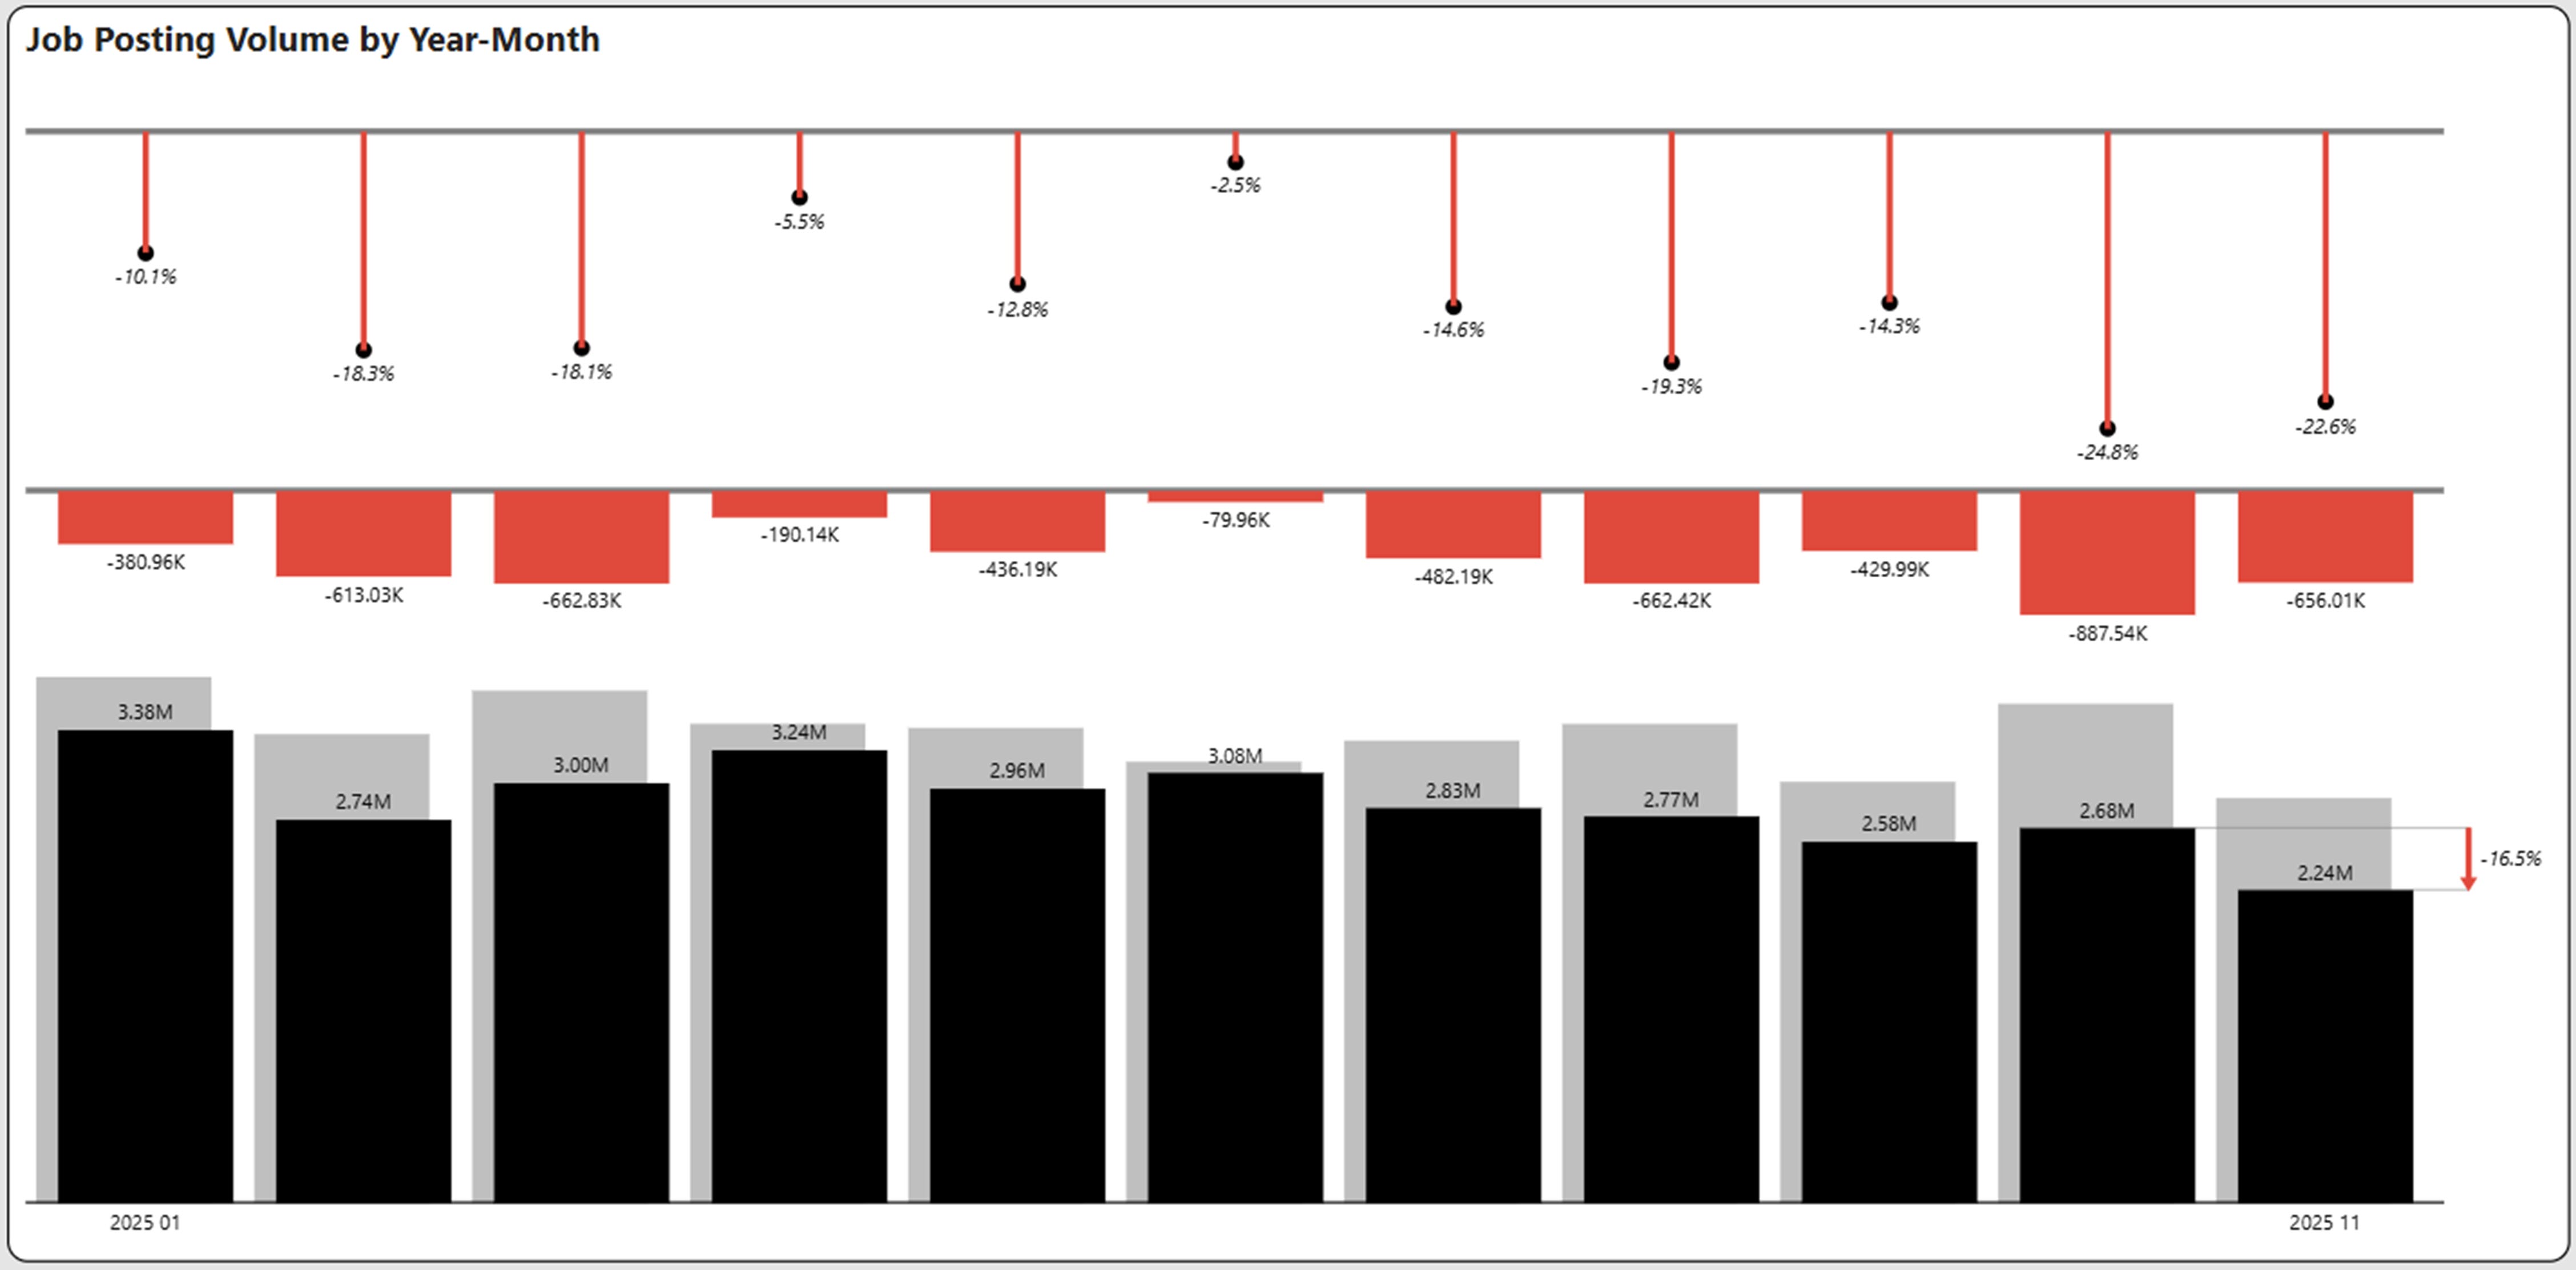
Posting Volume Declines Continue
November job postings declined 22.6% from the same period last year to 2.24 million. As shown below, postings have declined each month in 2025 from the comparative period in 2024. November job posting volume was down sequentially 16.5% from October and represents the lowest monthly posting volume of 2025.
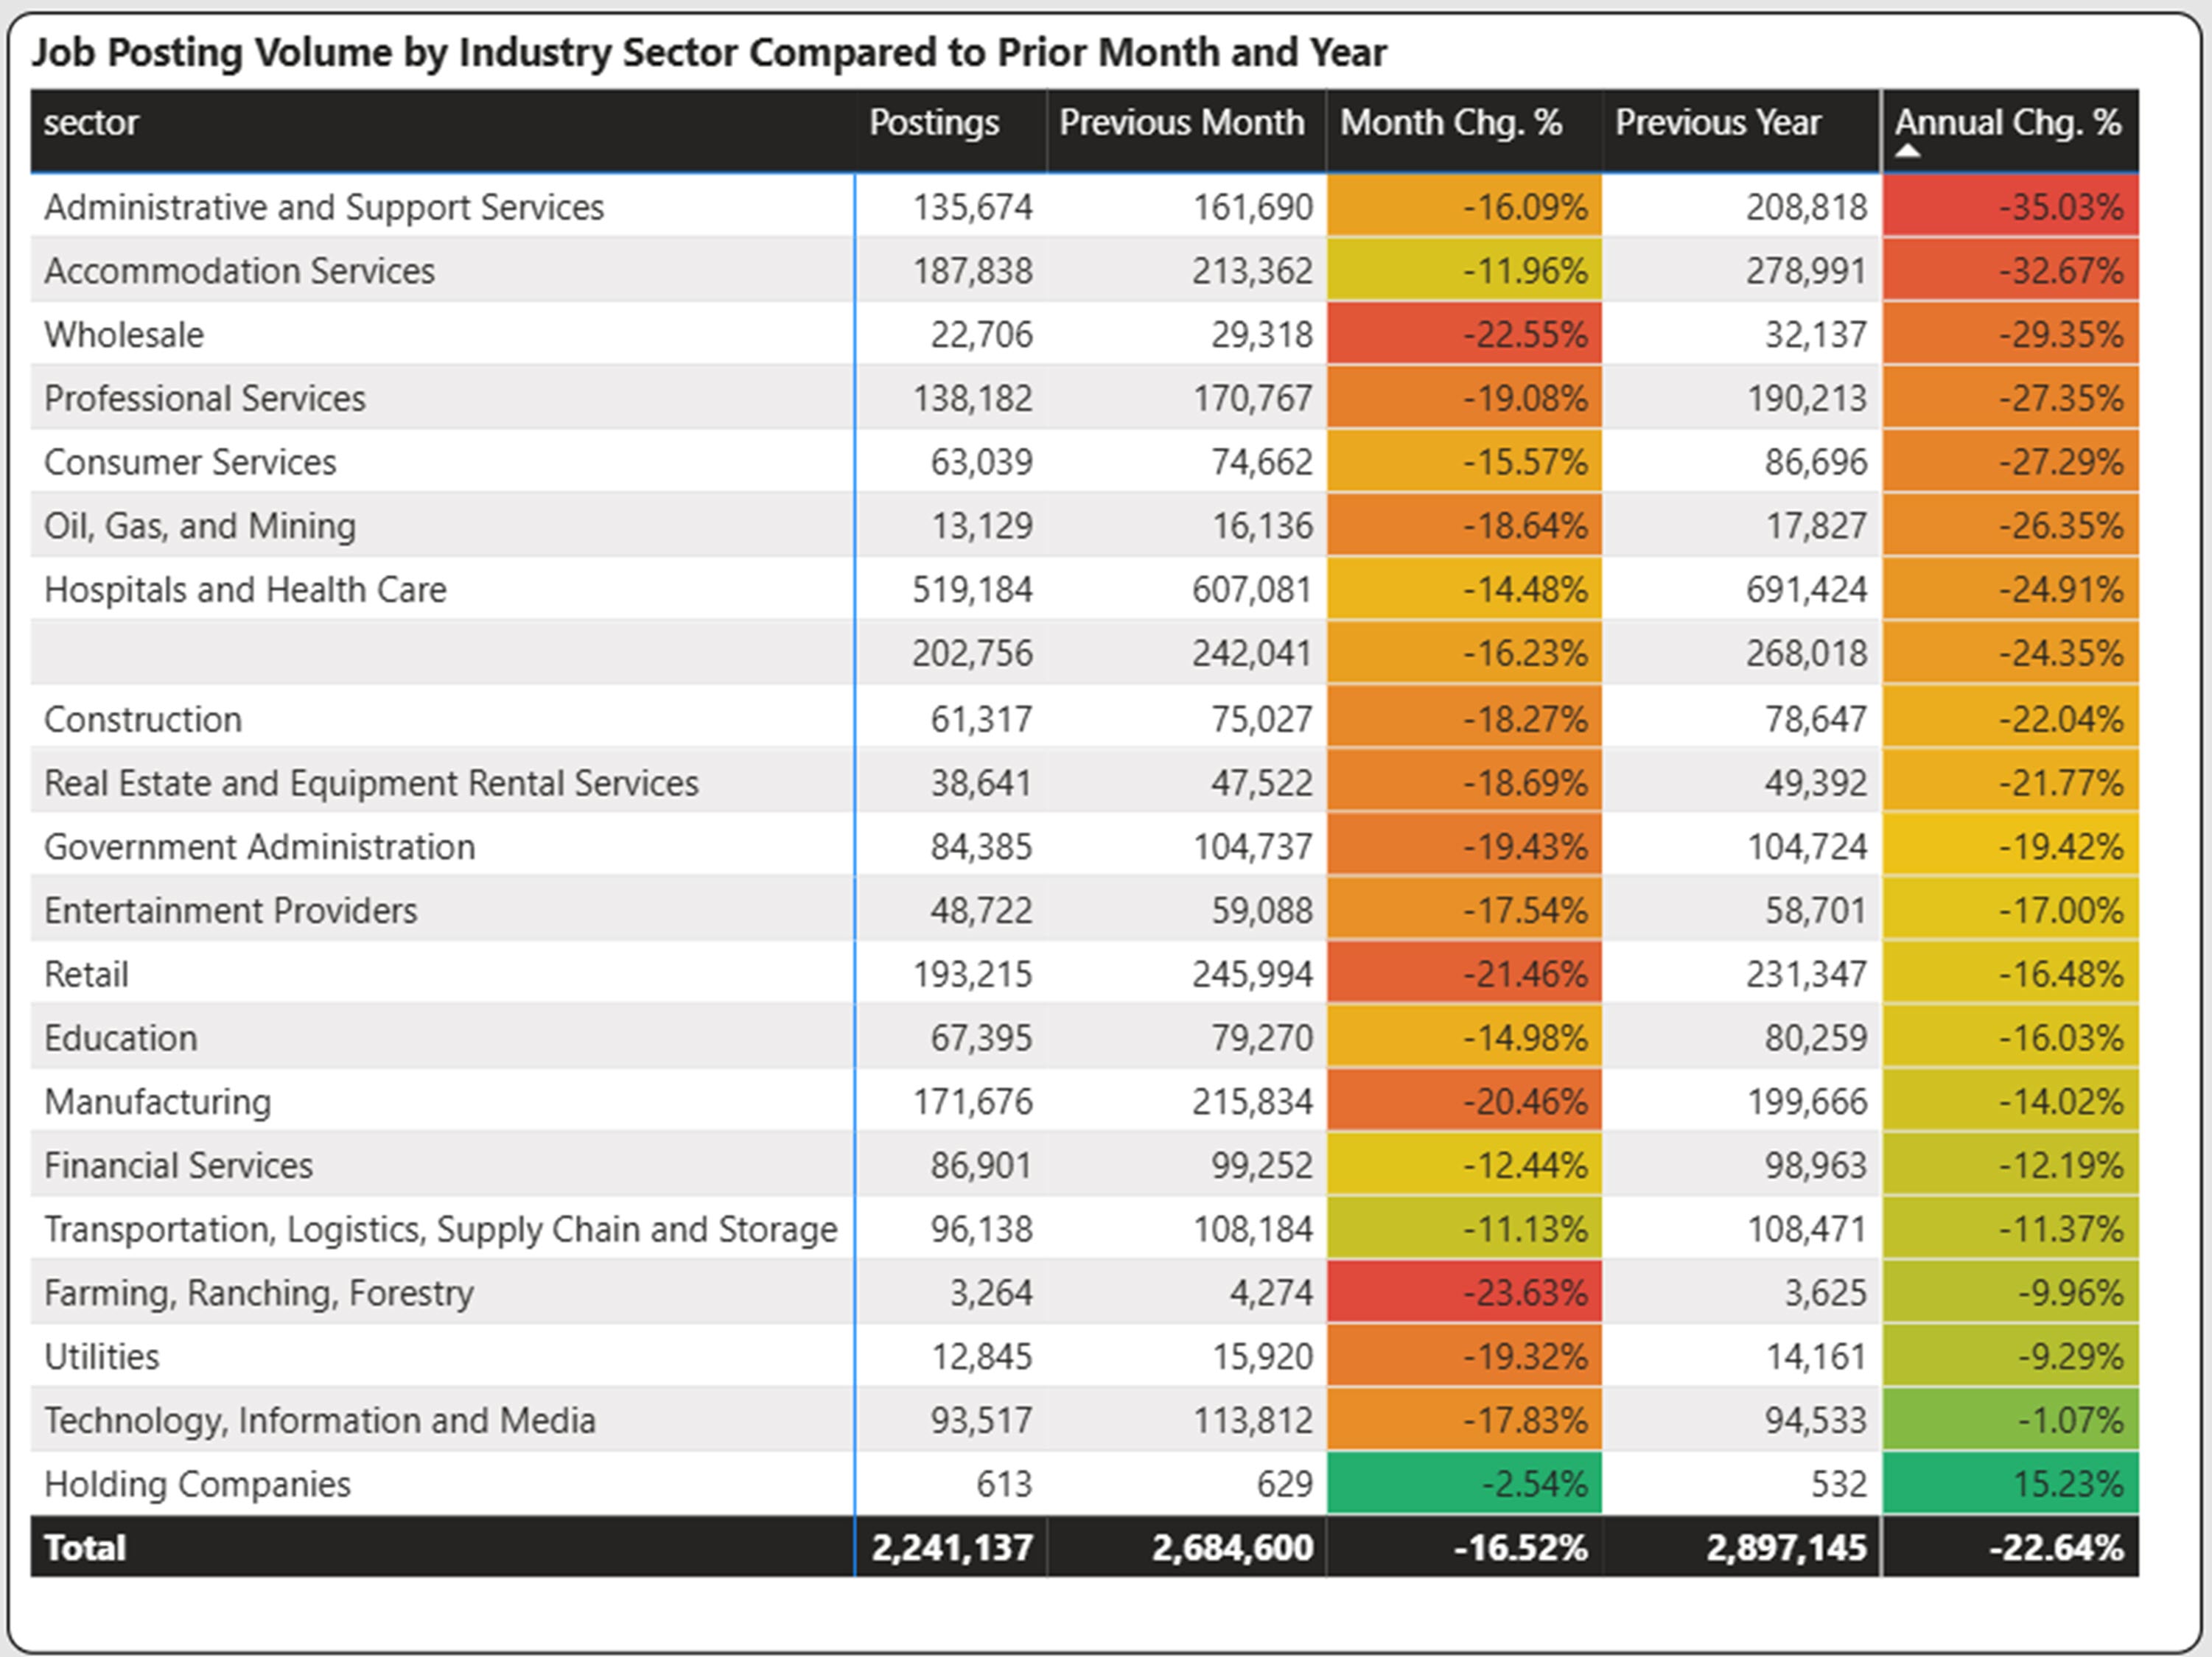
Industry Posting Analysis
Every sector in November 2025 has declined from 2024 (excluding Holding Companies). The only sector that has held its own is Technology, Information, and Media, which was pretty flat at -1.07% compared to 2024.
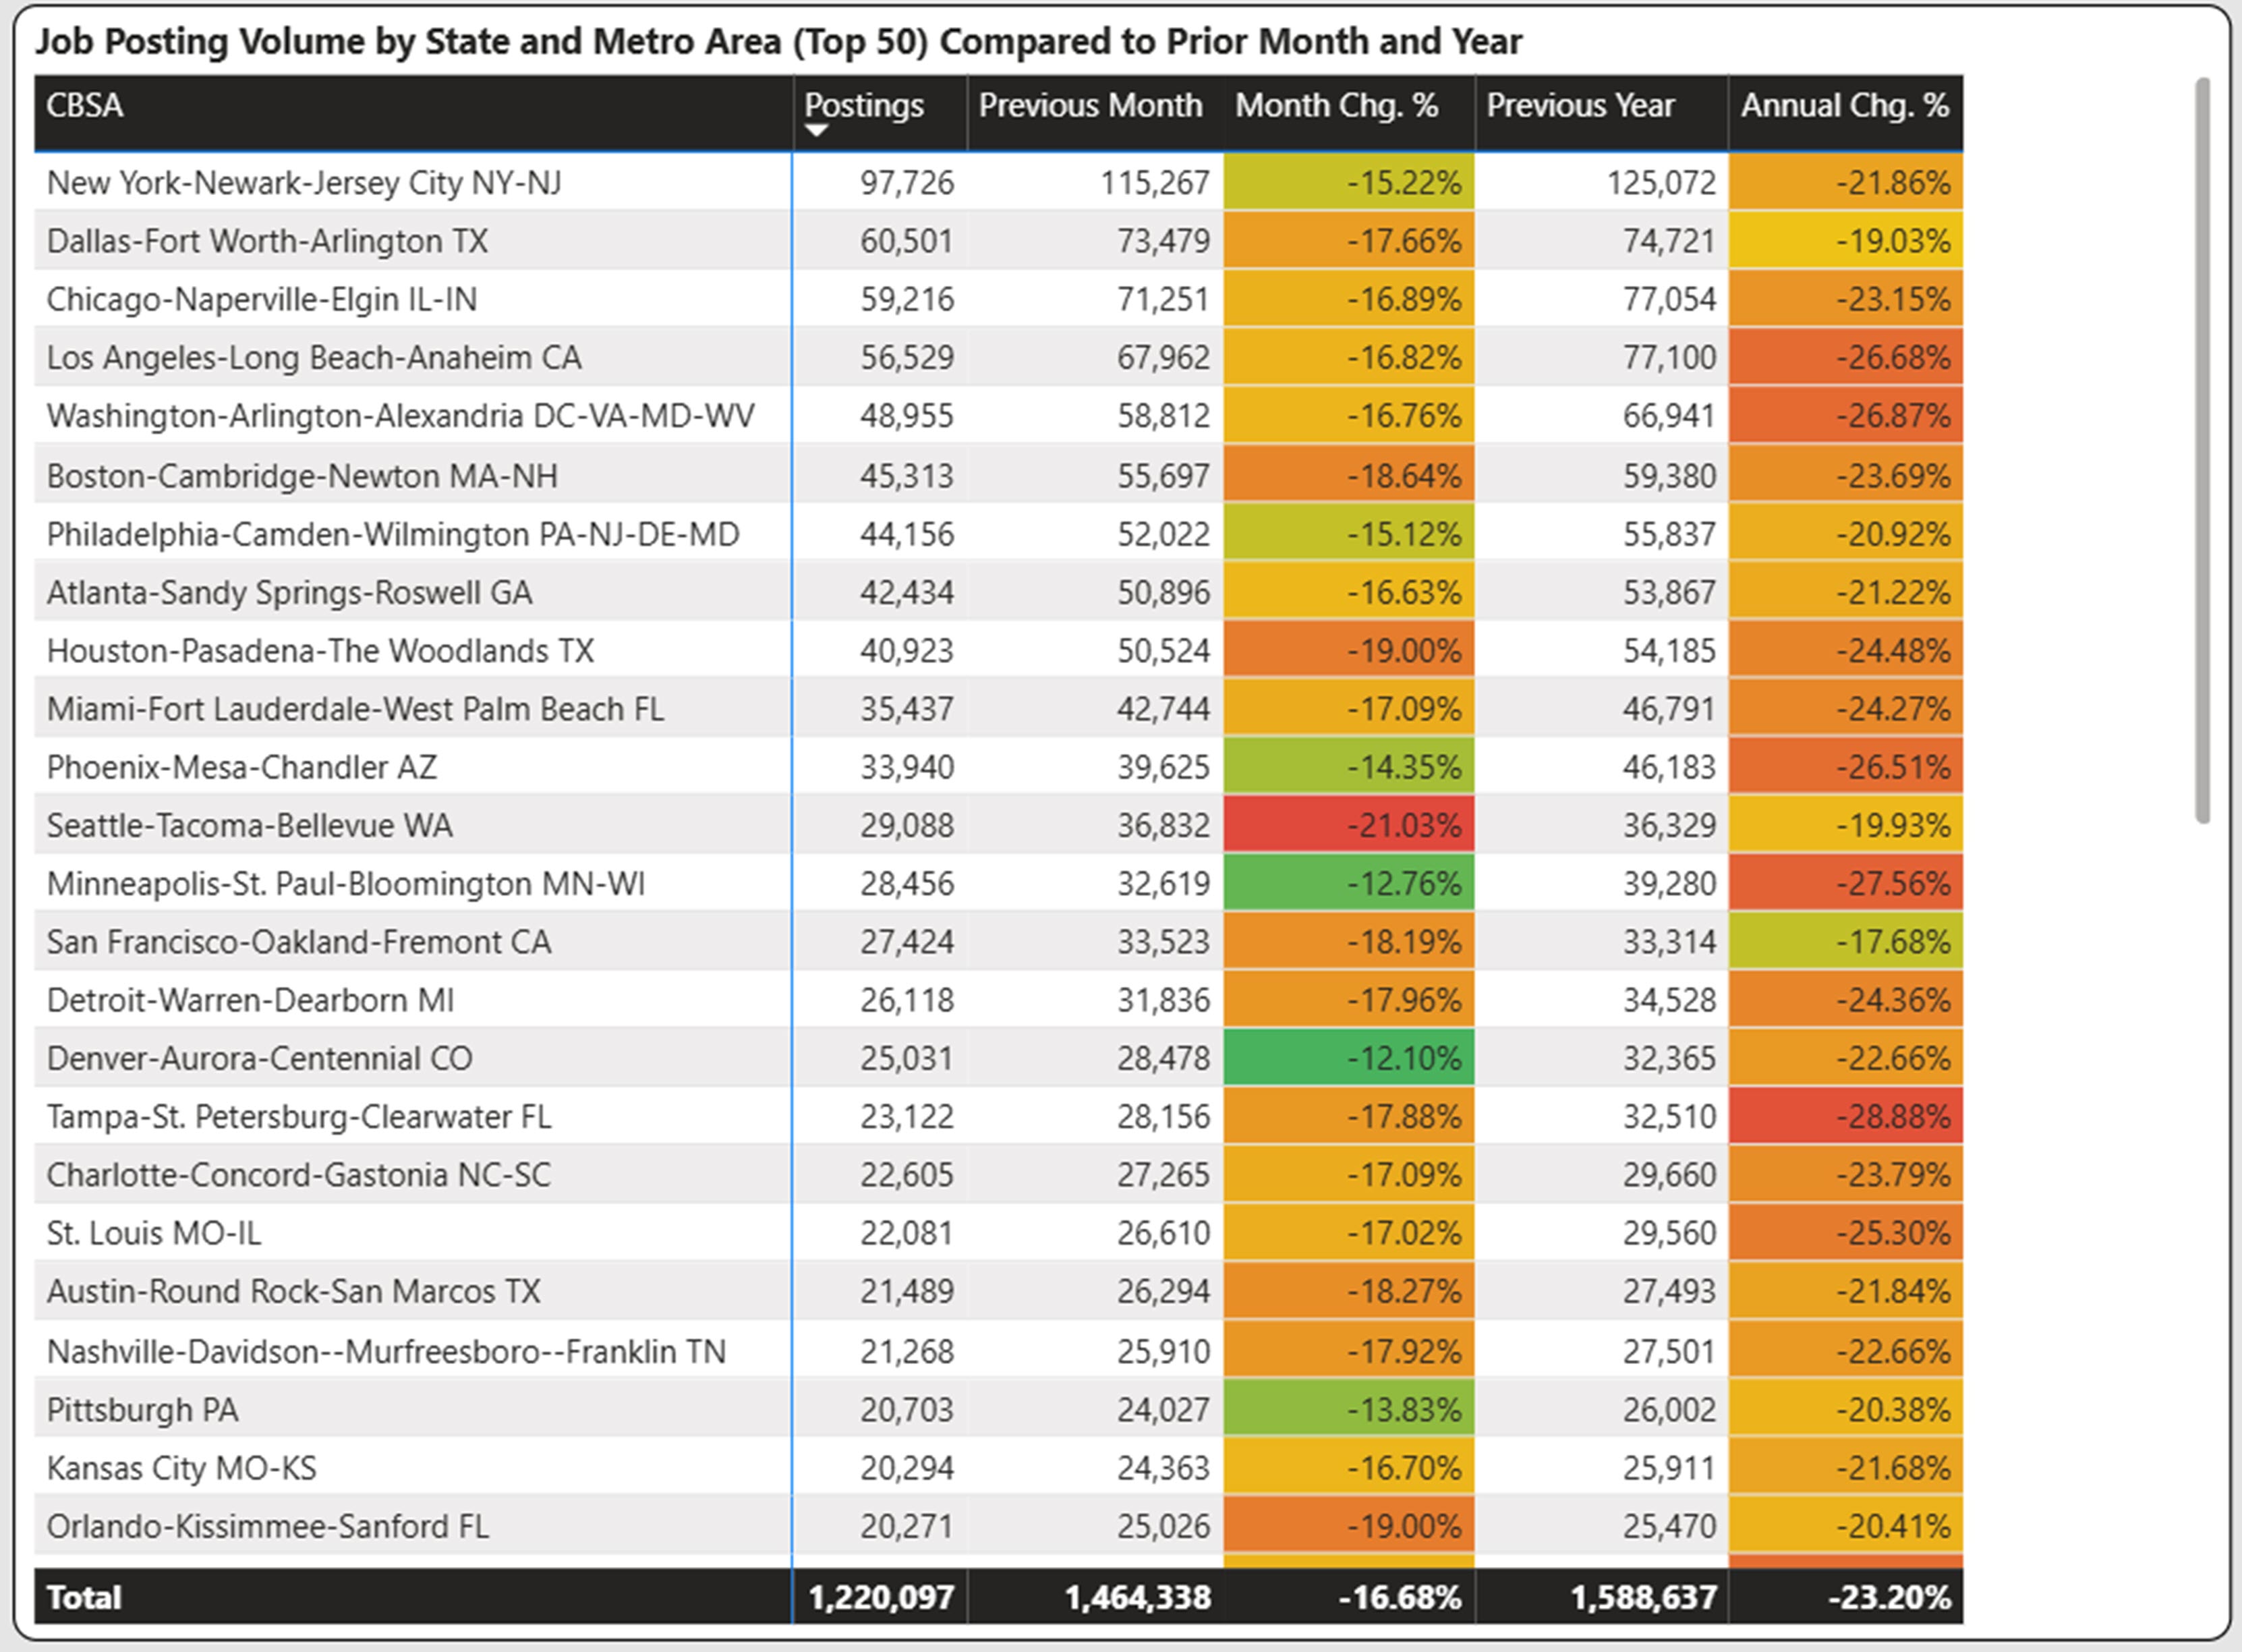
Regional Analysis
All large cities (Top 50 by posting volume) experienced year-over-year declines as shown below. Tampa, Minneapolis and Washington DC had the highest decreases. While no regions have been exempt from posting declines, mid-size cities have declined less on a year-over-year basis. As an example, Durham-Chapel Hill and Boise City experienced declines in the low teens.
Sponsored and Quick Apply Rates Maintain Slow Growth
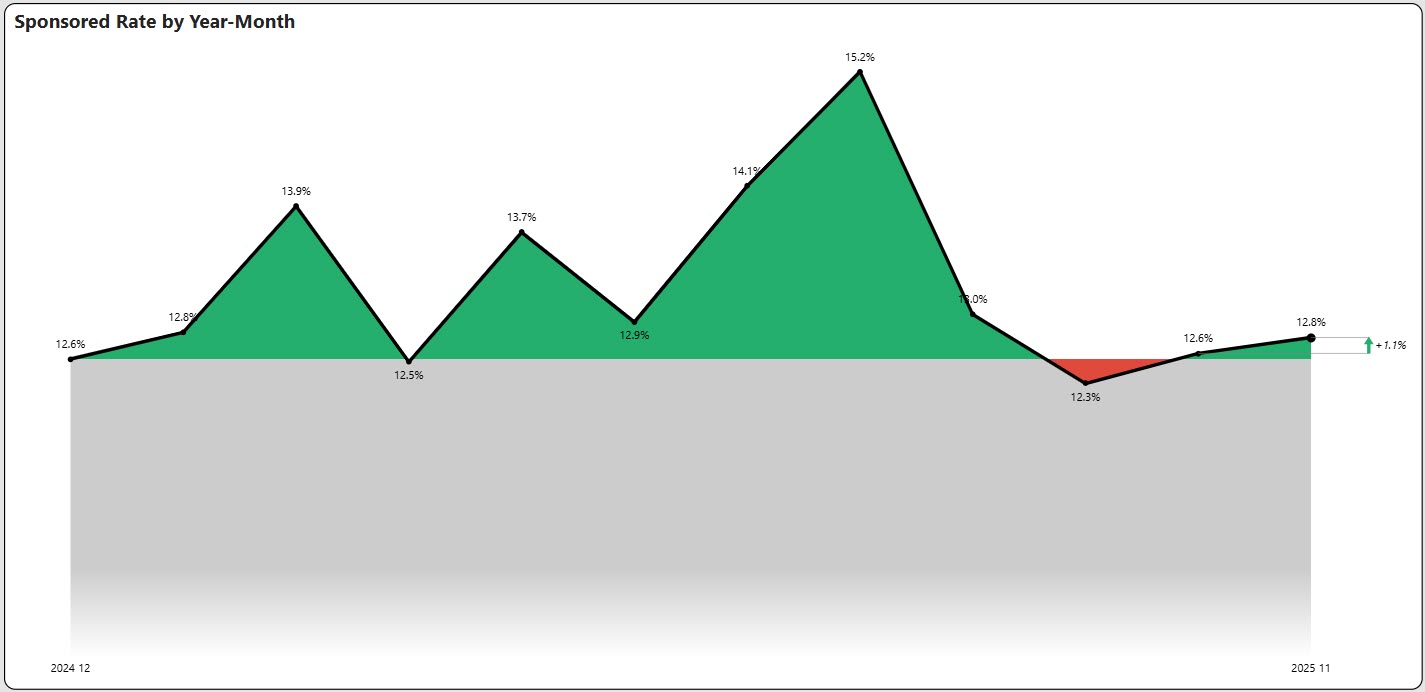
Sponsored rate is the percentage of job advertisements that have had a paid sponsorship at some point over the time period. This is a measure of how active the job boards are. Sponsored rates have had a two-month winning streak at 12.6% and 12.8% which is slightly above 2024 levels, but well below the 15.2% peak.
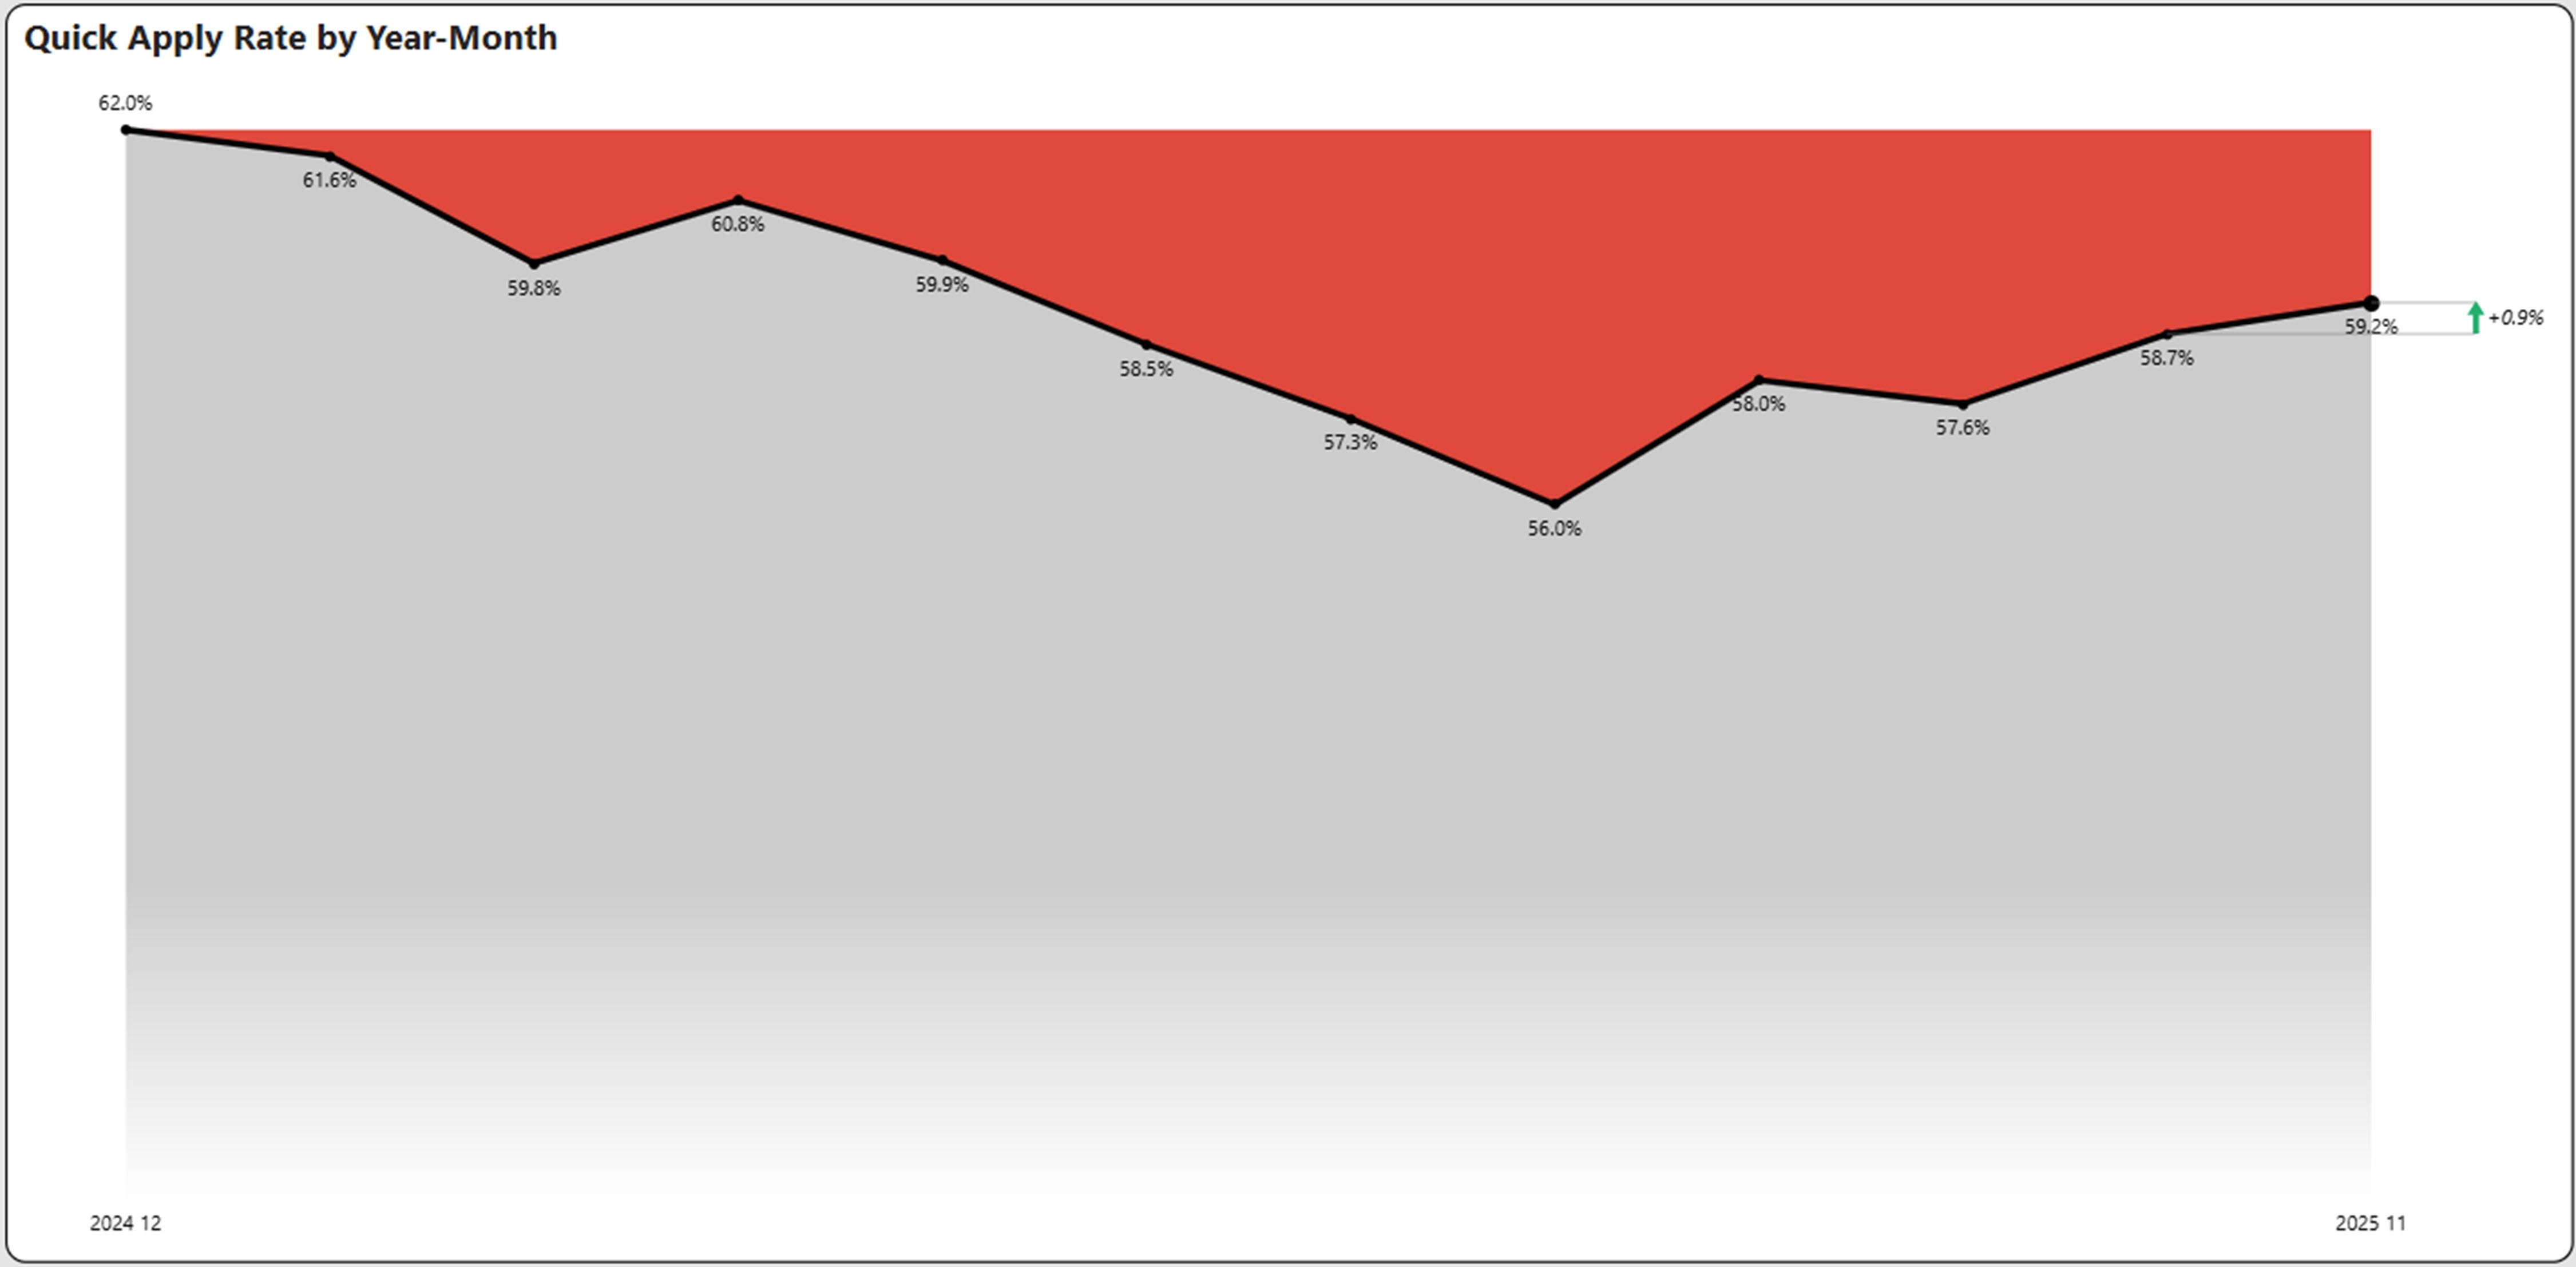
Quick apply rate is an indicator of whether a job posting has the quick apply feature. It also has shown some sustained improvement in November and stands three percent above the lowest rate of the year at 59%.
Artificial Intelligence (AI) Skills Growth
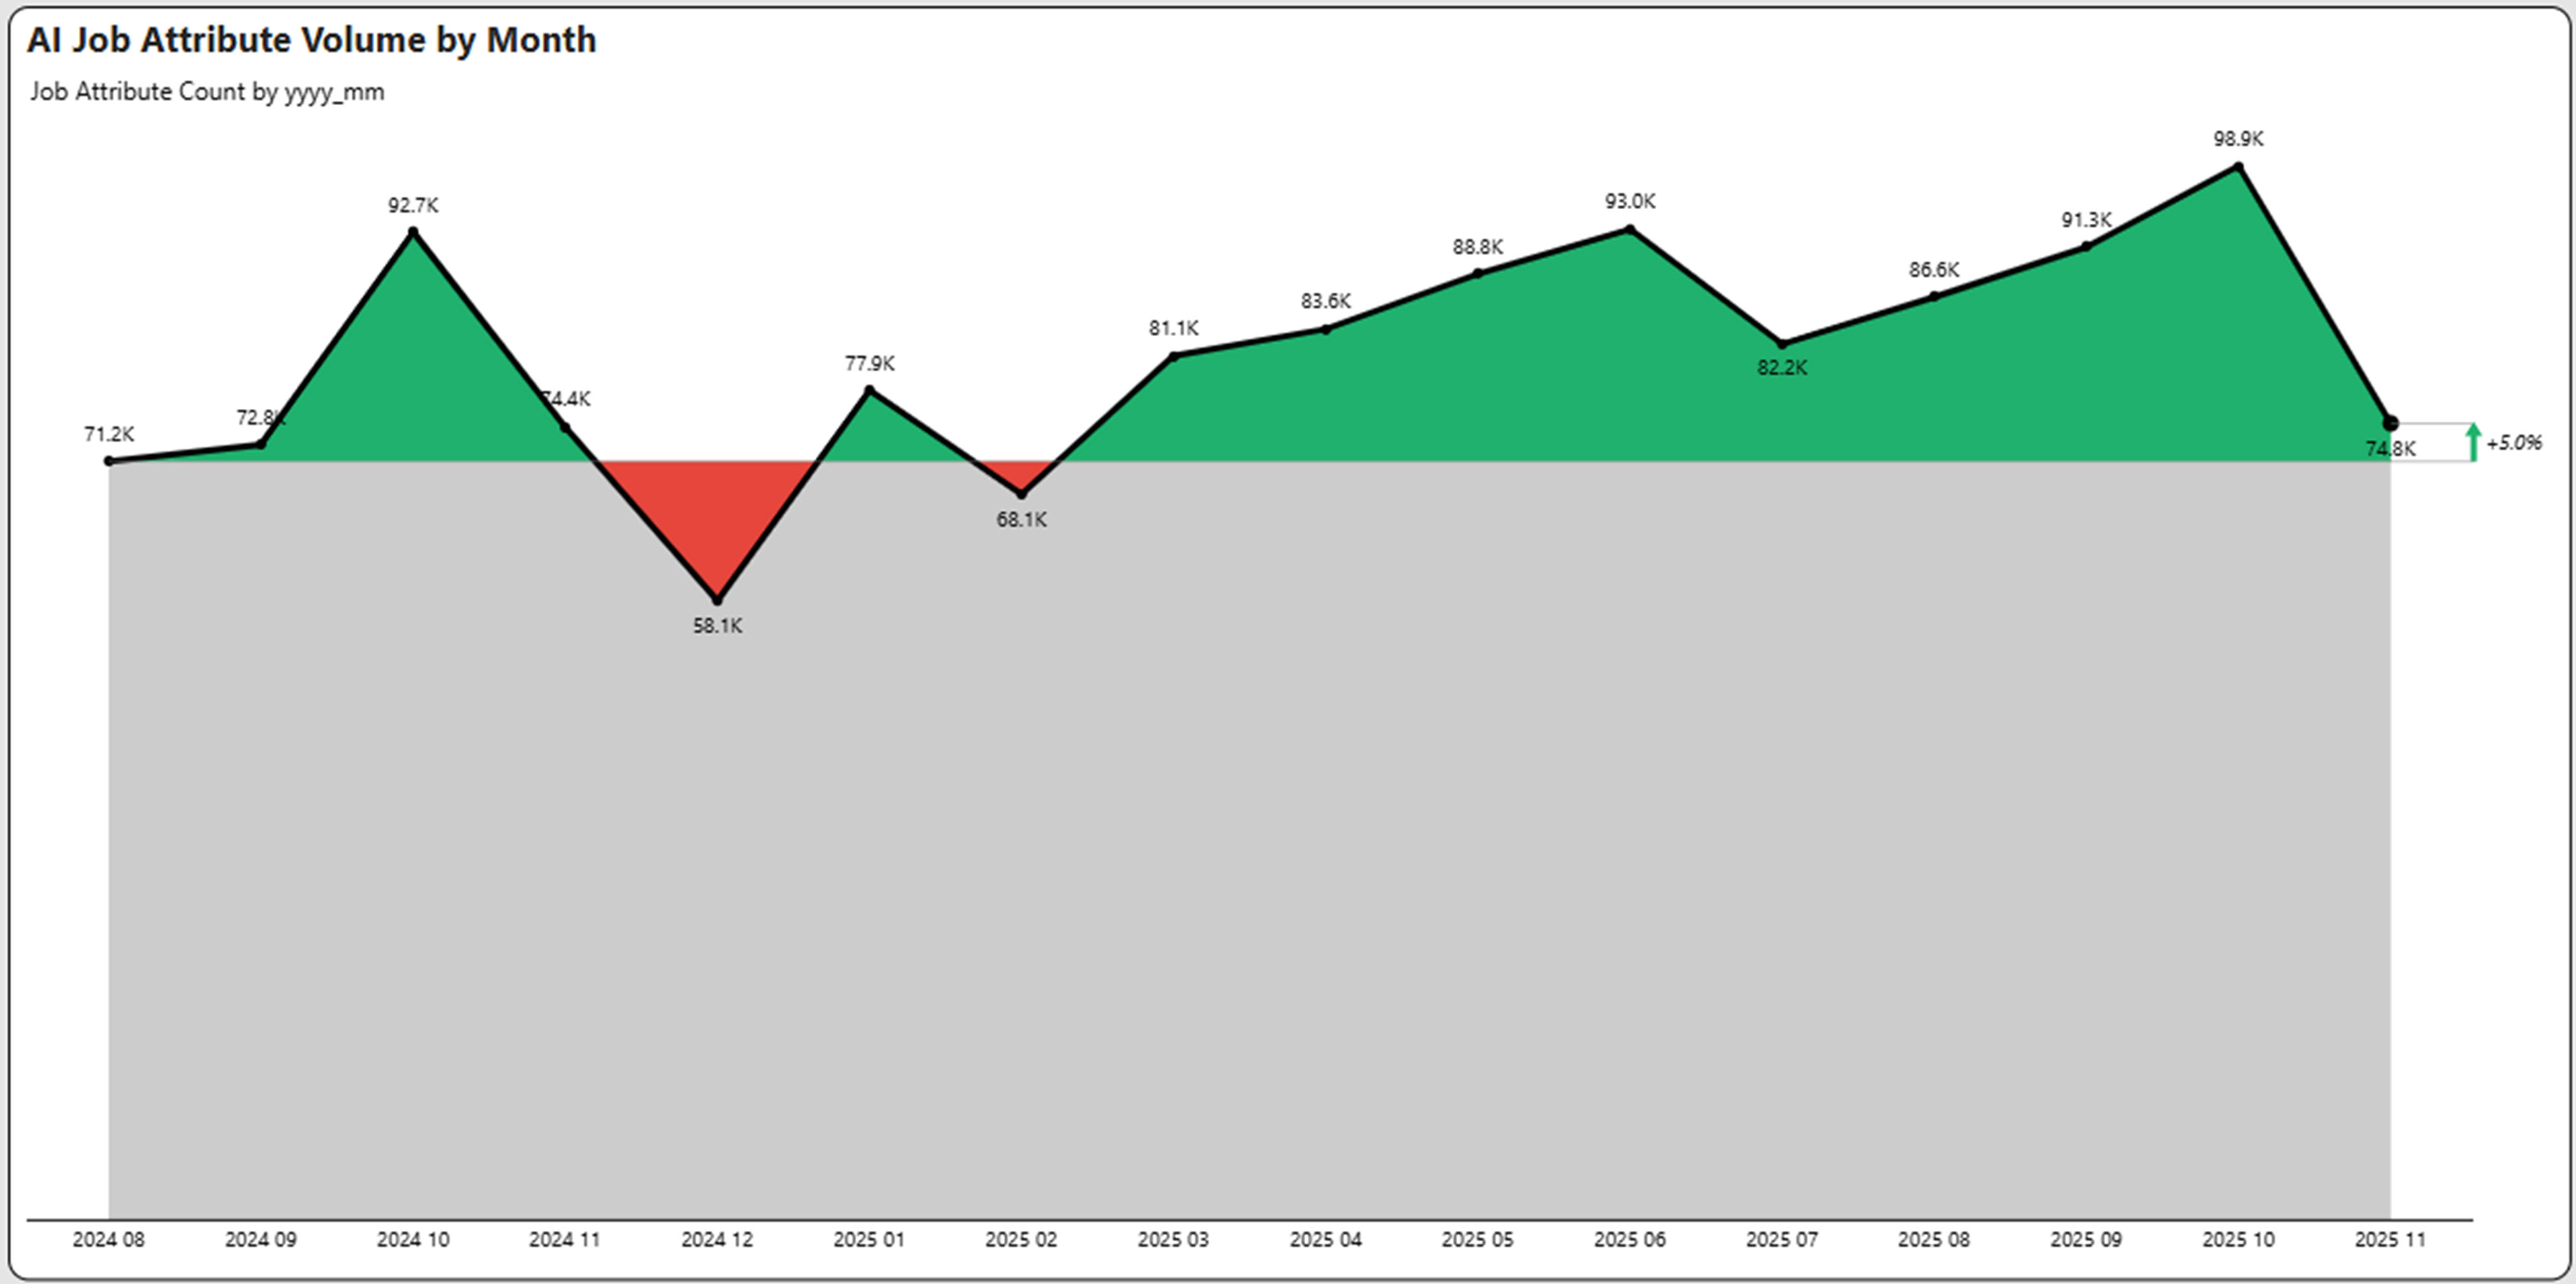
Job attributes are categories of skills, benefits or credentials that are included in a job posting. We have flagged AI related categories and plotted the trailing 16-month growth as shown below. The decline in November AI attributes was 24.3%. The inclusion of AI related attributes were comparable to August 2024 levels.
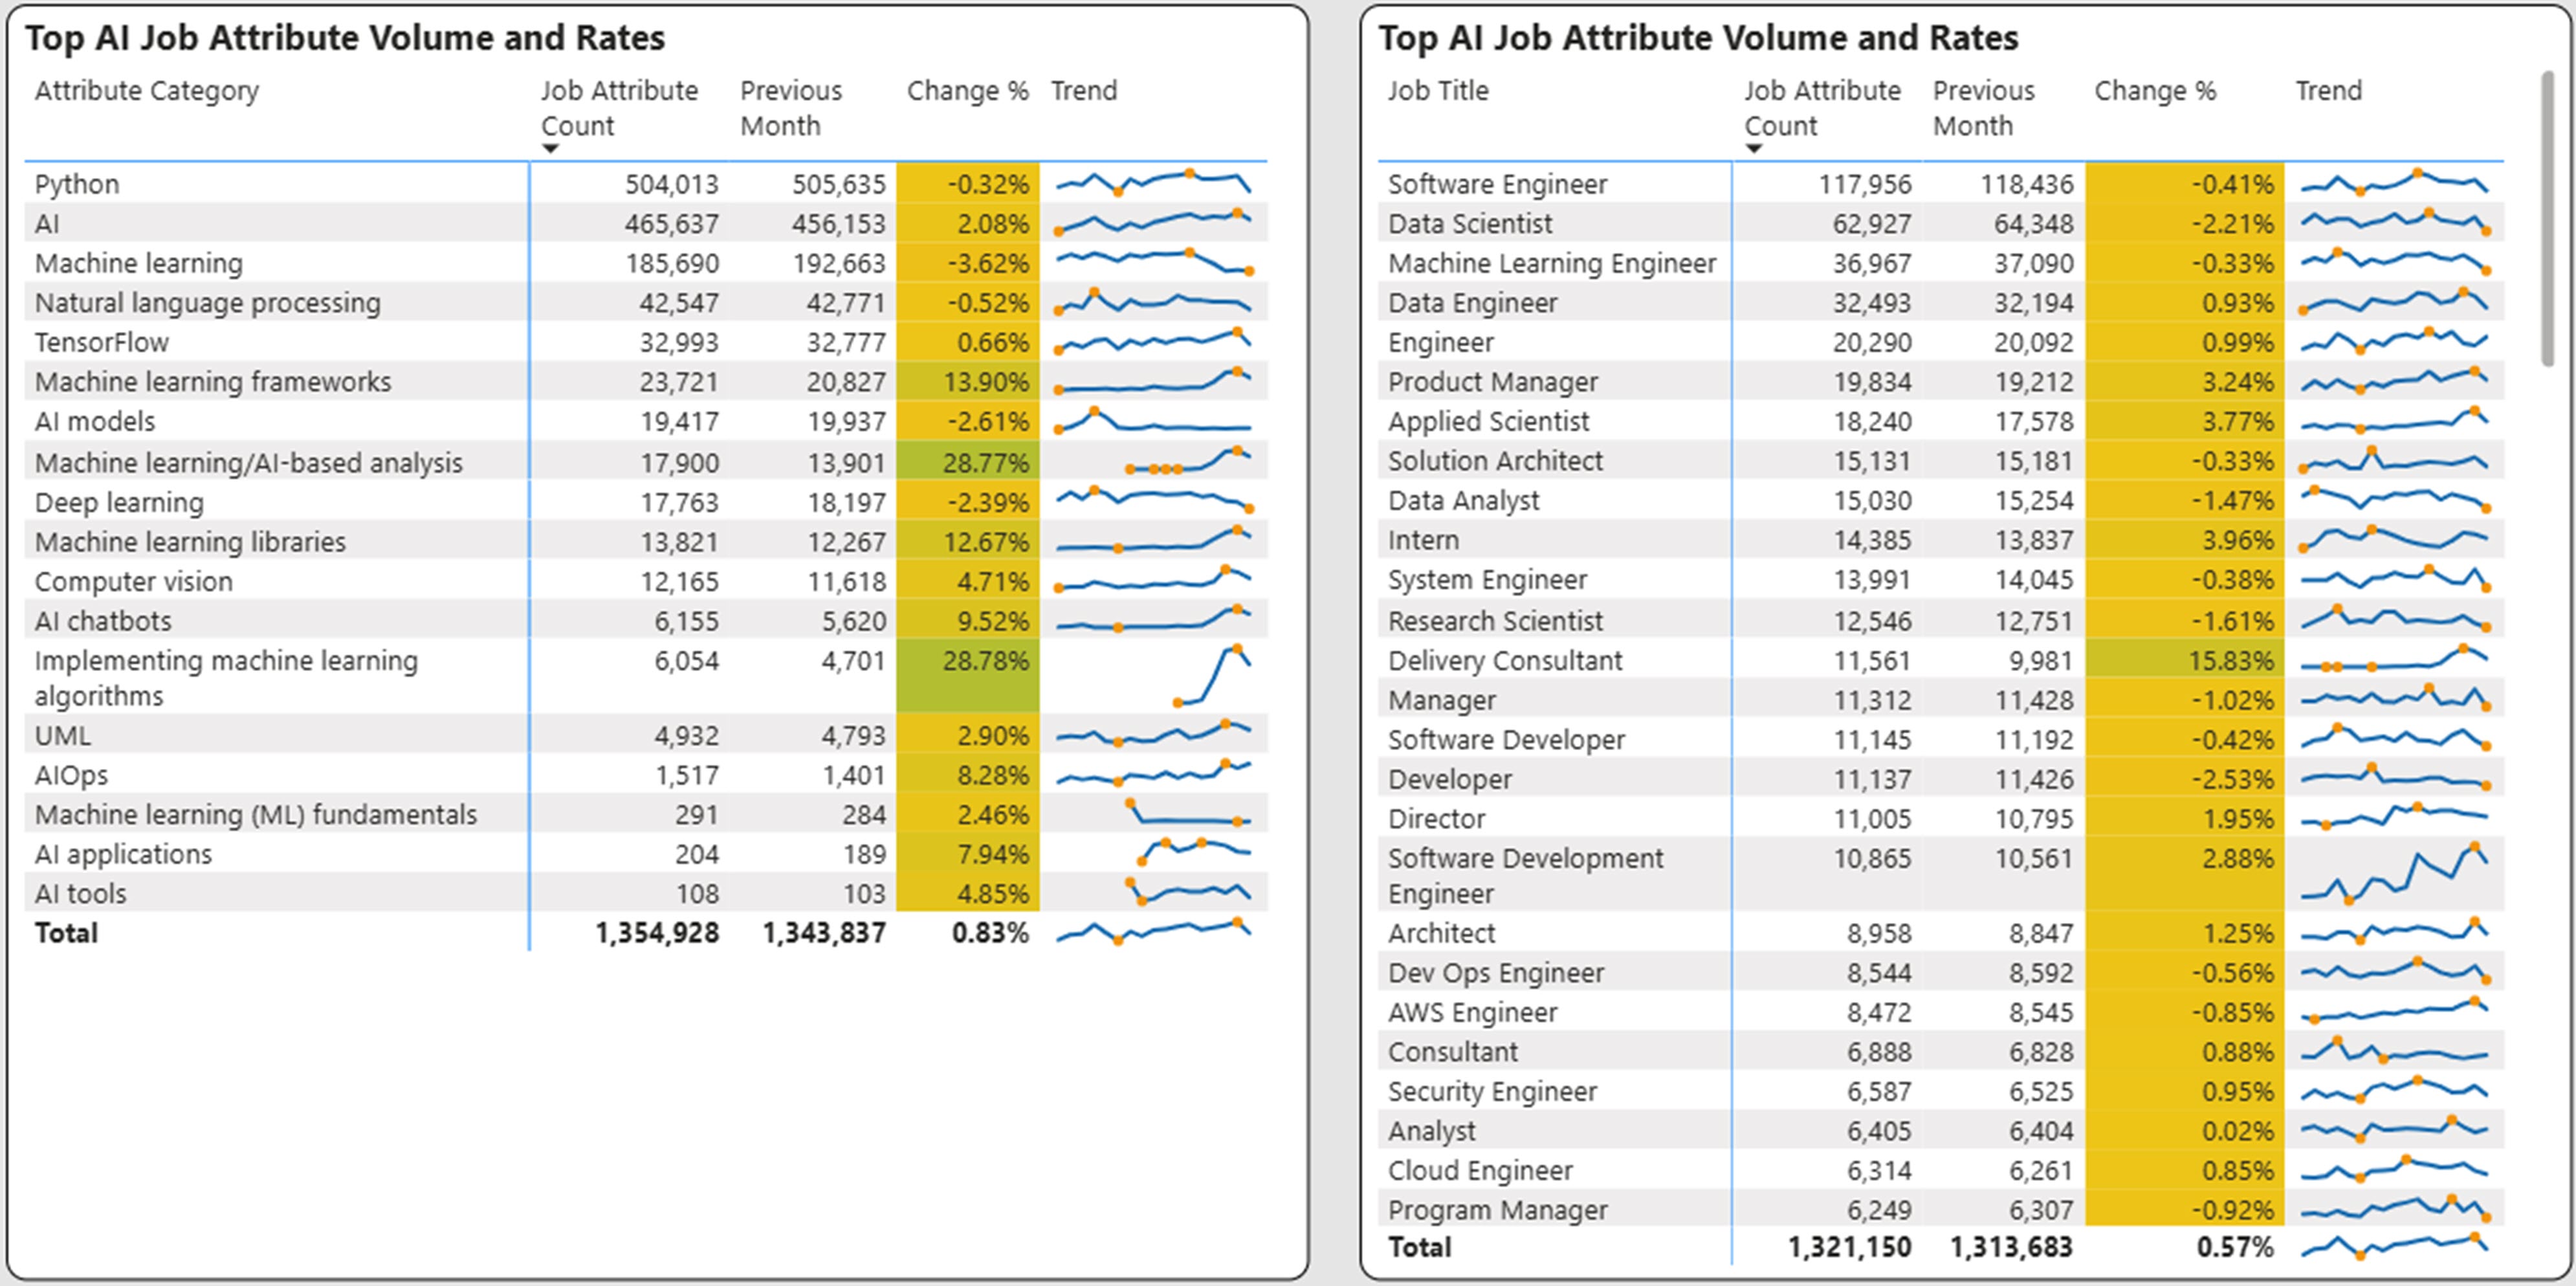
The top AI skills are shown below along with the corresponding job titles. Python has remained the top mentioned attribute while machine learning related attributes continue to show the most growth. These attributes are found across multiple technology job titles, but are also increasingly showing up in non-technical job titles such as product manager and delivery consultant.
Fill Days Stays Flat but Fill Rates Maintain Upward Climb
Fill days use ad expiration and ad removal to determine a presumptive hire. When measured over a prolonged period of time and over millions of postings, this provides a strong view of the overall market. The trailing 12 months is used as a time period for our analysis.
In the graph below, we show the fill days by month along with the percentage of ads (blue line) that have been filled. Obviously, the newer ads have a lower fill rate.
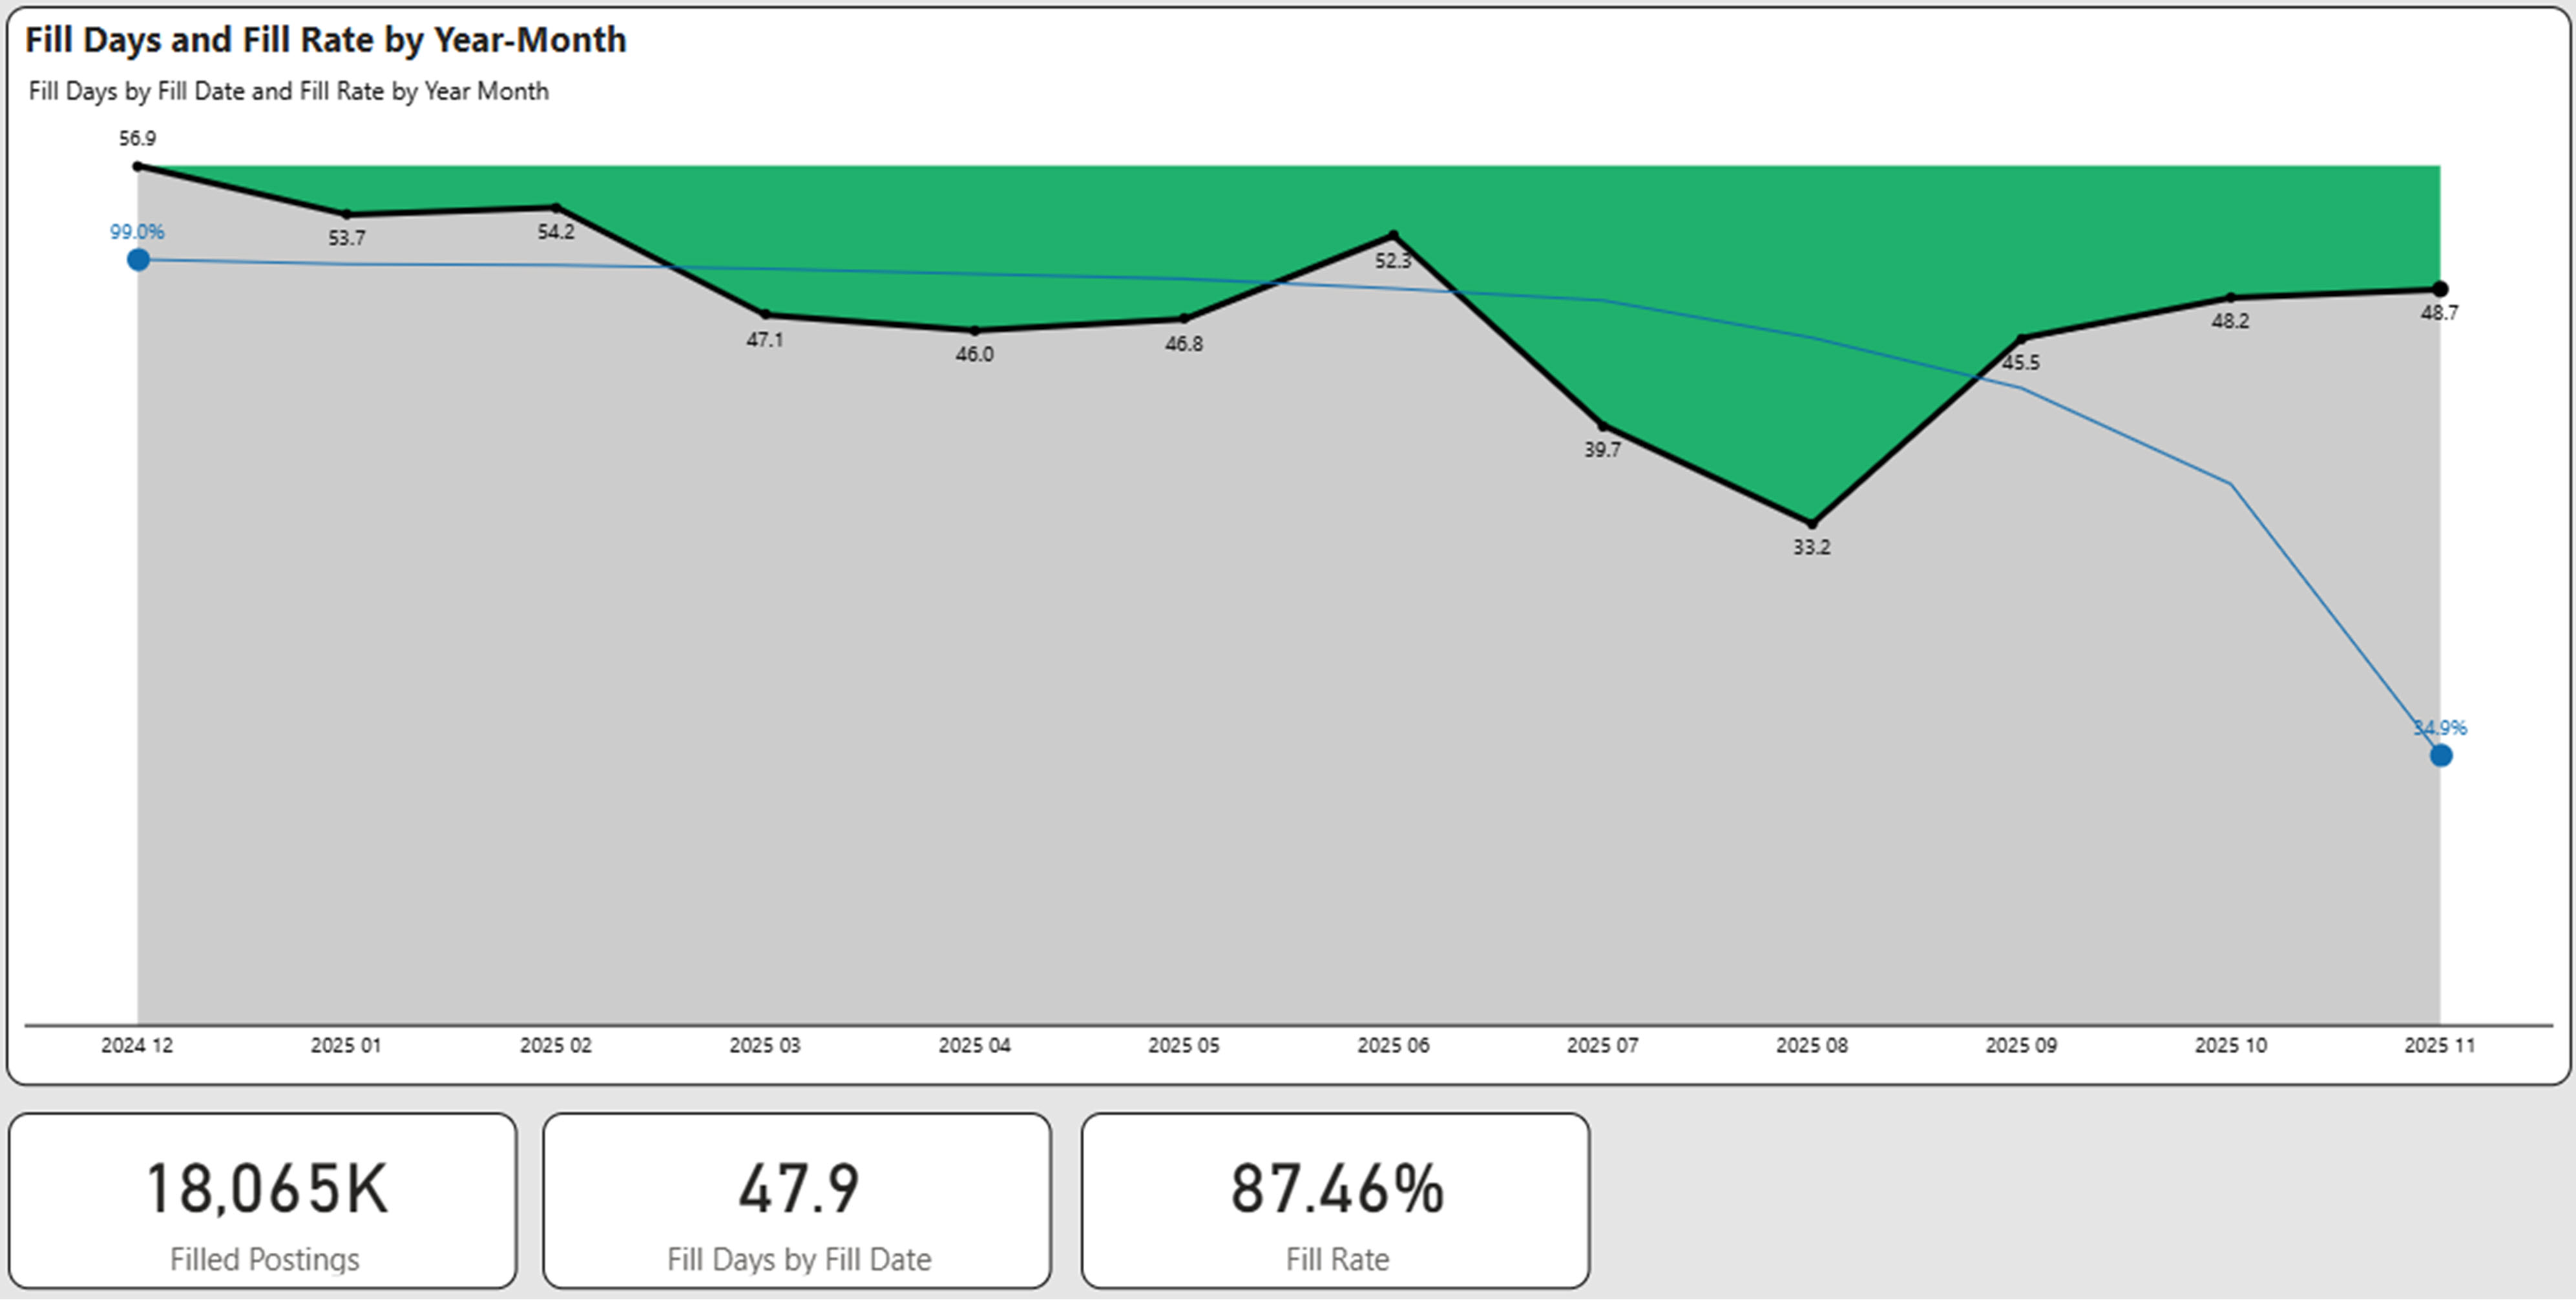
Fill days as a composite was basically flat in the November analysis from 48.4 days to 47.9 days. The percentage of ads filled during the analysis timeframe continued to increase, moving from 84.4% to 87.5%, indicating good success in filling jobs.
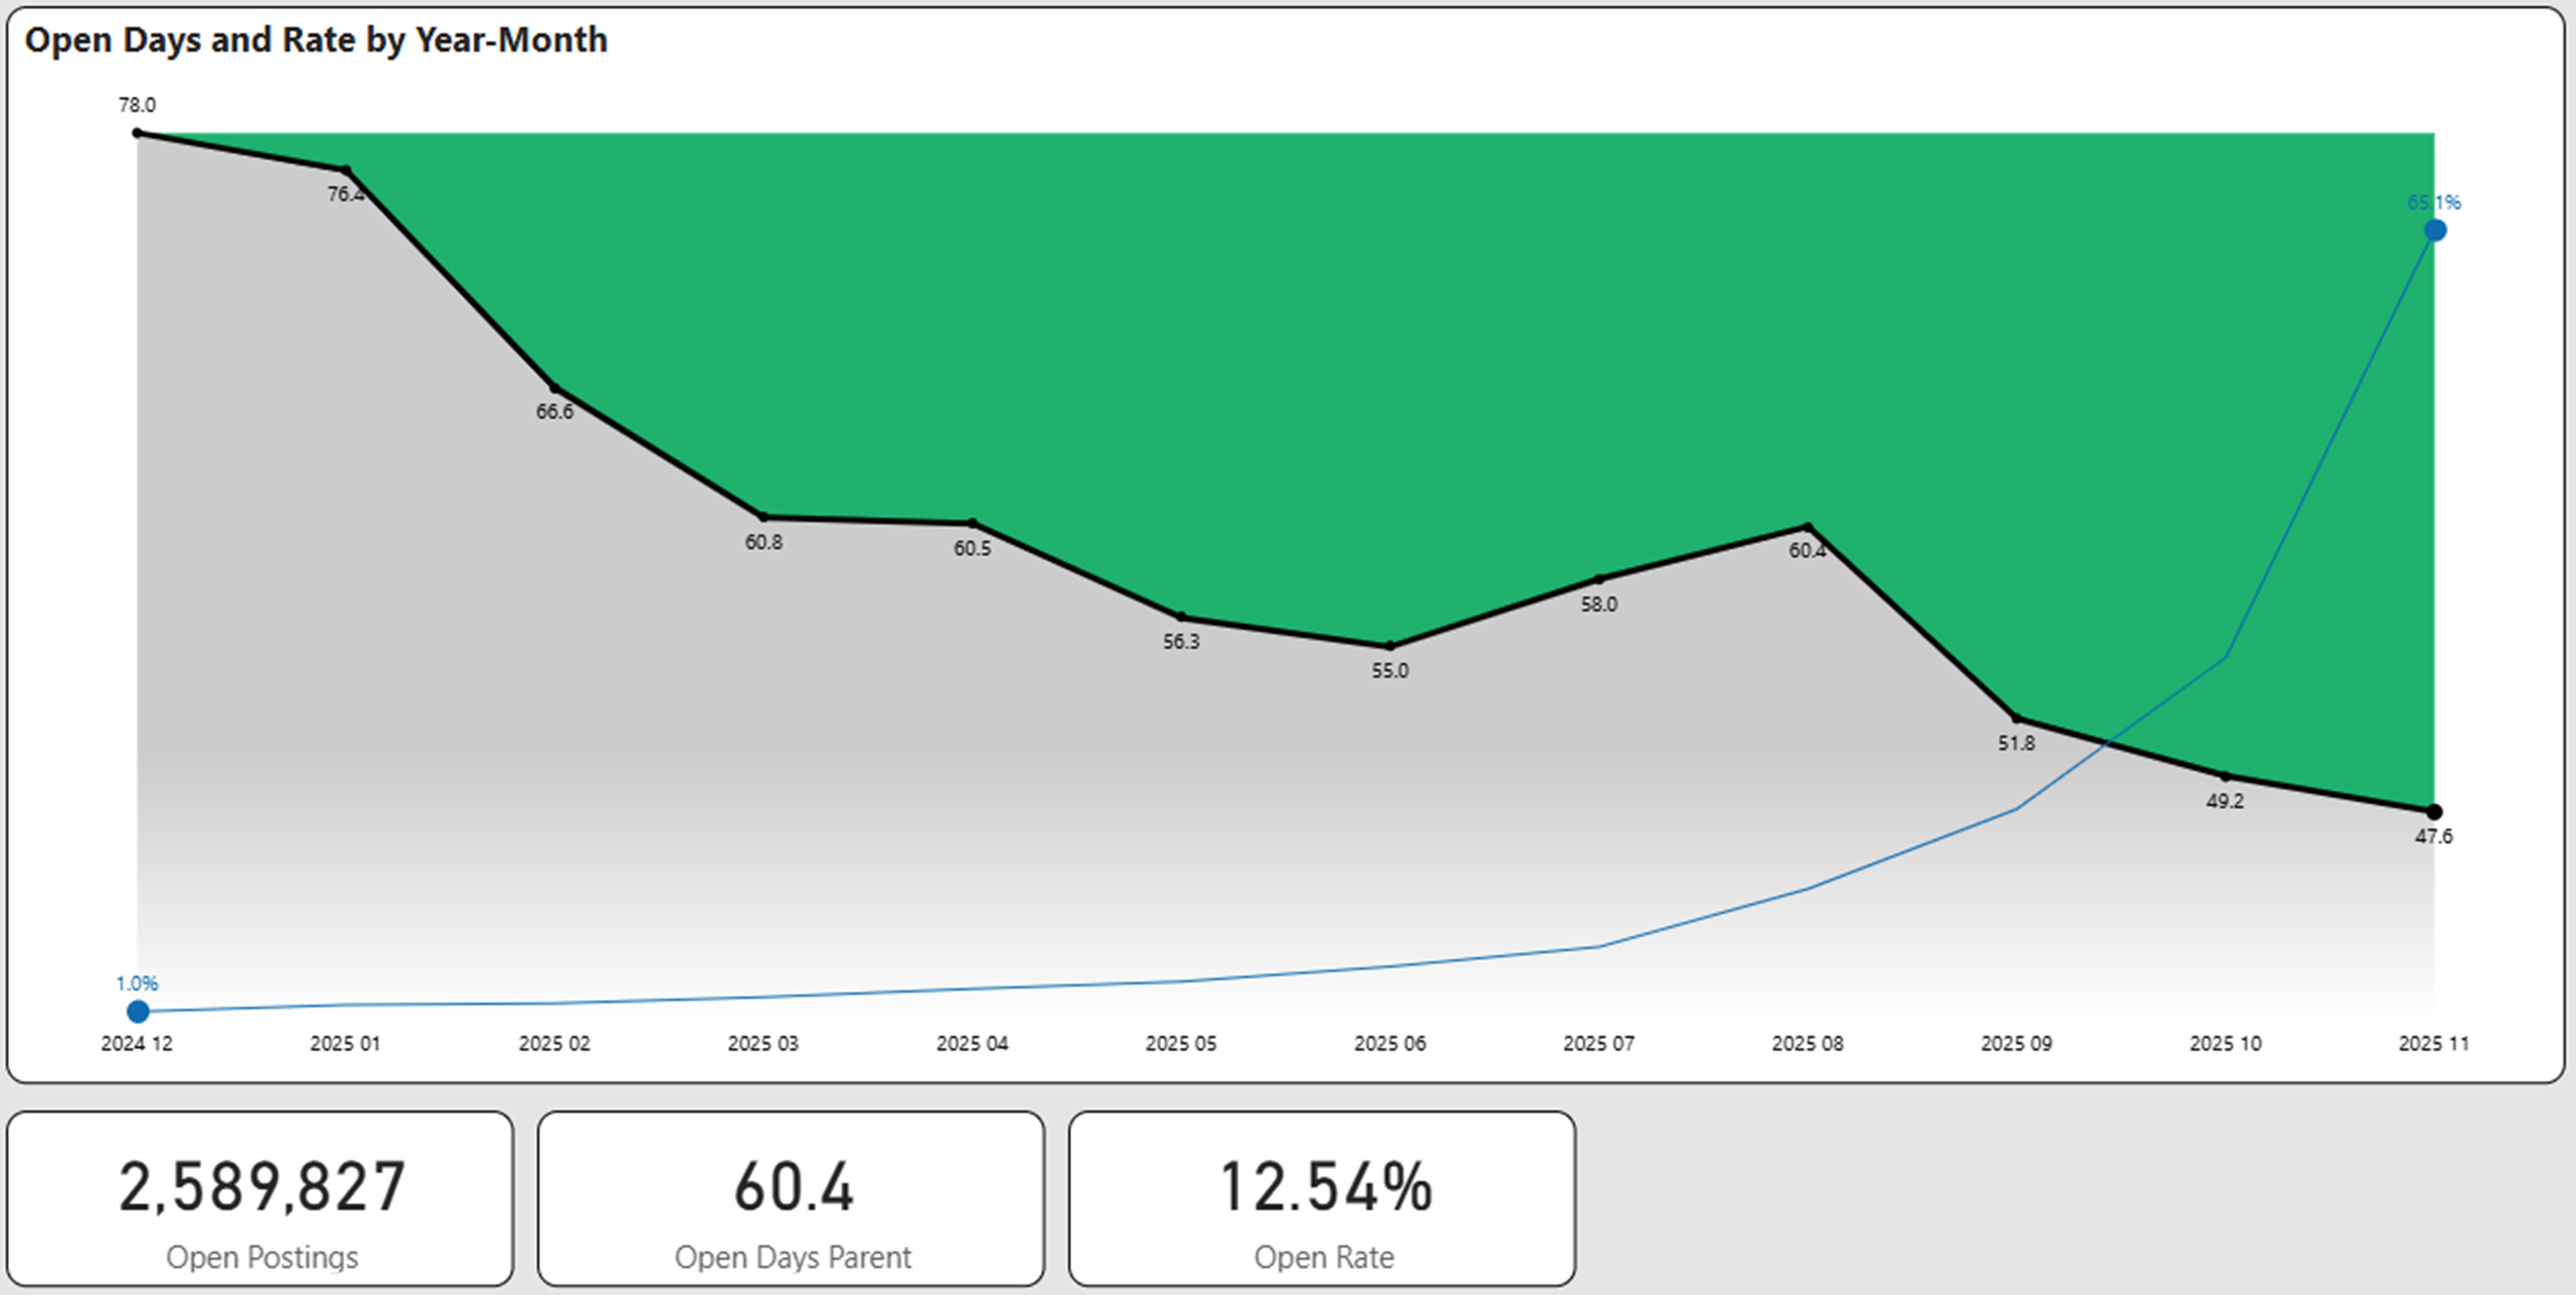
Open Days Improves Slightly While Open Postings Dips Below 3 million
We track every job posting uniquely and ascertain its fill status on a weekly basis. Open days is the age of postings that are still determined to be open. Generally, we have found that 12 months to be a suitable time horizon to evaluate the age of open days. Older postings may distort the open days as they may represent “evergreen” postings. For this reason we eliminate implied evergreen ads that are older than one year.
The graph below shows the aging of open postings for the past 12 months. Open days declined slightly from 60.8 in October to 59.8 in November, continuing improvement. However the percentage of open jobs decreased significantly from 15.0% to 12.5% and the number of open jobs for the trailing 12-month period decreased from 3.1 million to 2.6 million. Clearly between fill days and open days, the job market is tightening.
Compensation
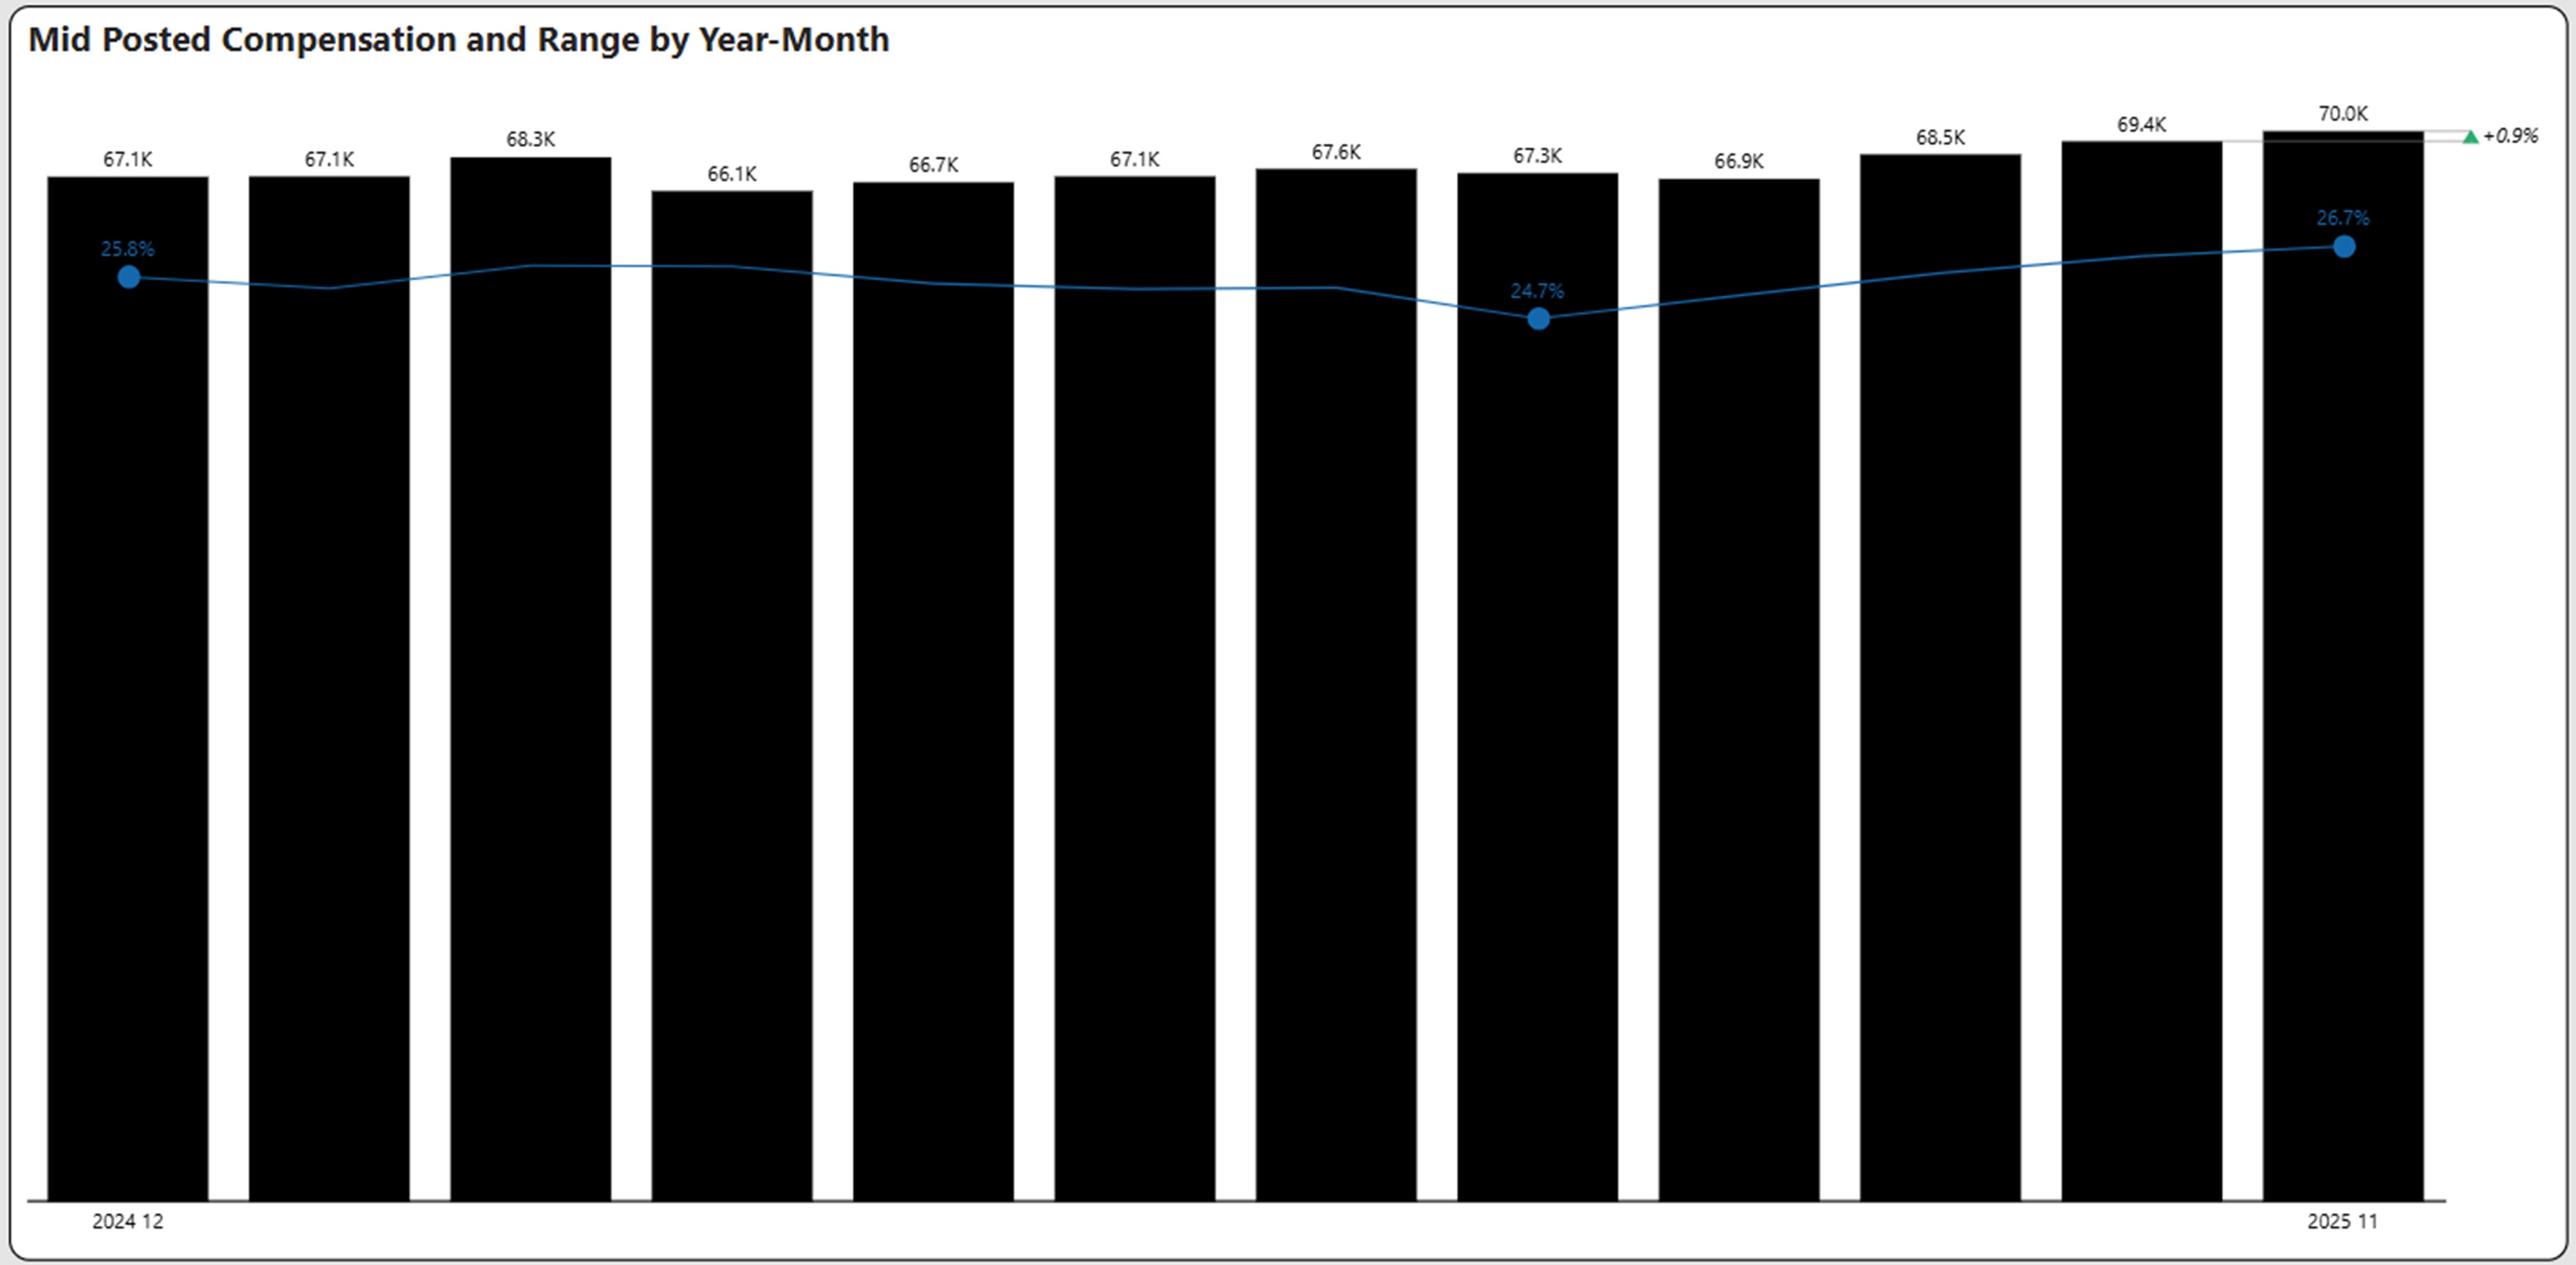
Compensation Cracks the $70k Barrier
Mid-posted compensation increased just under 1% in November to $70,036, a 12-month high. This continues the meaningful increase from September. In addition, the range of pay between max and min as a percentage of the midpoint also continued to increase from 26.4% to 26.7%, suggesting some flexibility in negotiated pay. This also is at a 12-month high.
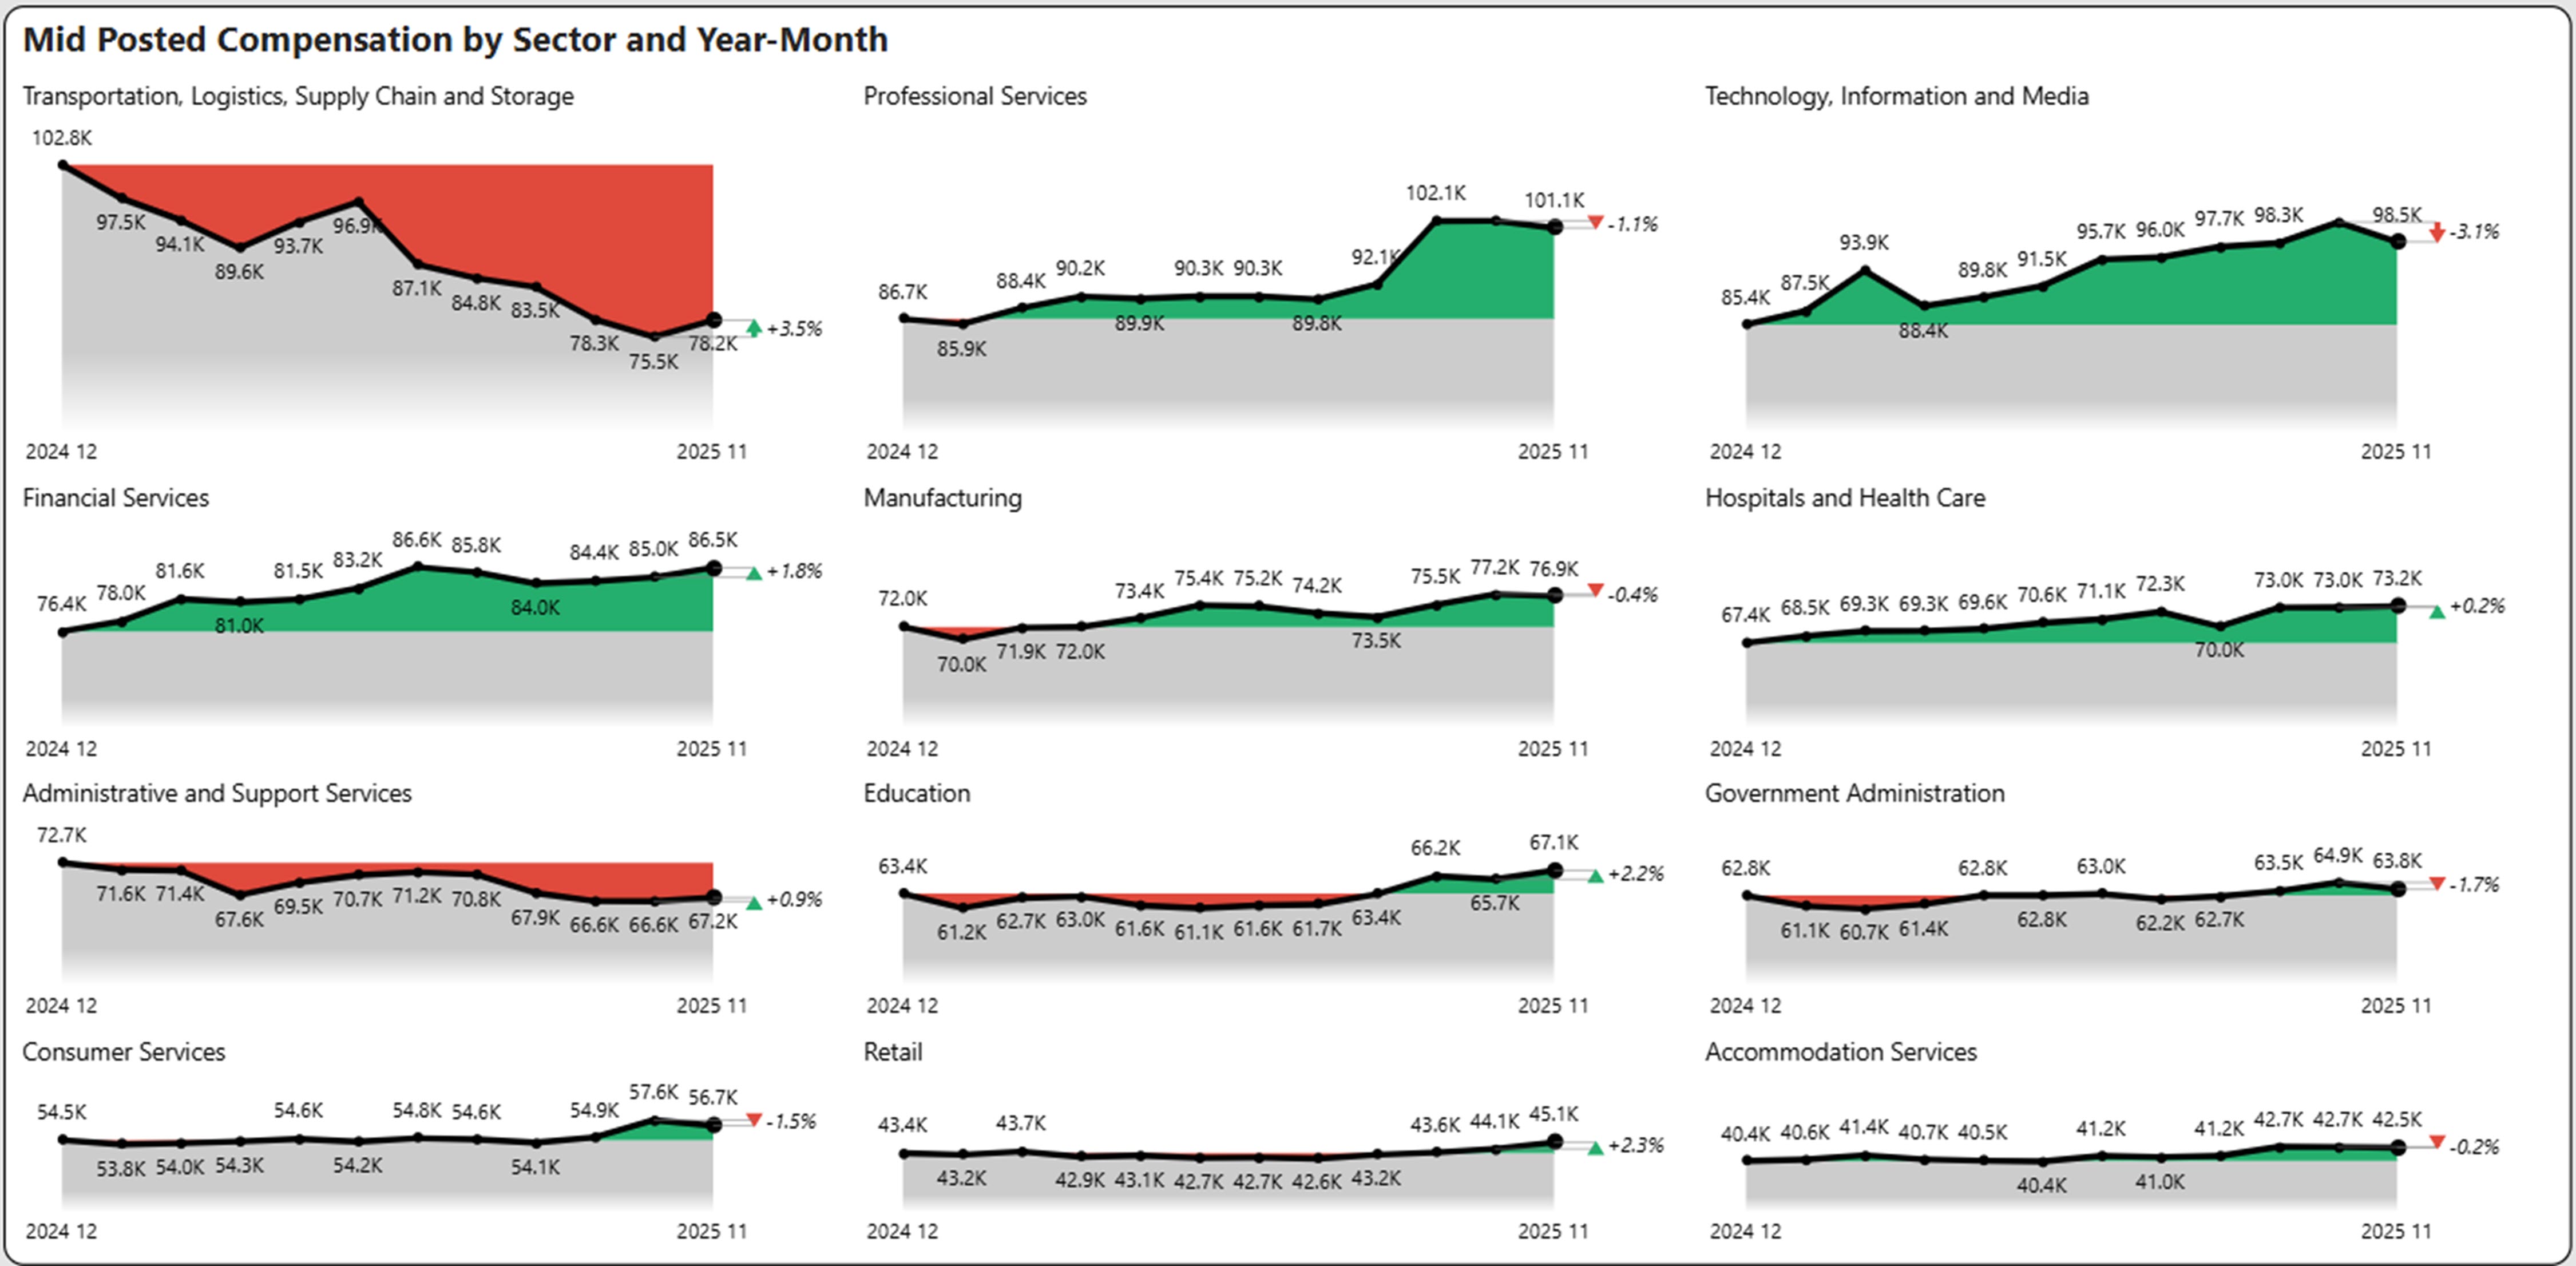
Compensation by Industry Sector
- Transportation rebounded 3.5% ending a prolonged multi-month slump.
- Education, Financial Services, and Retail sectors showed monthly increases in the 2% range.
- Technology, Information, and Media after a long run up declined 3.1% in November.
- Professional Services, Consumer Services, and Government Administration also showed declines above 1% during the month.
Supply and Demand
Trailing Resumes Continue Upward Climb
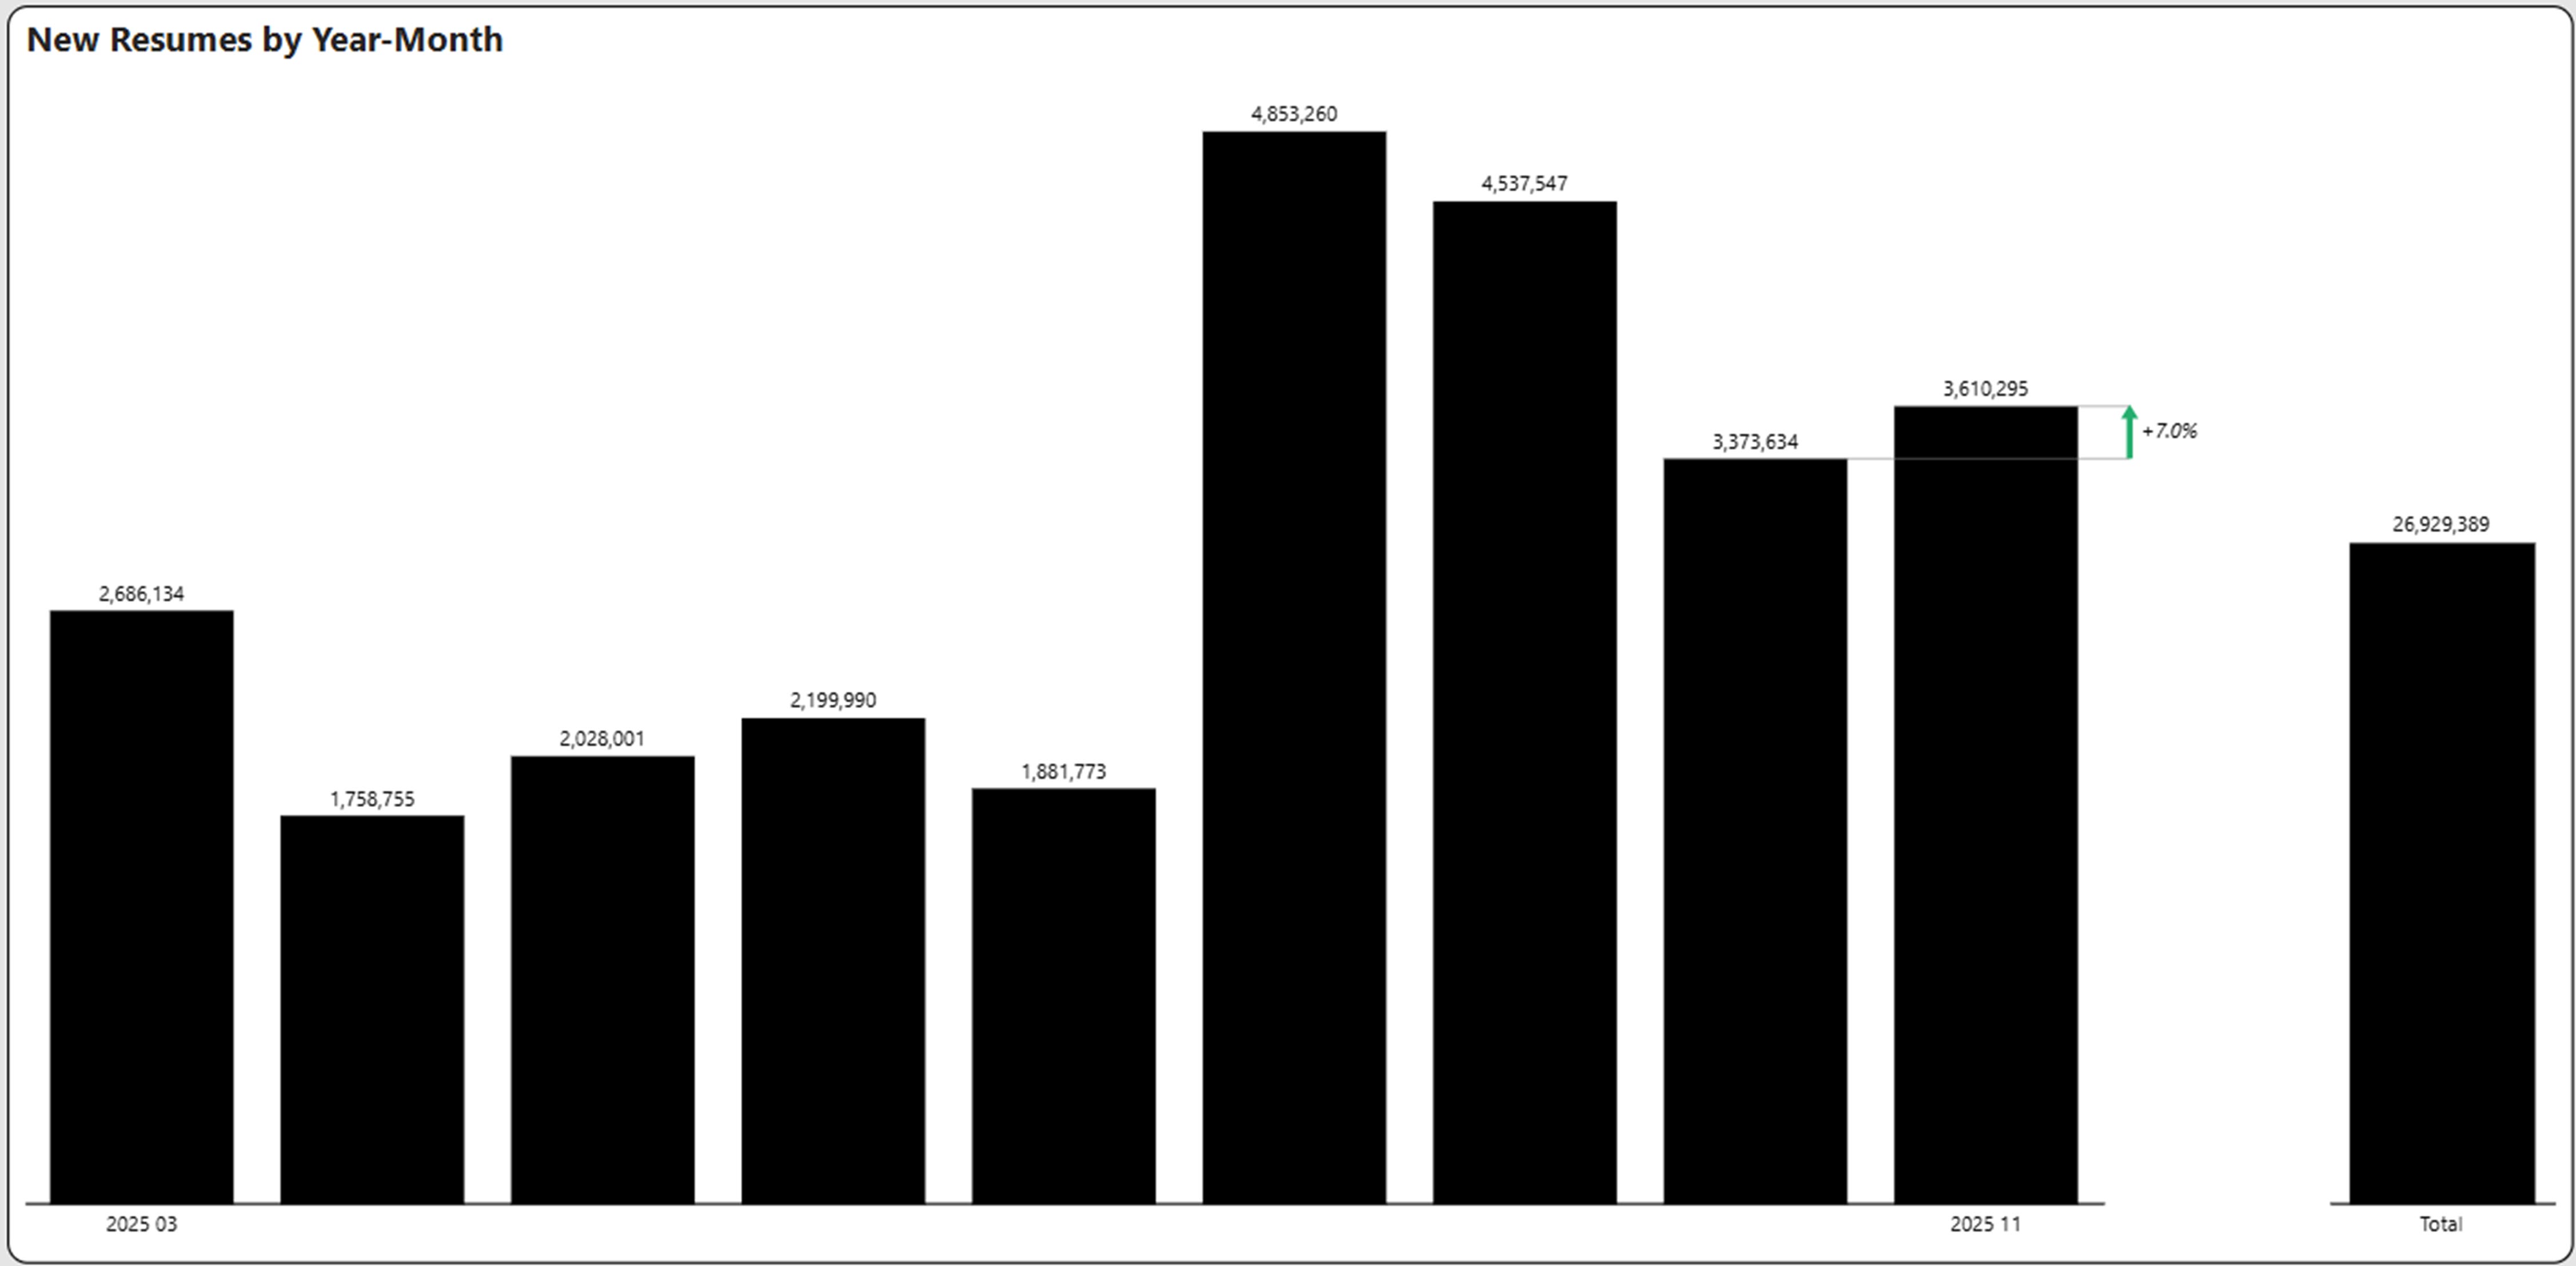
The total number of resumes over the trailing nine months increased 5.5% from 25.5 million to 26.9 million with the most recent month of November increasing 7% indicating job seeker interest (and perhaps some nervousness).
Supply/Demand by Industry Sector
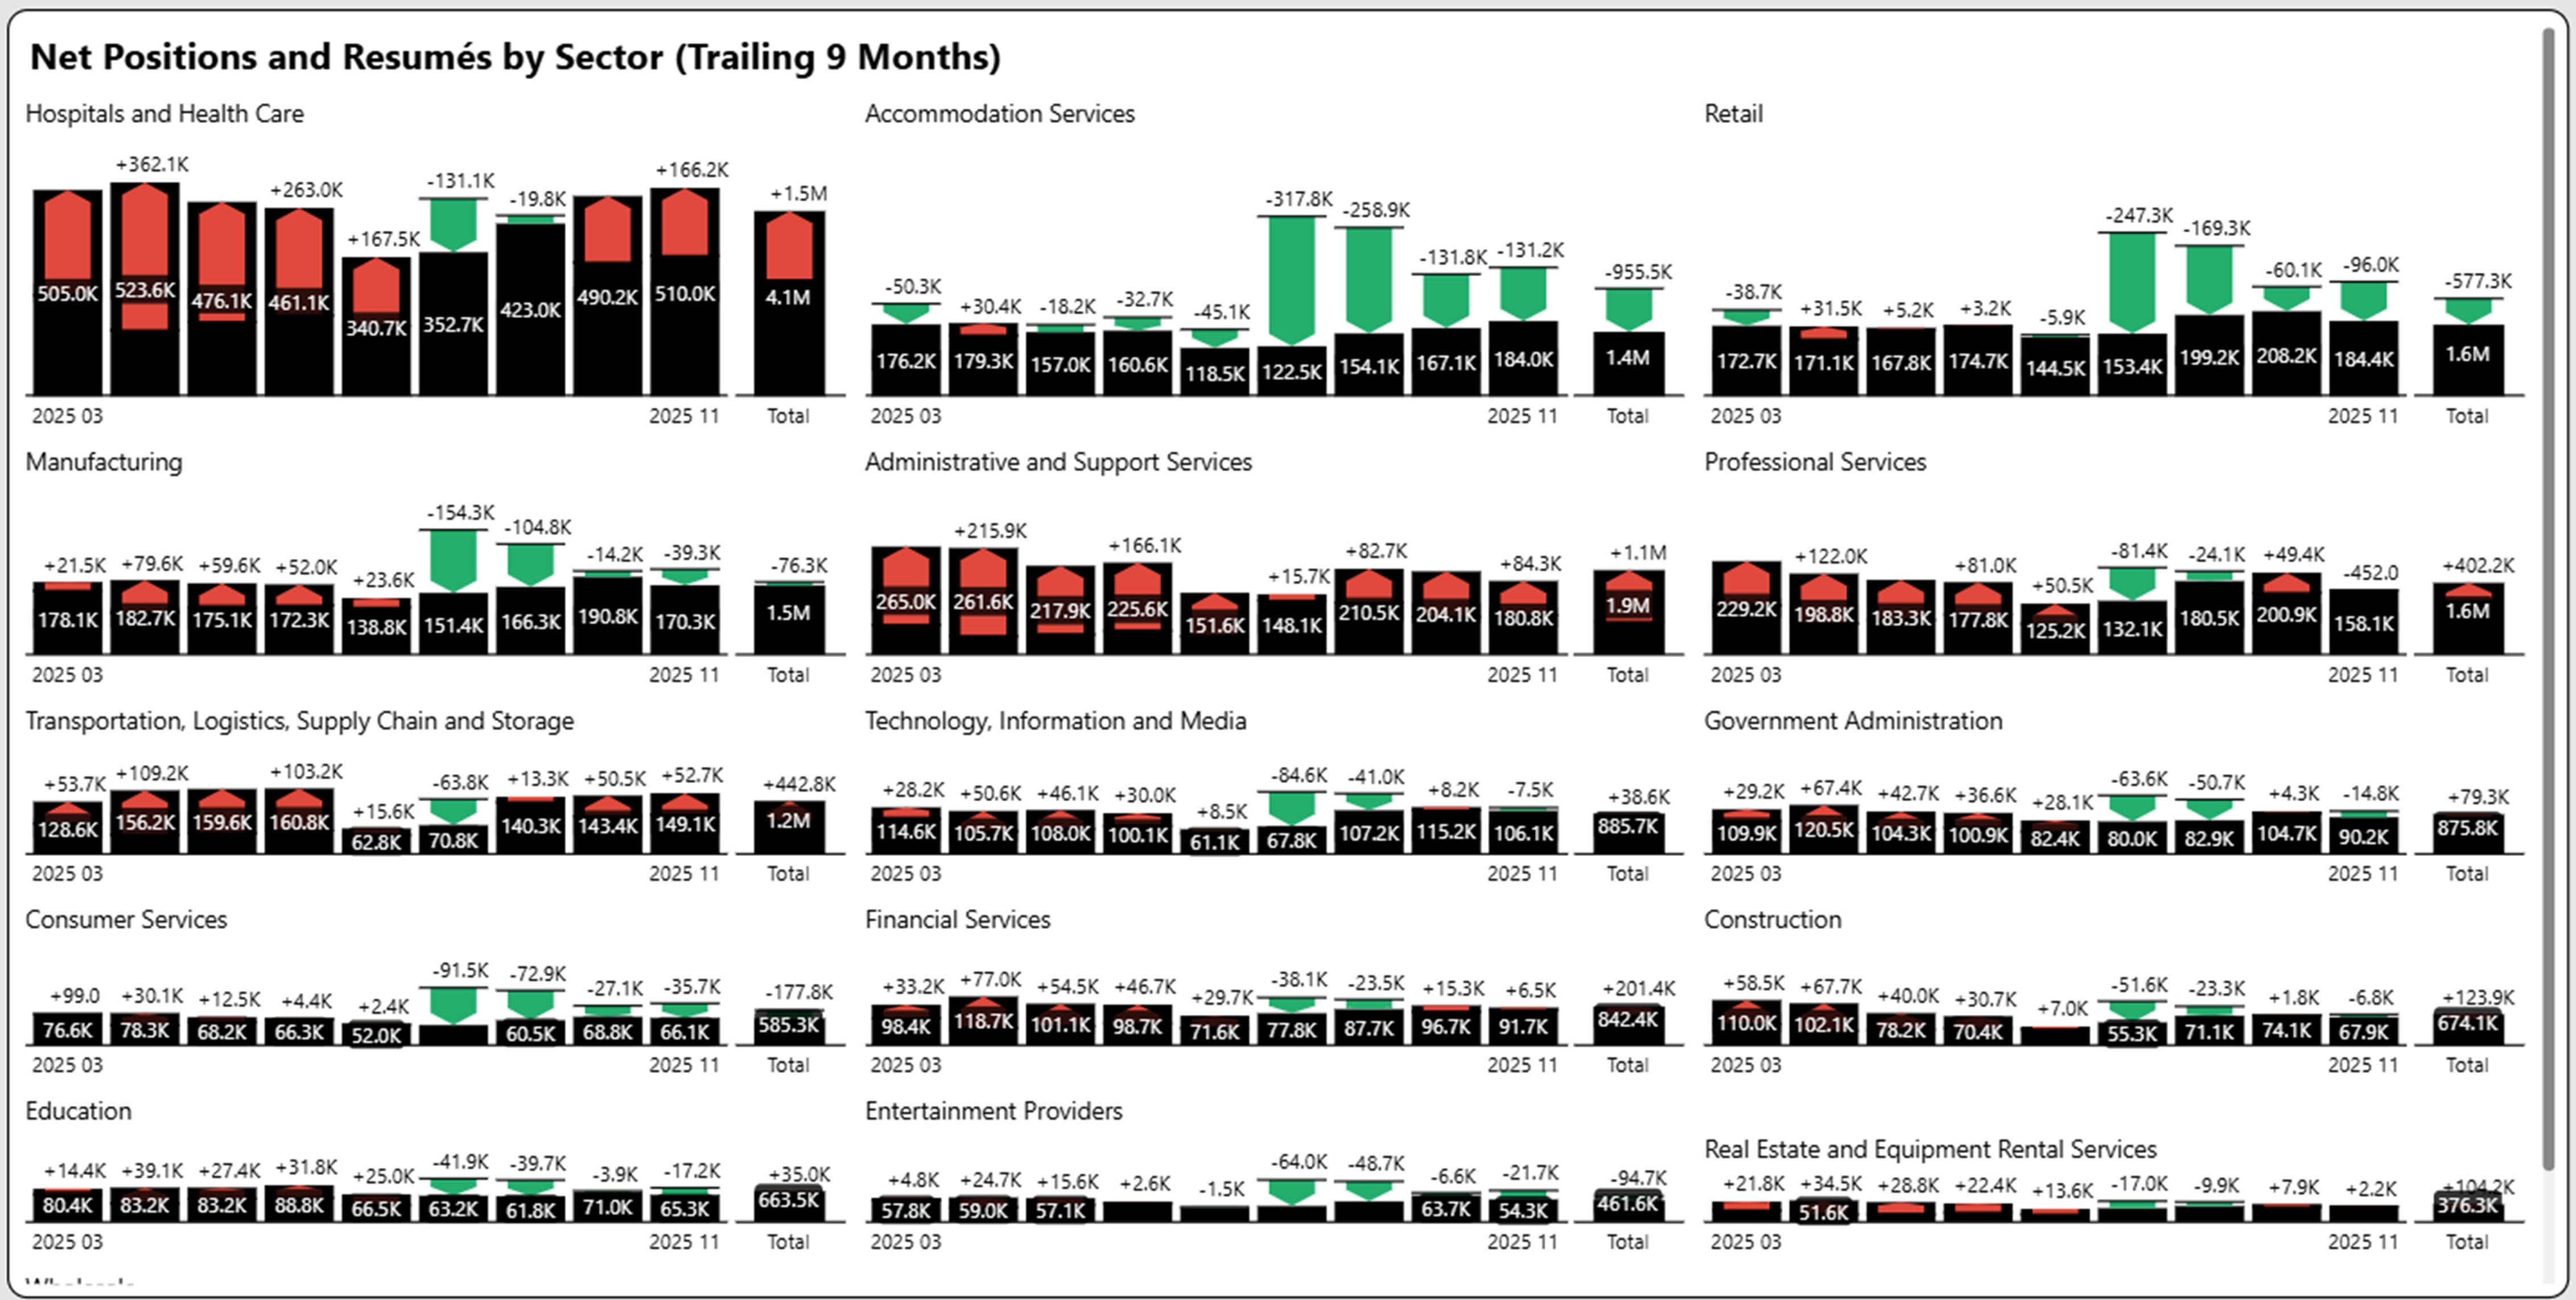
To highlight supply/demand imbalances, we superimpose job seekers based on resumés against net job positions (hires based on unique postings) in black bar. The graphs highlight supply surplus (more job seekers than net postings) shown in green or supply shortage (less job seekers than net postings) shown in red. We picked a time period of nine months, which highlights the current market surplus or shortage. The total bar reflects the summaries of openings and resumés for that time period.
In the graph below, we see that Administrative and Support Services and Healthcare sectors maintain their shortage trend. Professional Services, Financial Services and Transportation still have a slight unmet demand.
Supply/Demand Scorecard – Moving Towards Increased Supply
We highlight the current state at the end of November as well as the most recent changes over the last nine months. A change is not necessarily good or bad, but we have highlighted changes in supply/demand gaps that significantly impacts the current trends. Overall net positions for the trailing nine months decreased from 22.3 million to 21.8 million, and resumes significantly increased indicating further compression of the job market. All of the sector movement below is moving towards increasing supply availability.
| Sector | Current State | Previous State |
| Hospitals and Health Care | Heavy Unmet Demand | Heavy Unmet Demand |
| Accommodation Services | Heavy Oversupply | Moderate Oversupply |
| Retail | Moderate Oversupply | Moderate Oversupply |
| Professional Services | Moderate Unmet Demand | Moderate Unmet Demand |
| Manufacturing | Parity | Parity |
| Transportation, Logistics, … | Heavy Unmet Demand | Heavy Unmet Demand |
| Construction | Moderate Unmet Demand | Heavy Unmet Demand |
| Technology, Information, … | Parity | Slight Unmet Demand |
| Financial Services | Moderate Unmet Demand | Heavy Unmet Demand |
| Education | Parity | Moderate Unmet Demand |
| Consumer Services | Moderate Oversupply | Parity |
| Entertainment Providers | Slight Oversupply | Parity |
| Wholesale | Parity | Moderate Unmet Demand |
| Administrative and Support Services | Heavy Unmet Demand | Heavy Unmet Demand |
Worker Sentiment
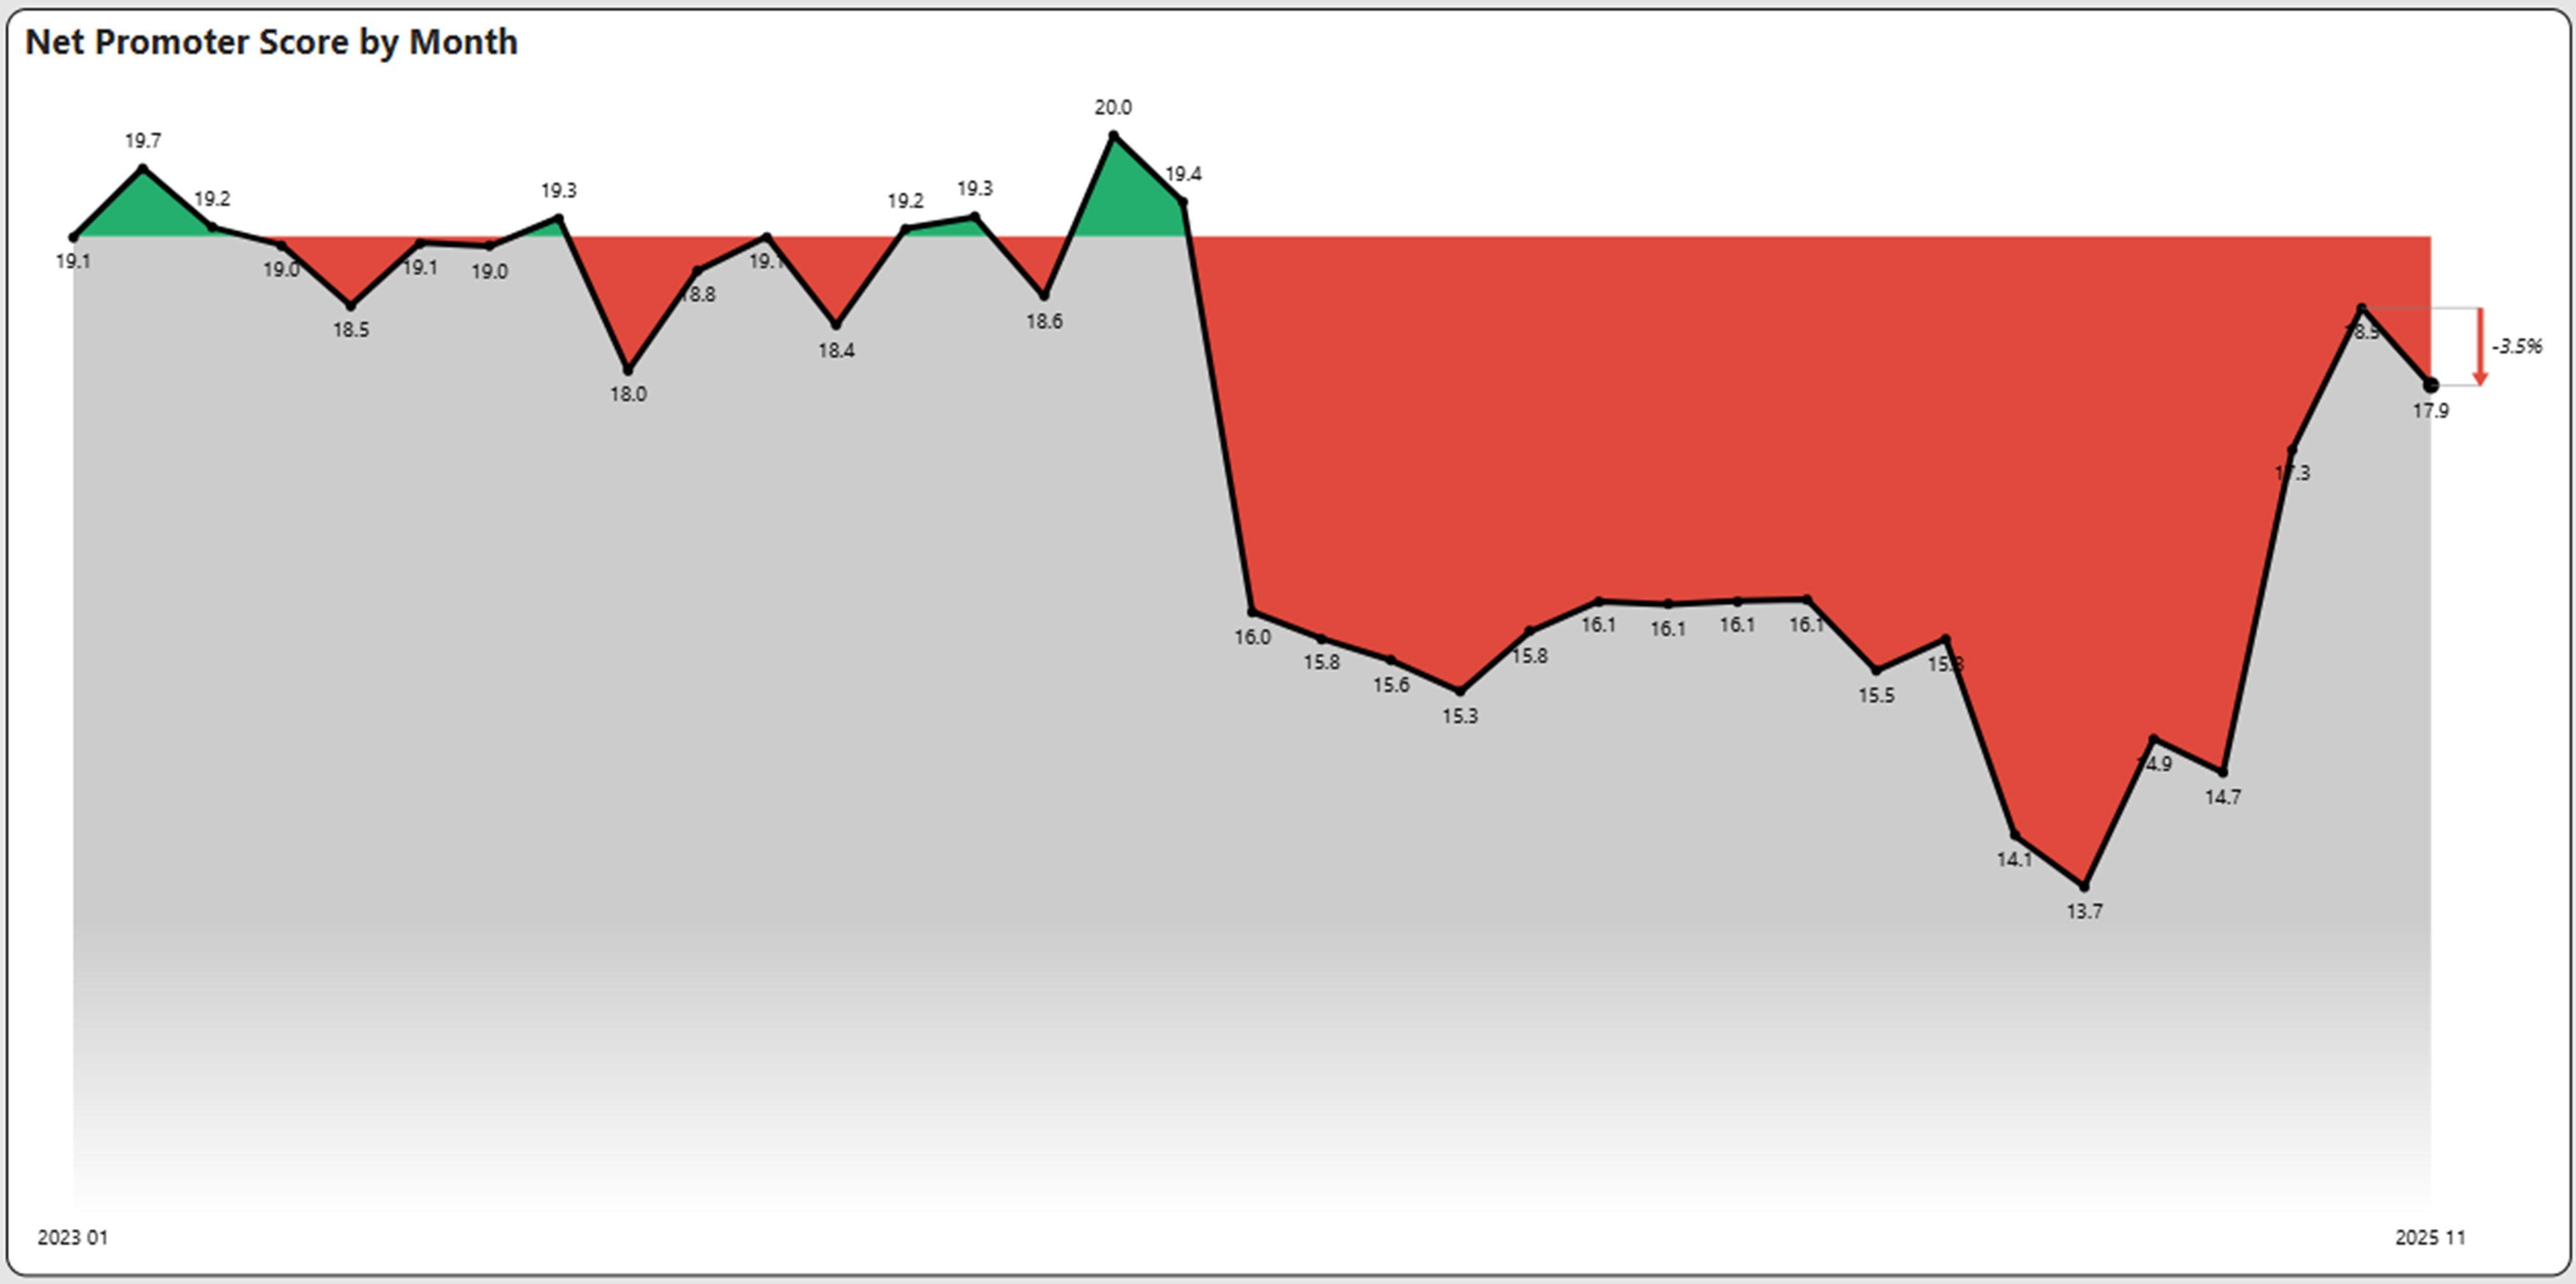
Net Promoter Score (NPS)
NPS reversed its upward trend, dipping slightly in November.
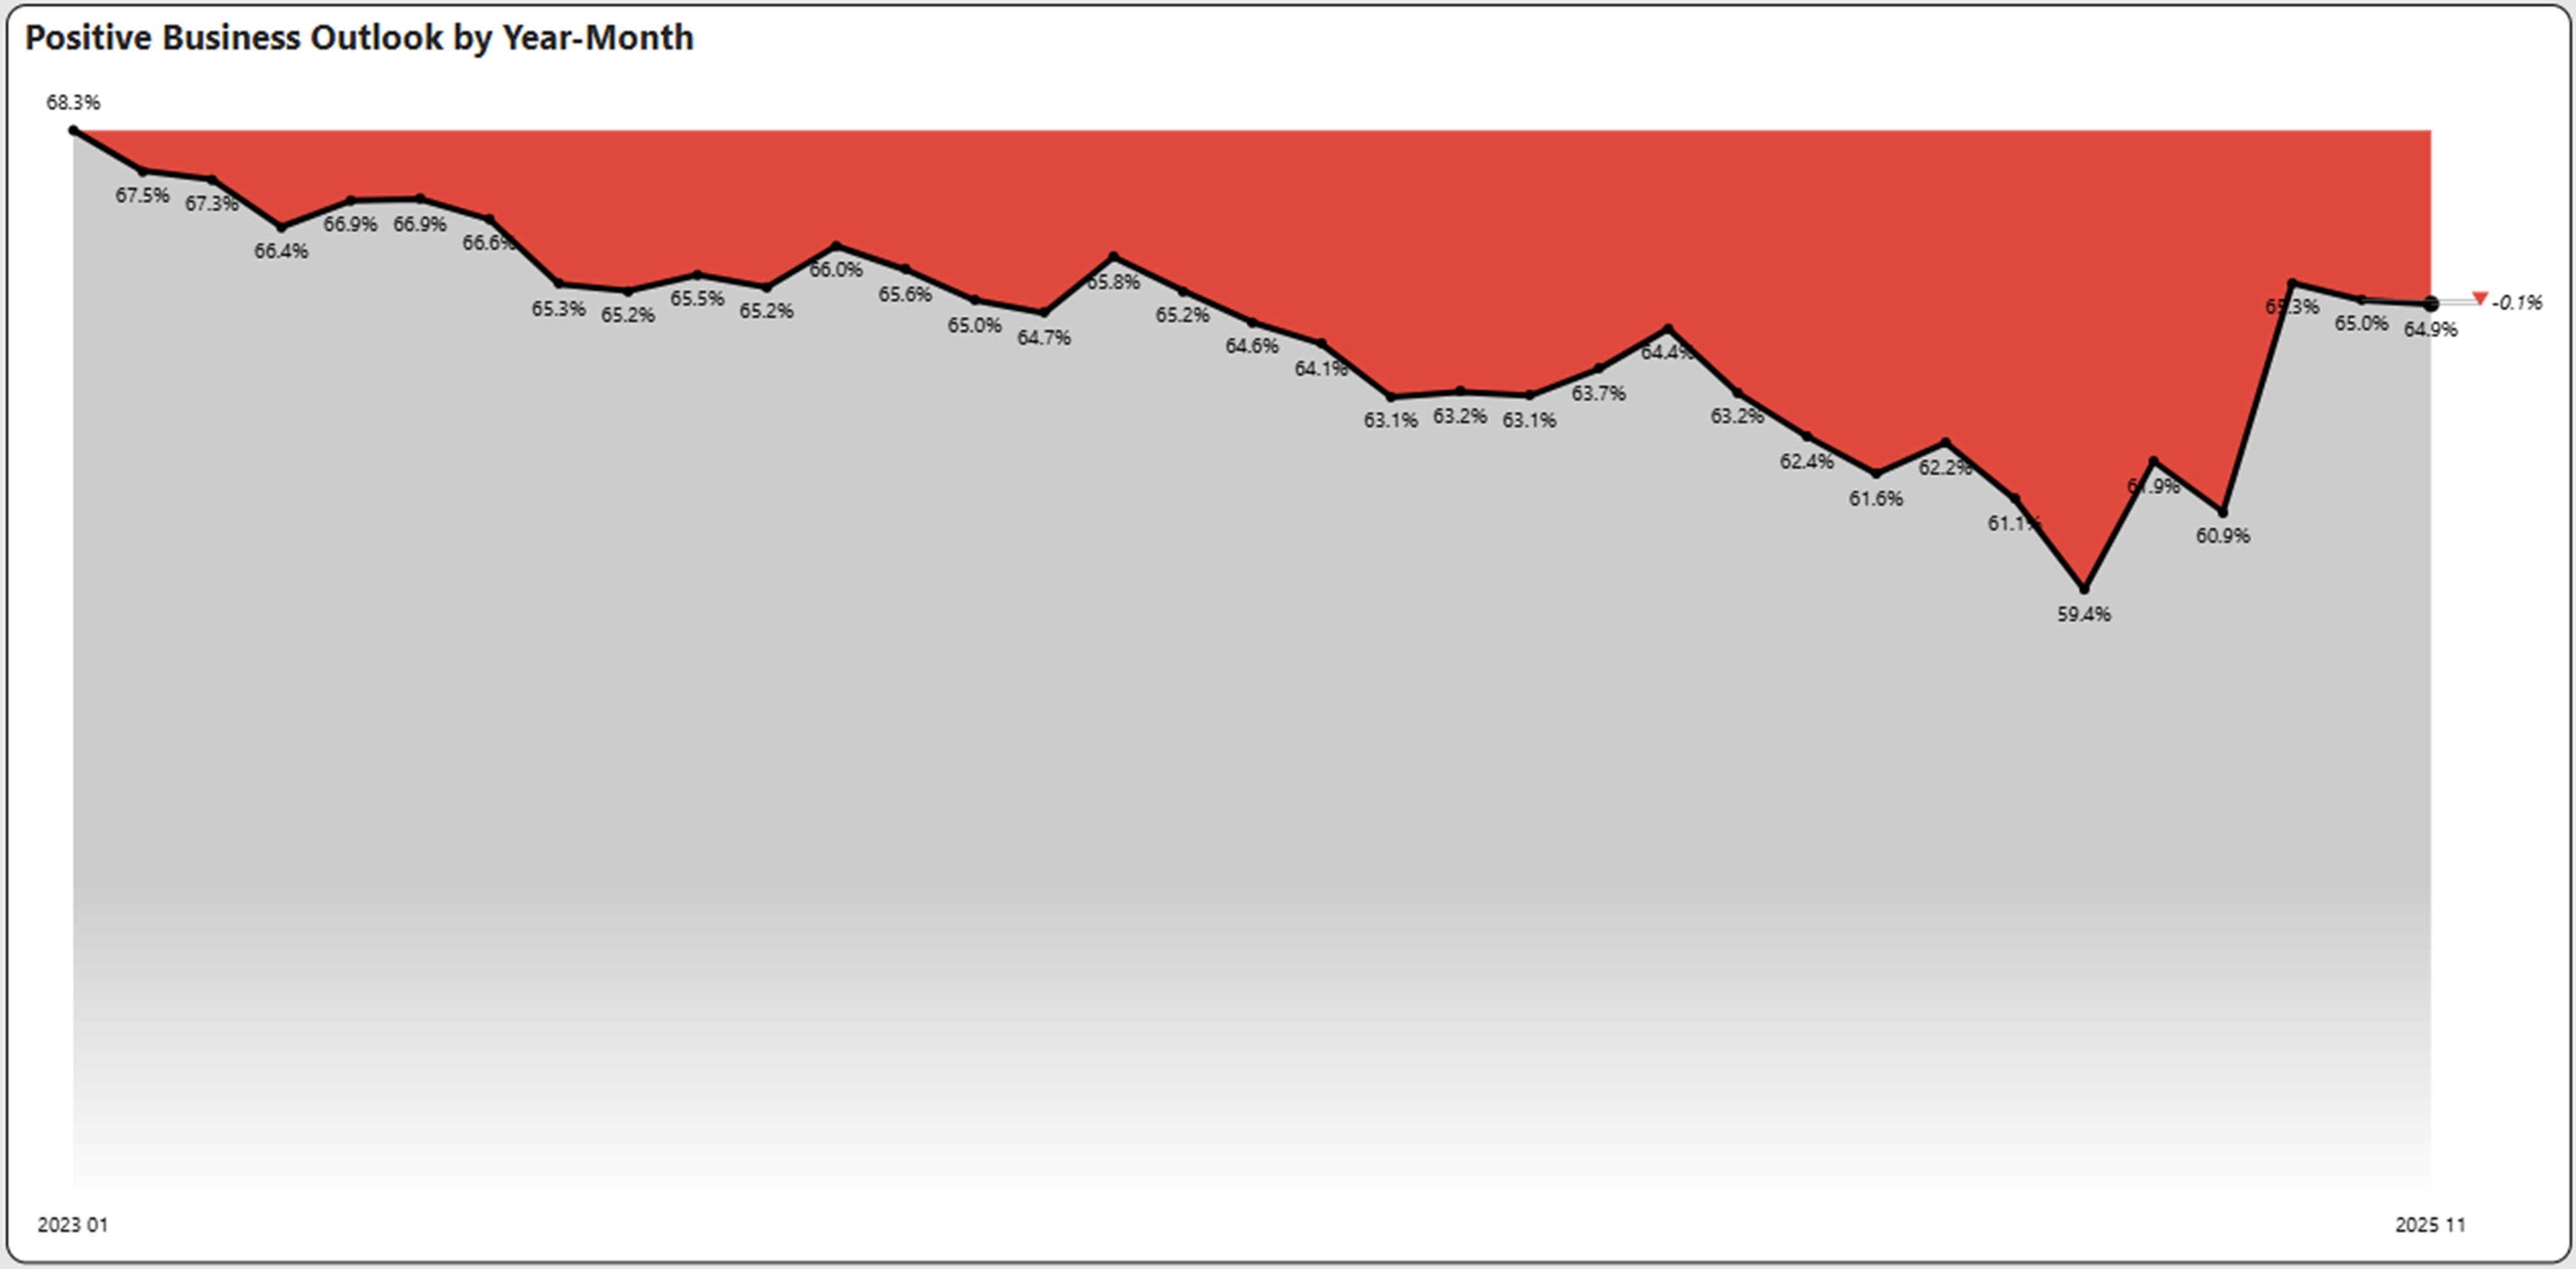
Positive Business Outlook
Outlook, based on Glassdoor reviews, remained flat for the second straight month in November after a substantial improvement in September. Positive Business Outlook is well above the three-year low of 59.4% in June 2025 and currently stands at 64.9%.
Labor Market
Key Labor Market Takeaways
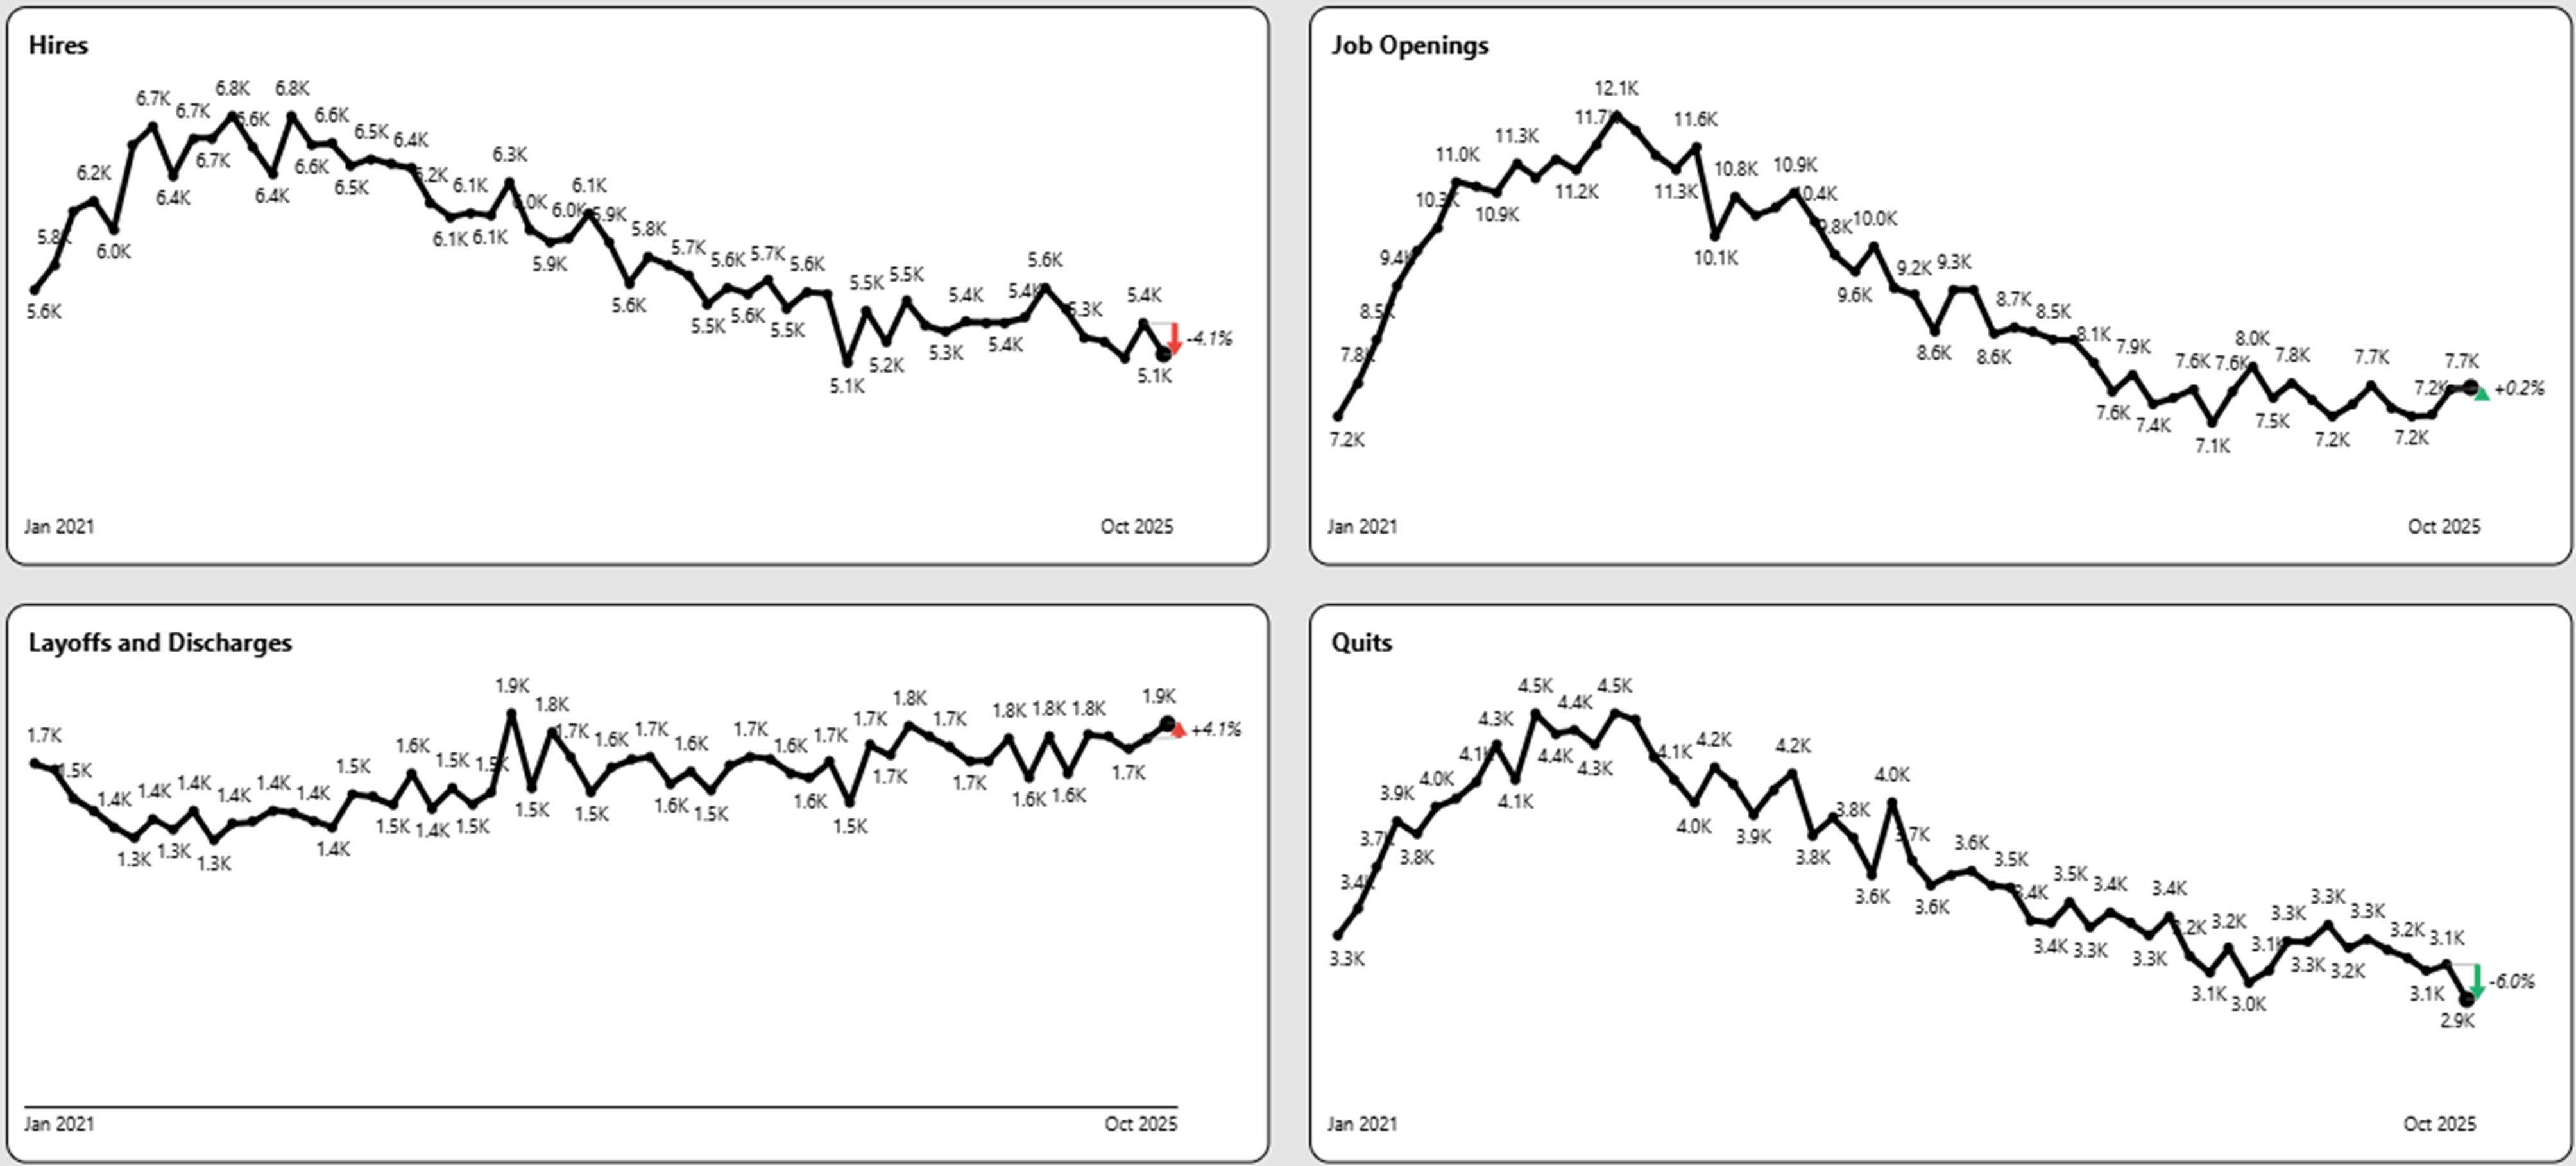
Quits are at a five-year low at 2.9 million and the quit rate at 1.8% is at a ten-year low excluding the COVID-19 impact. This is a almost half of the peak quit rate of April 2022.Posting Volume Declines YoY Continue
Hires declined 4.1% in October from 5.4 million to 5.1 million. This is the lowest point for hires in the past five years and 25% below the peak in February 2022.
Openings were flat in October at 7.7 million but 36% below the high point of 12.1 million jobs. However it is 8% above the floor of 7.1 million openings.
Layoffs and Discharges increased 4.1% in October and is at the five-year highwater mark. However layoffs are still well within historical levels despite the tightness of the labor market.
If You Liked the November 2025 Jobs Report – Get More Insights!
Try Our Free Version of TalentView to Get Instant Compensation, Postings, and Fill Days By Title, Company and Location (No Sign Up Required)
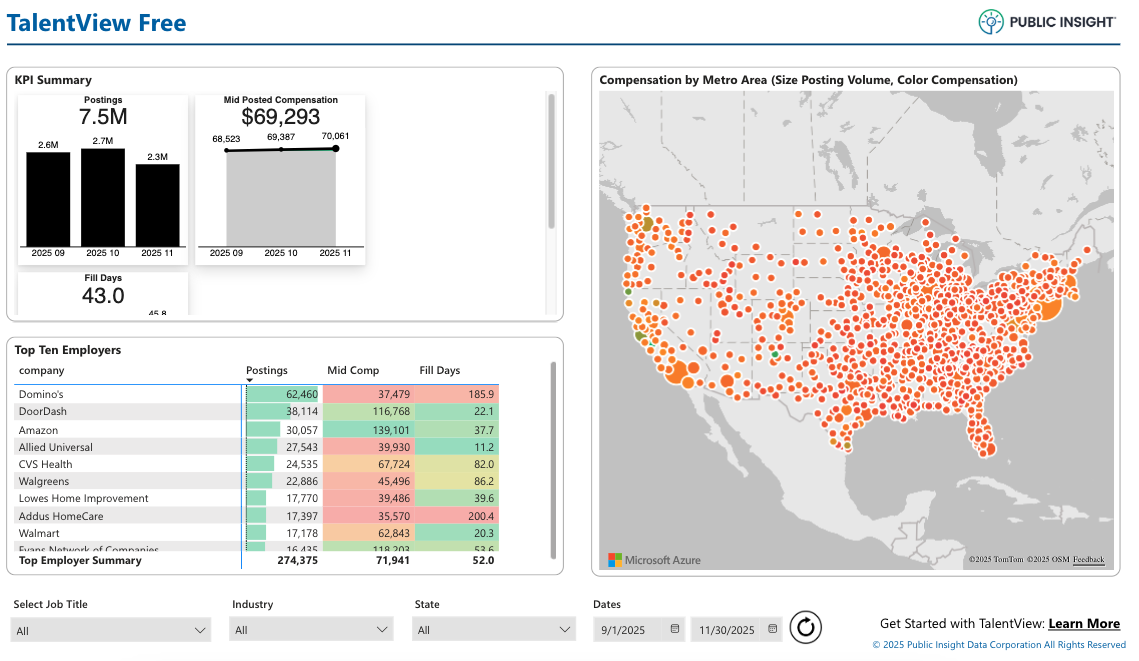
Example Insight: Employers with the most job postings Sept-Nov, 2025.
Current Competitive and Market Talent Intelligence is a Powerful Tool
What is TalentView?
Public Insight develops TalentView, a talent market intelligence solution that generated these insights. The most current and detailed insights are available by title, employer, location, industry and more. We provide flexible ways to utilize talent market intelligence, which include data licensing, interactive dashboards and reports.
How Can Our Must-Have Market Insights Help You?
- Inform/Justify Recruiting Decisions and Utilize Data to Tell Your Story
- Inform Recruitment Marketing Budgets, Strategies and Priorities
- Benchmark Employers Against Competitors
- Enhance Your Solution Offering (Solution Providers)
- Identify Business Development Opportunities (Solution Providers)
- Develop Content for Account Management and Marketing (Solution Providers)
Get Started!
Schedule a Call – Let’s discuss and demonstrate how you can leverage talent market data and insights
Sign Up for a Trial – Try out our interactive dashboards or get sample data