How Long Should You Wait in the Emergency Room?

We recently had a health scare where a family member spent over 12 hours in the emergency room. While she was not thrilled to spend so much time there, she did ultimately get good medical care. So what is excessive time in the emergency room?


Centers for Medicare & Medicaid Services (CMS) publishes a quality score which looks at average time in the emergency room. In fact, there are multiple measures of emergency wait times. The average patient waits a little over four hours (based on 4,822 hospitals) in the emergency room before being sent home. What is really curious is some of the longer wait times. There are seven hospitals where the average wait time is over 1,000 minutes or over 16 hours capped by Bayshore Medical Center in Texas where the average wait time is nearly 33 hours. More and more facilities like Bayshore are publishing their current wait times (like TSA at the airport). 


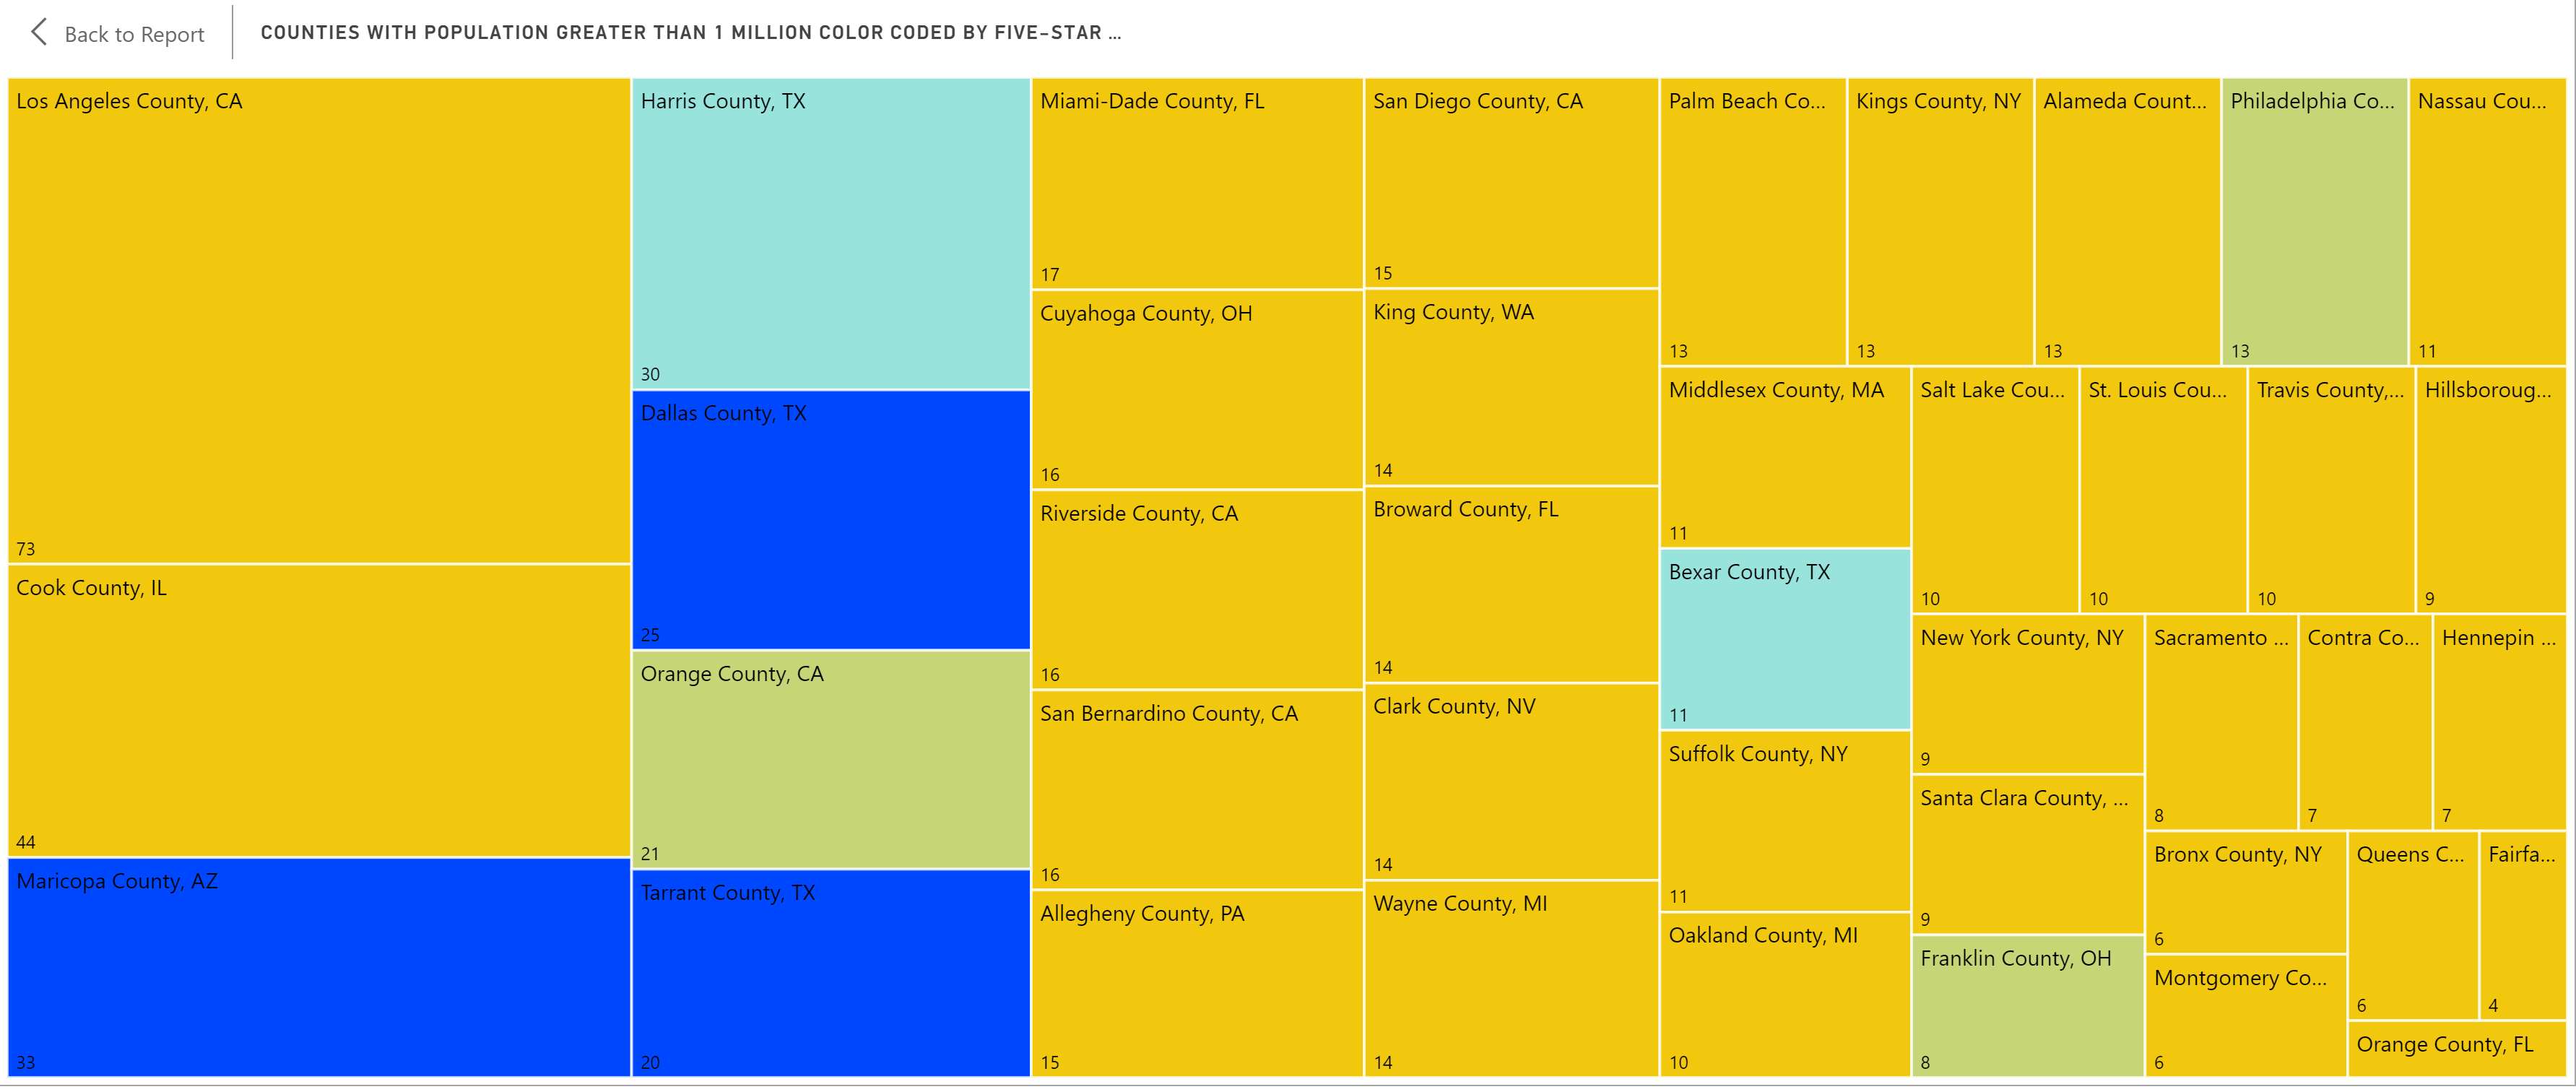
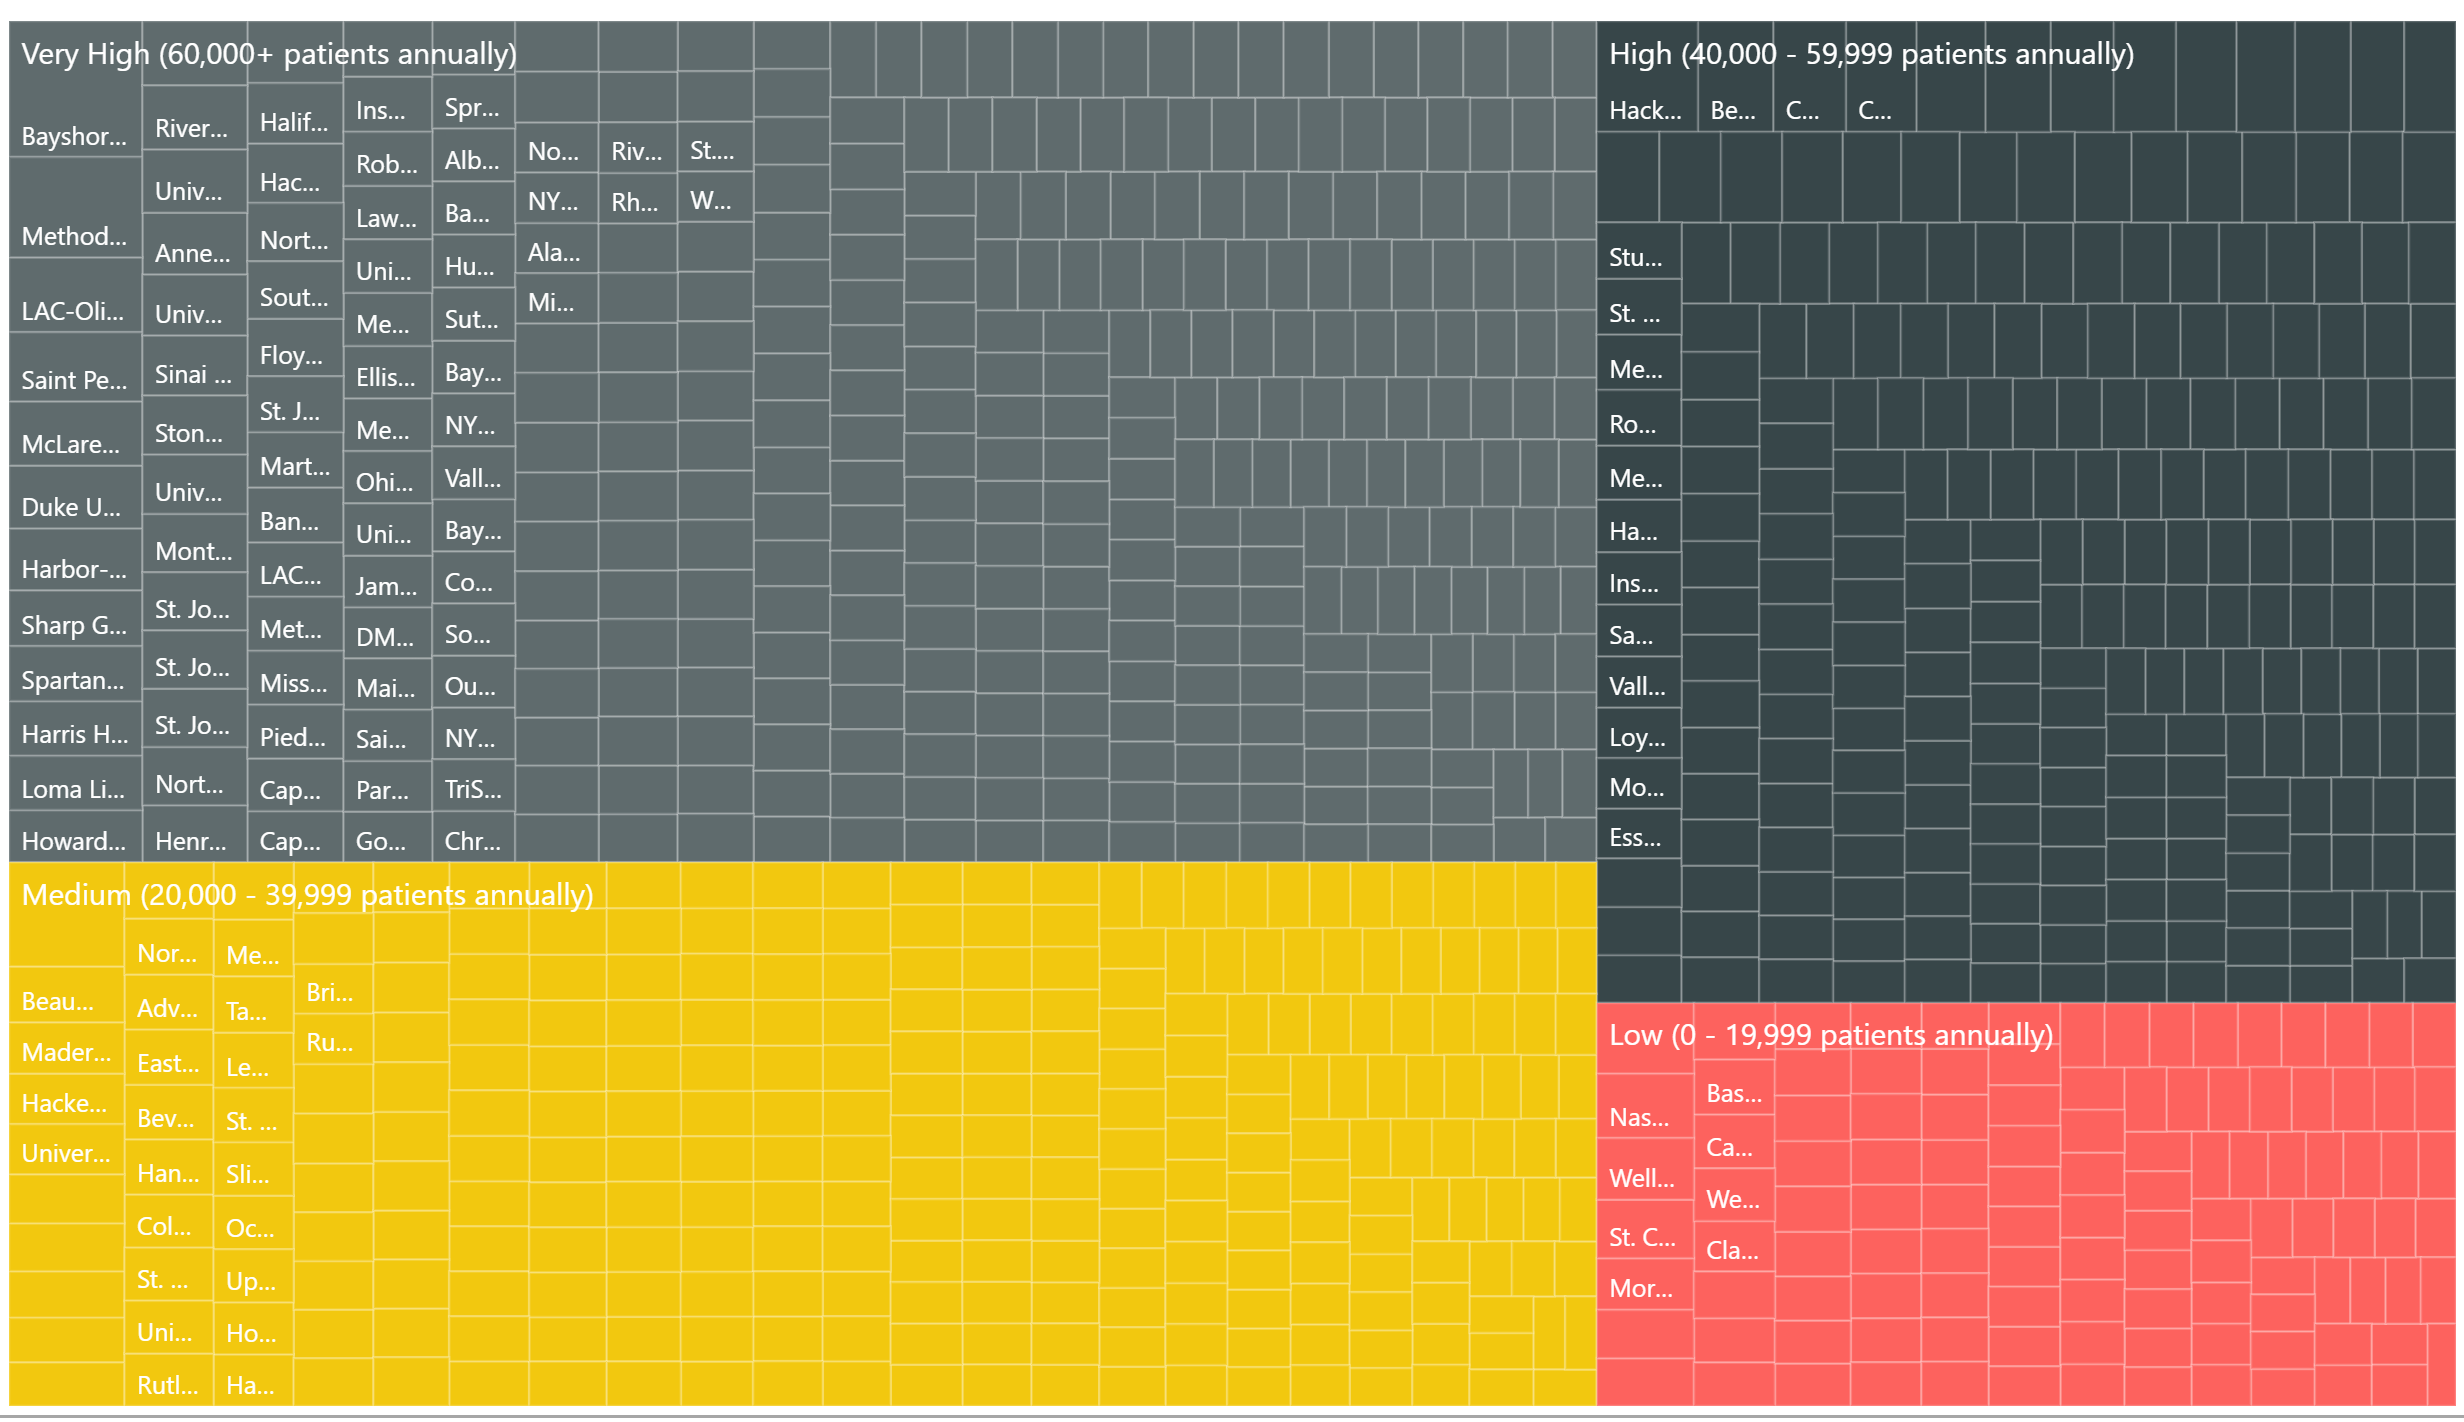
Just like the busiest airports, the busiest emergency rooms tend to have the longest wait times. The treemap below shows a visual image of the hospitals with above average wait times. As you can see, about 70% have high or very high volume as defined by CMS. So as you think about time in the emergency room, ultimately you probably want to think in terms of care first (even as you grow impatient).


Share This Story

Similar Posts

  • On Faculty Compensation and Gender Disparity

    It will take many years for the faculty gender pay gap to close at the current rate of change. From 2014 to 2015, women received around half a percent higher pay increase from men over the various institutional sectors. There is still a 16% and 14% gender pay gap for full professors…

  • Rural Hospitals are Five-Star According to CMS

    Los Angeles County, CA and Cook County, IL (Chicago) have 117 CMS rated hospitals between them and over 15 million residents. Yet, there is not a single five-star hospital in either county. In this mini-series, we have examined the profile of the current 188 five-star hospitals as it marks its…

  • Students Moving Back on Campus

    The number of students living on-campus for the approximately 4,500 non-state institutions has increased from just over 43% in 2011 to nearly 53% just four years later in 2015. The pie graph below shows the movement from 2011 to 2015 with the yellow slice indicating the percentage of students living…

  • Hot Educational Programs in 2018

    Econometrics Programs Show Nearly Triple Digit Growth I am delighted to return to the blogosphere community. It has been a few months since we have published a blog, but not for a lack of work going on behind the scenes here at Public Insight. You will notice that our blog…

  • CMS Releases 2016 Opioid Prescription Data

    This week, CMS released 2016 Opioid Part D Prescribing Rates data which follows on the heels of the original release several months ago. This data release includes Opioid prescriber, claims, and extended release claims at the national, state, county, and zip code level. We have updated our Opioid Prescribing Rates…

  • Violence Against Women Offenses Up 9.5%

    This is the third year that the Campus Safety and Security (CSS) data has released separate violence against women (VAW) offenses. This data captures three types of offenses; domestic violence, dating violence, and stalking and analyzes it for both on campus and off campus locations. Overall, there were 16,183 VAW…