Public Insight’s February 2026 Jobs Report summarizes market insights from the millions of job postings, resumé updates and employer ratings/reviews available in our TalentView talent market intelligence platform.
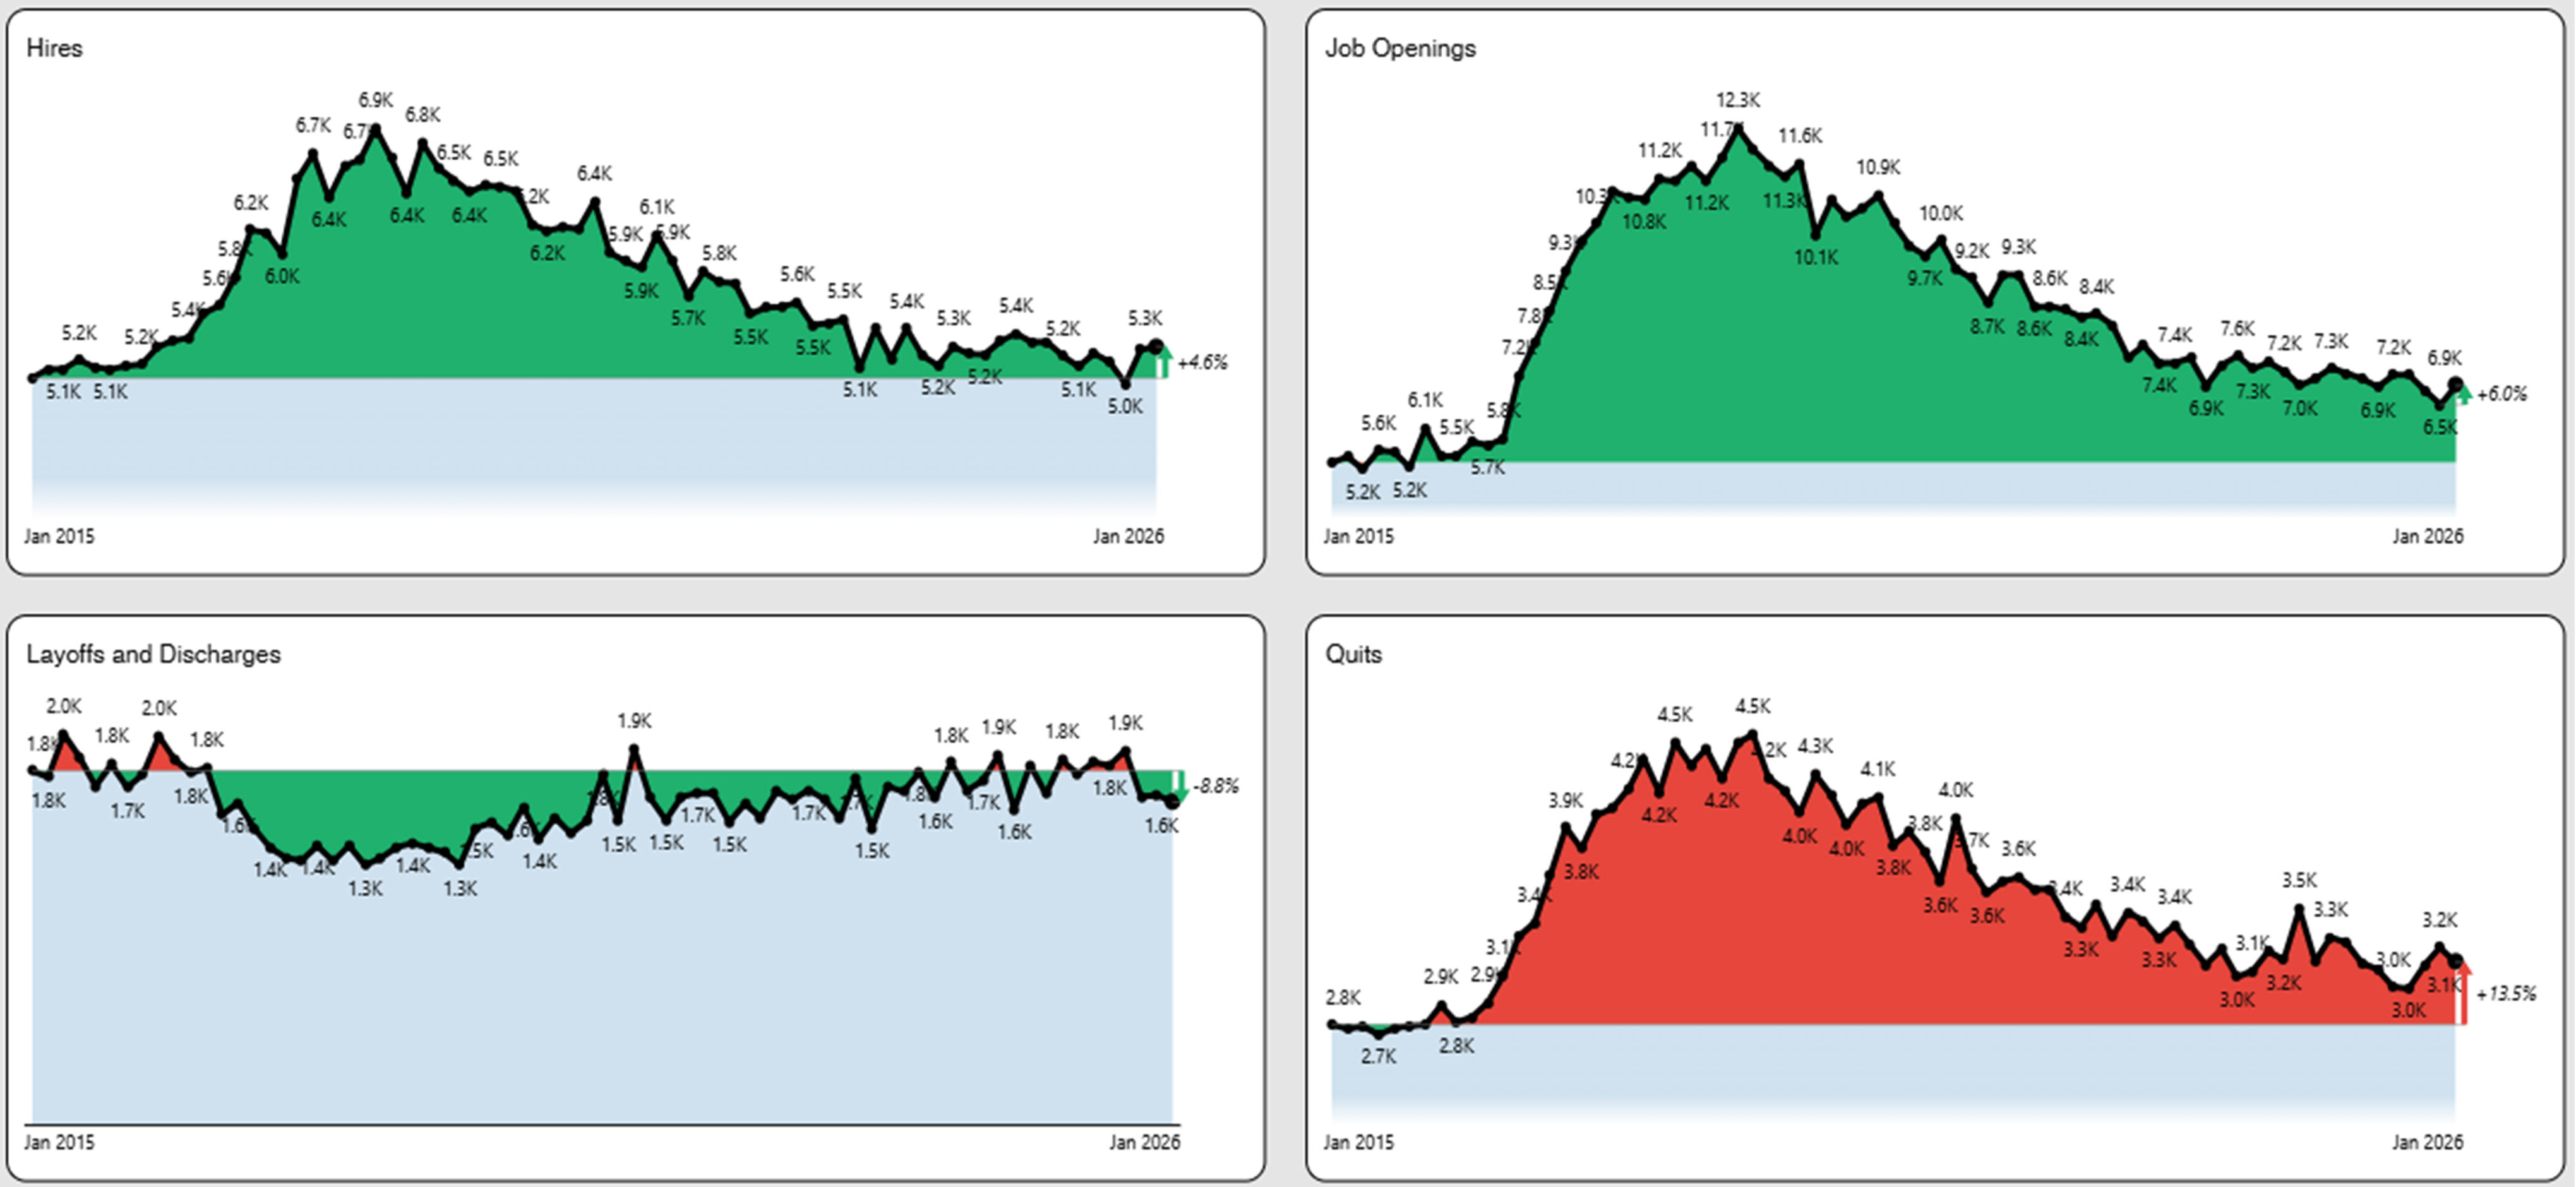
Summary Dashboard – February 2026 Jobs Report
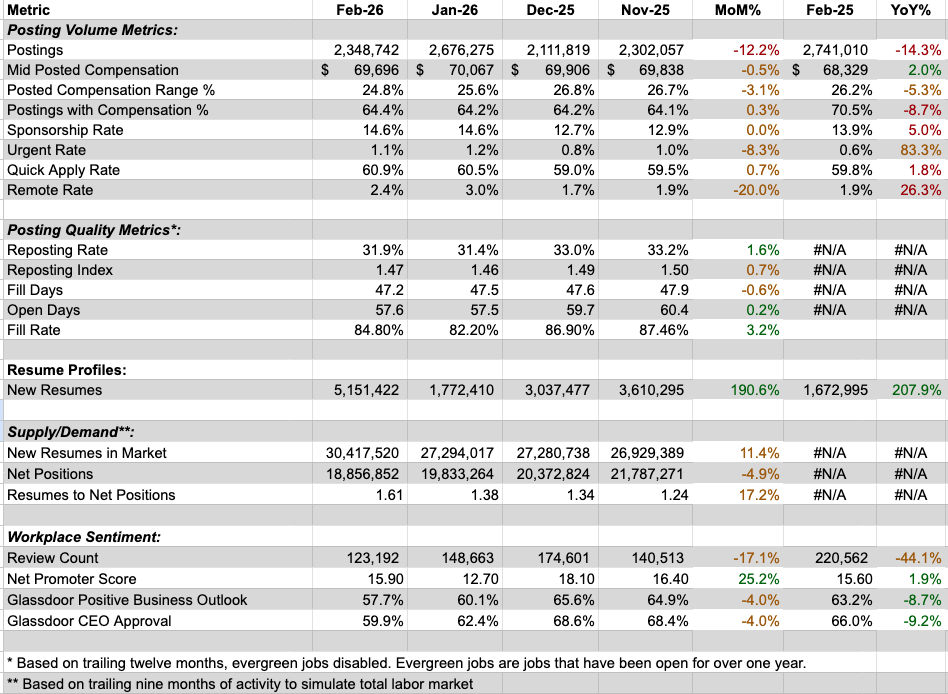
Comparison of Key Metrics to the Last Three Months and Prior Year
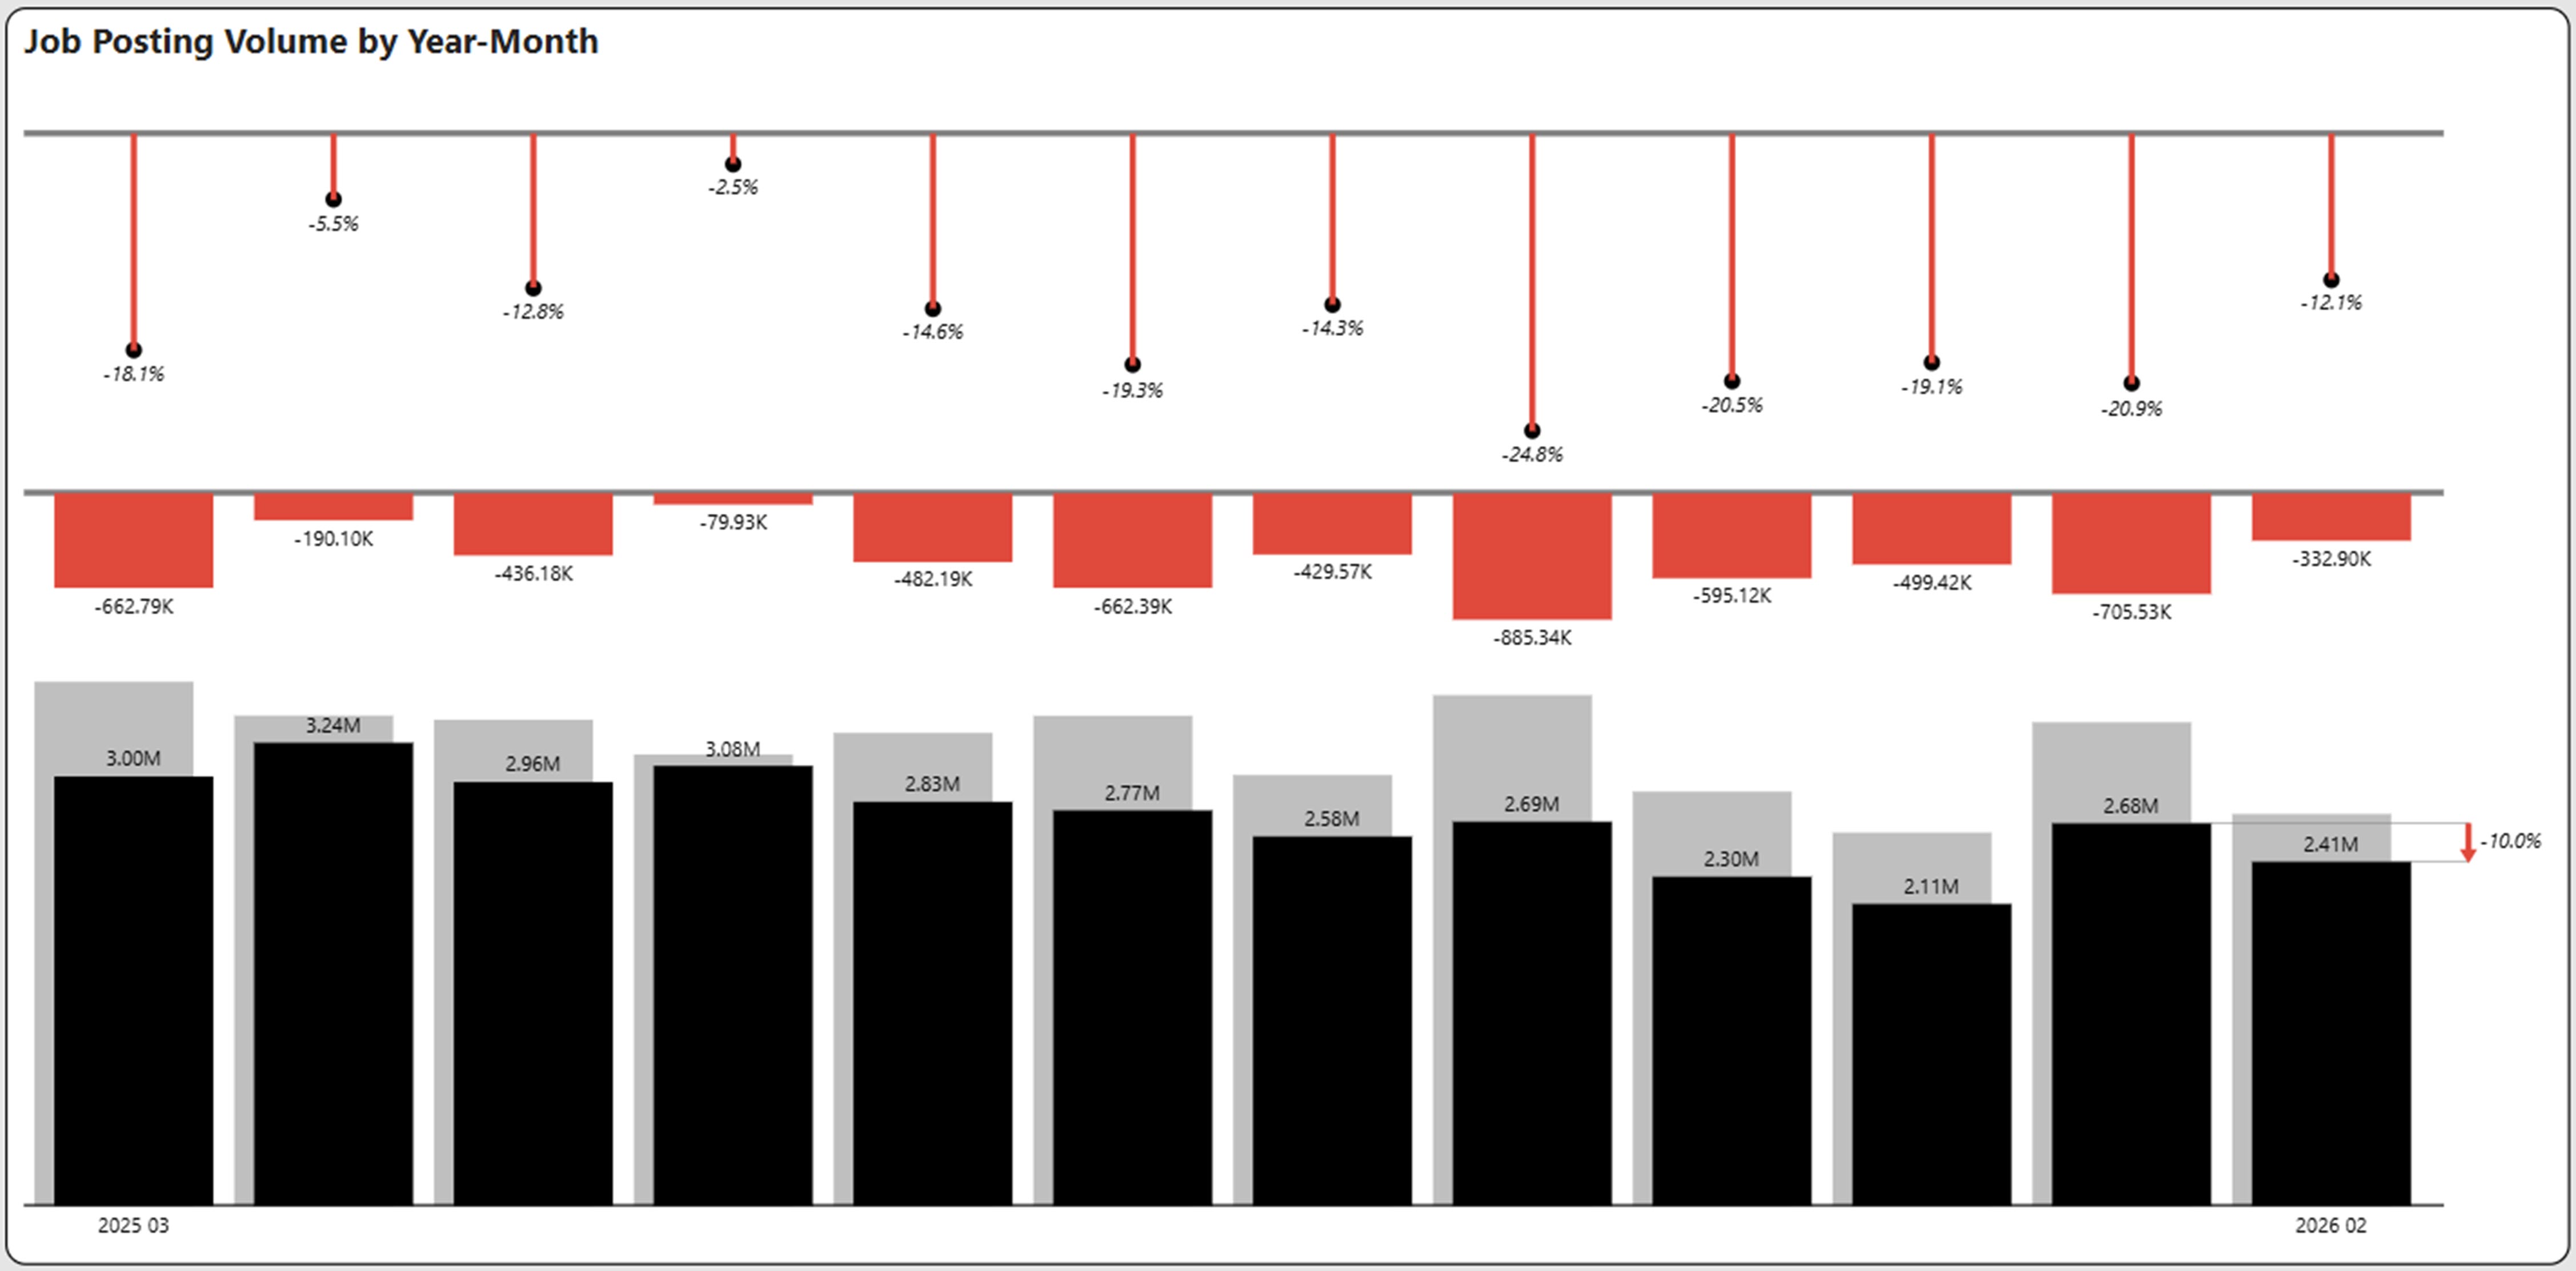
Postings
YOY Declining Posting Volume Continues
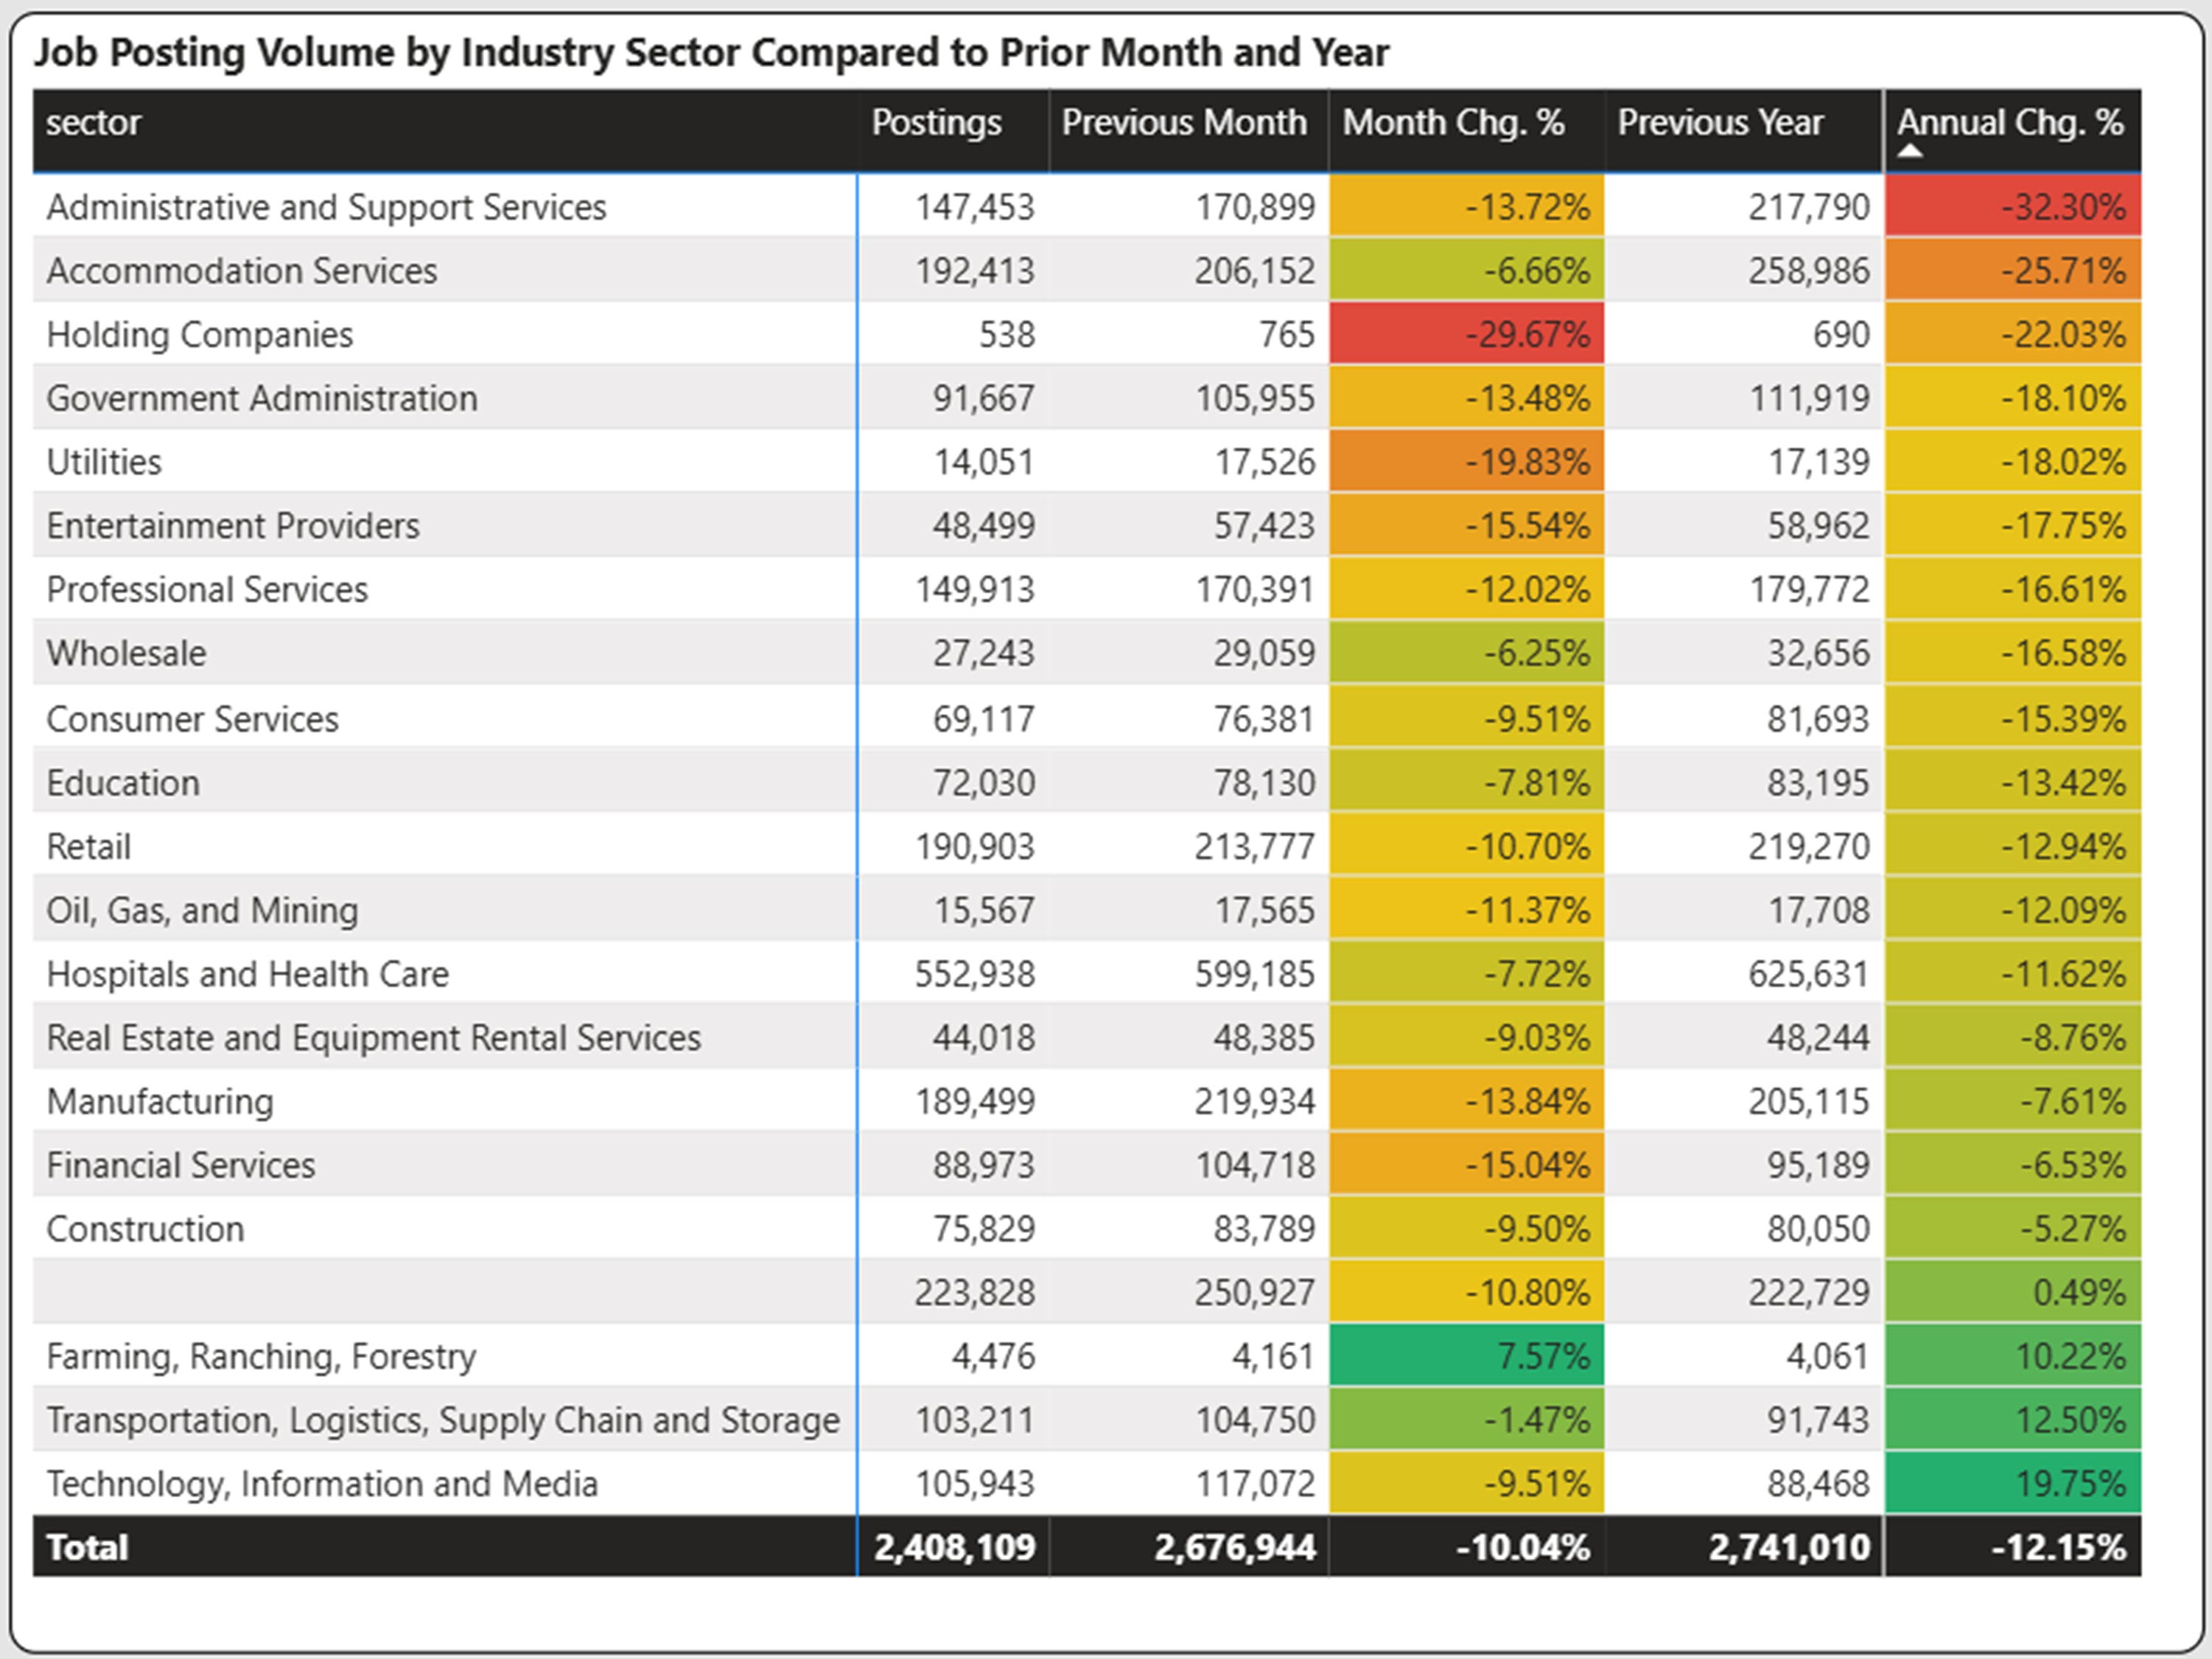
February job postings declined 12.1% from the same period last year to 2.41 million. Year-over-year declines have become consistent in the current job market. However, this decline was the third lowest over the past twelve months. February postings decreased 10% compared to January.
Industry Posting Analysis
Sponsored Rates
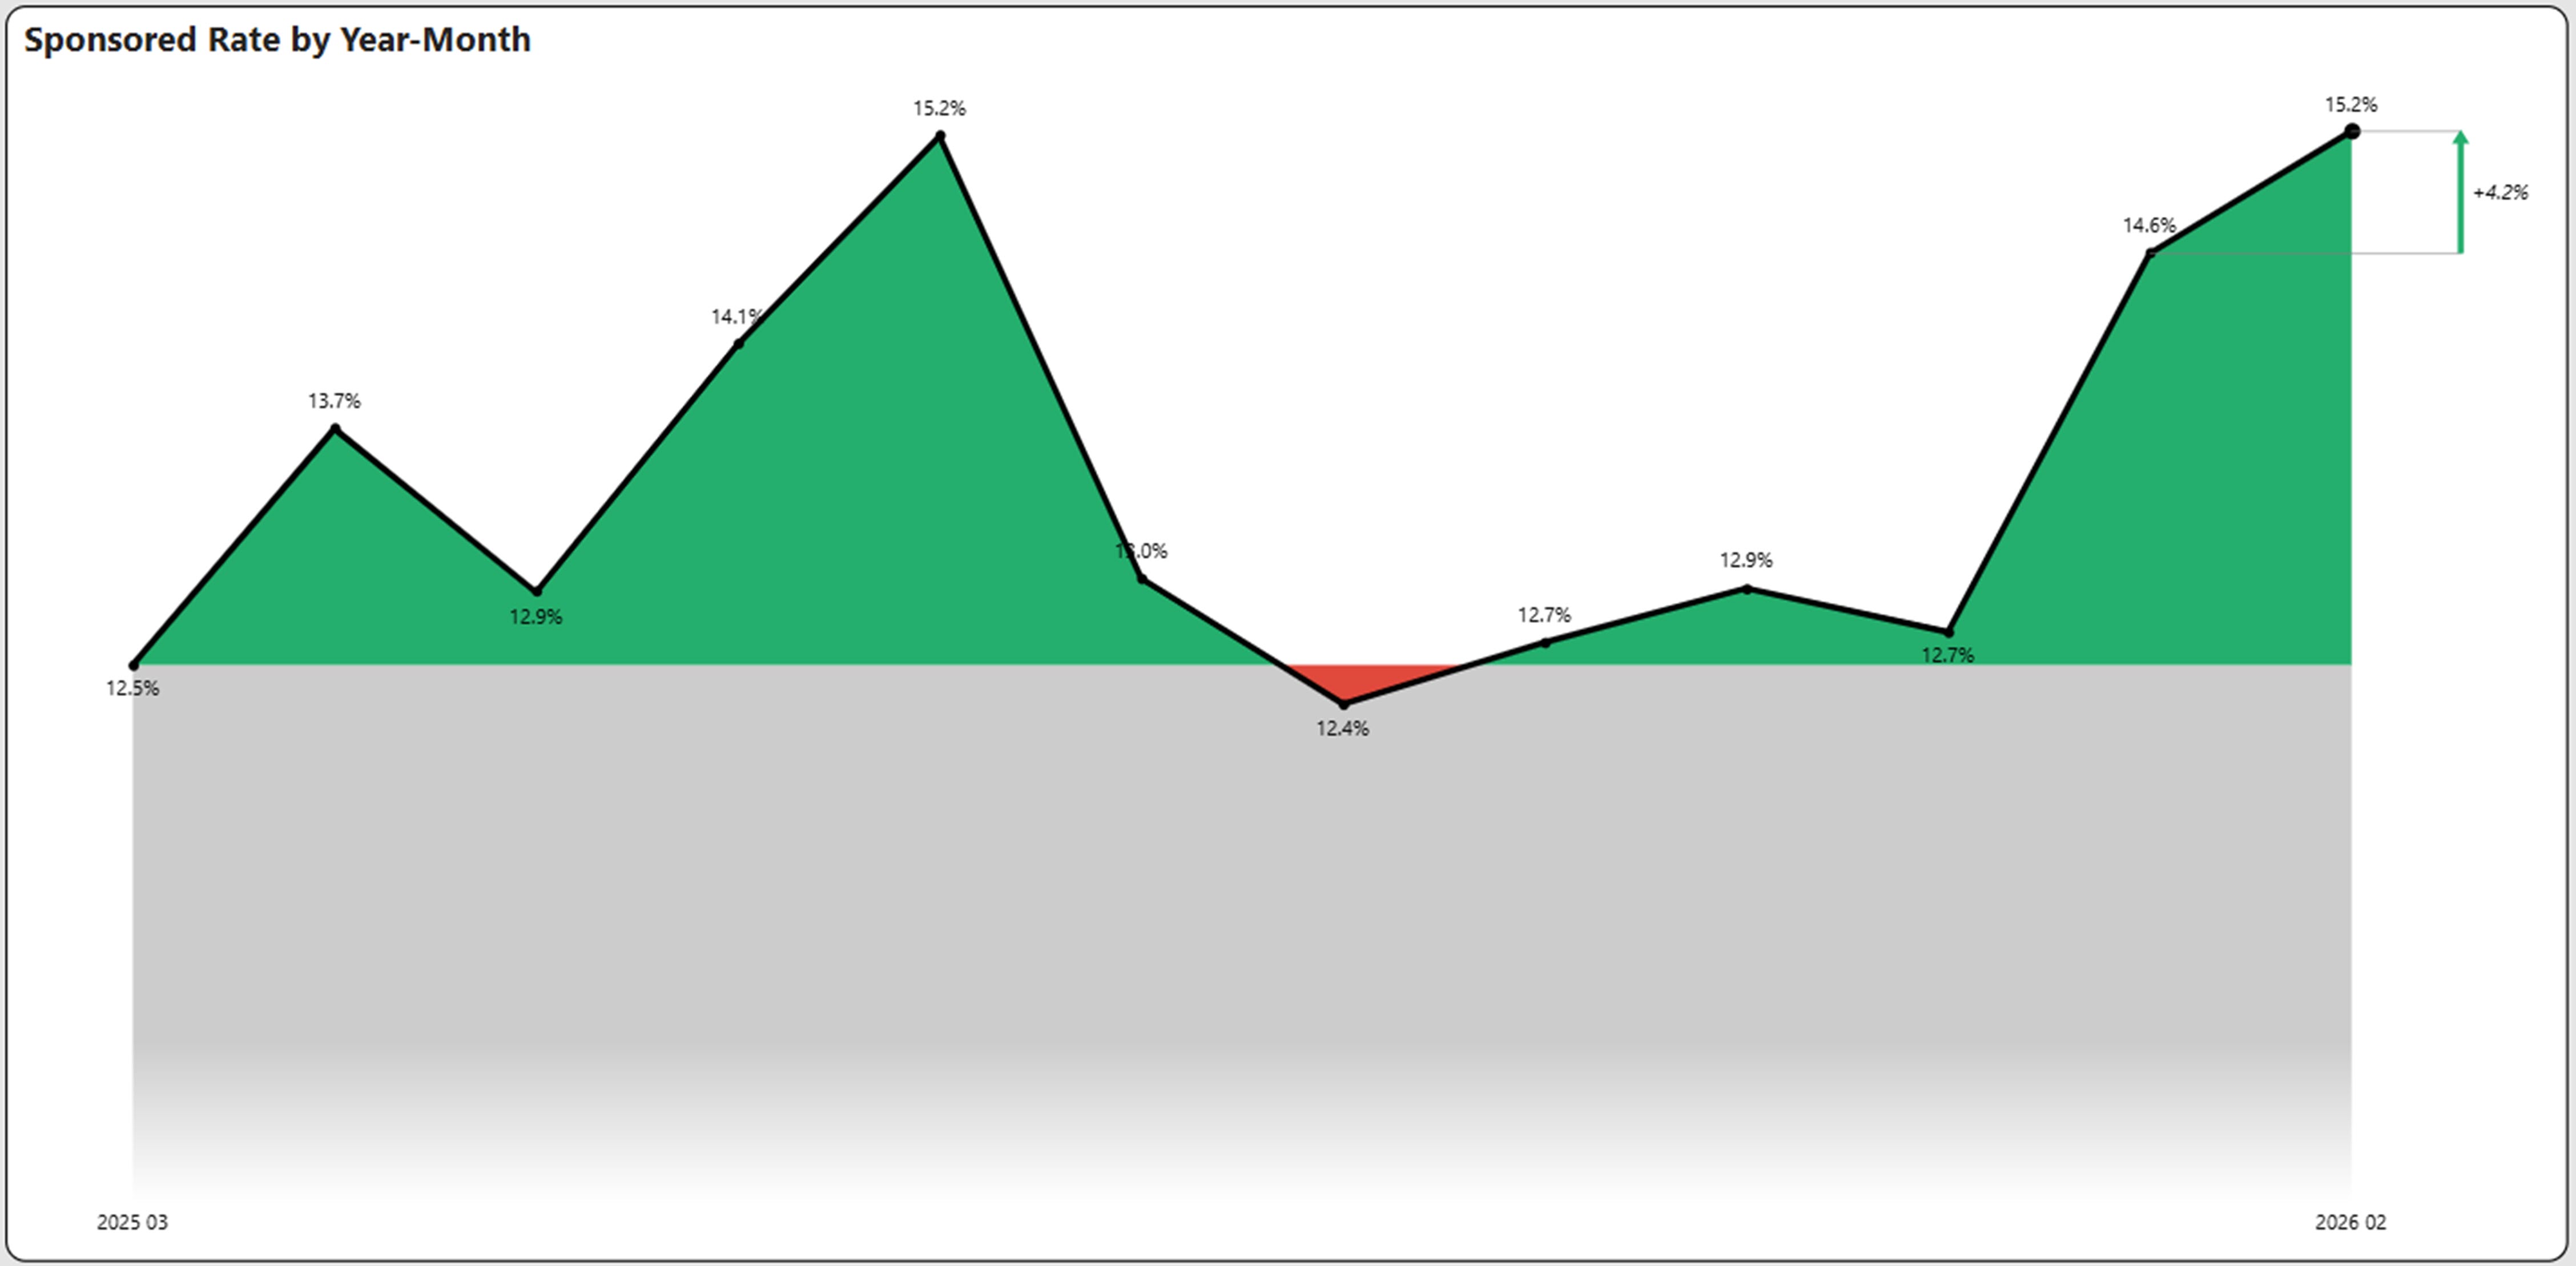
Sponsored rate is the percentage of job advertisements that have had a paid sponsorship at some point over the time period. This is a measure of job boards’ activity.
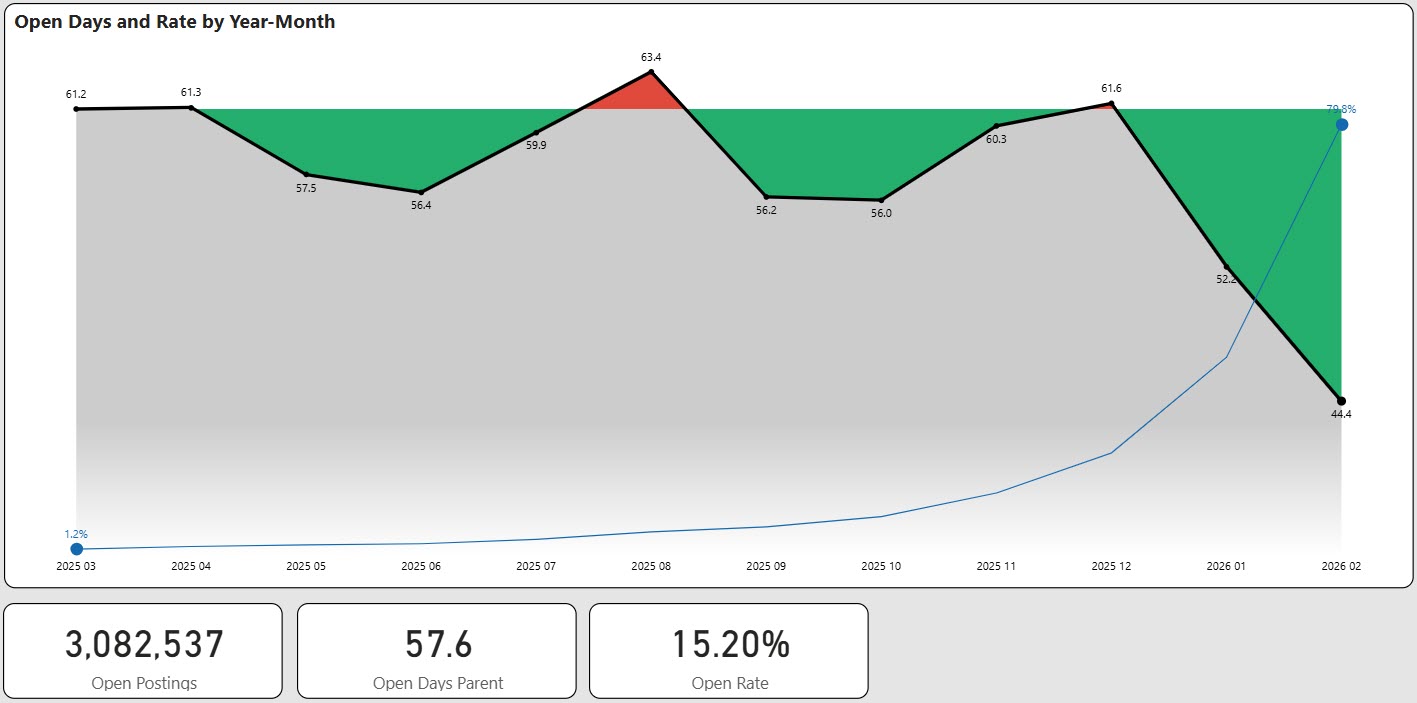
Sponsored rates showed some continued strength in February, increasing to 15.2%. This is tied for the highest level over the past twelve months.
Artificial Intelligence (AI) Skills Growth
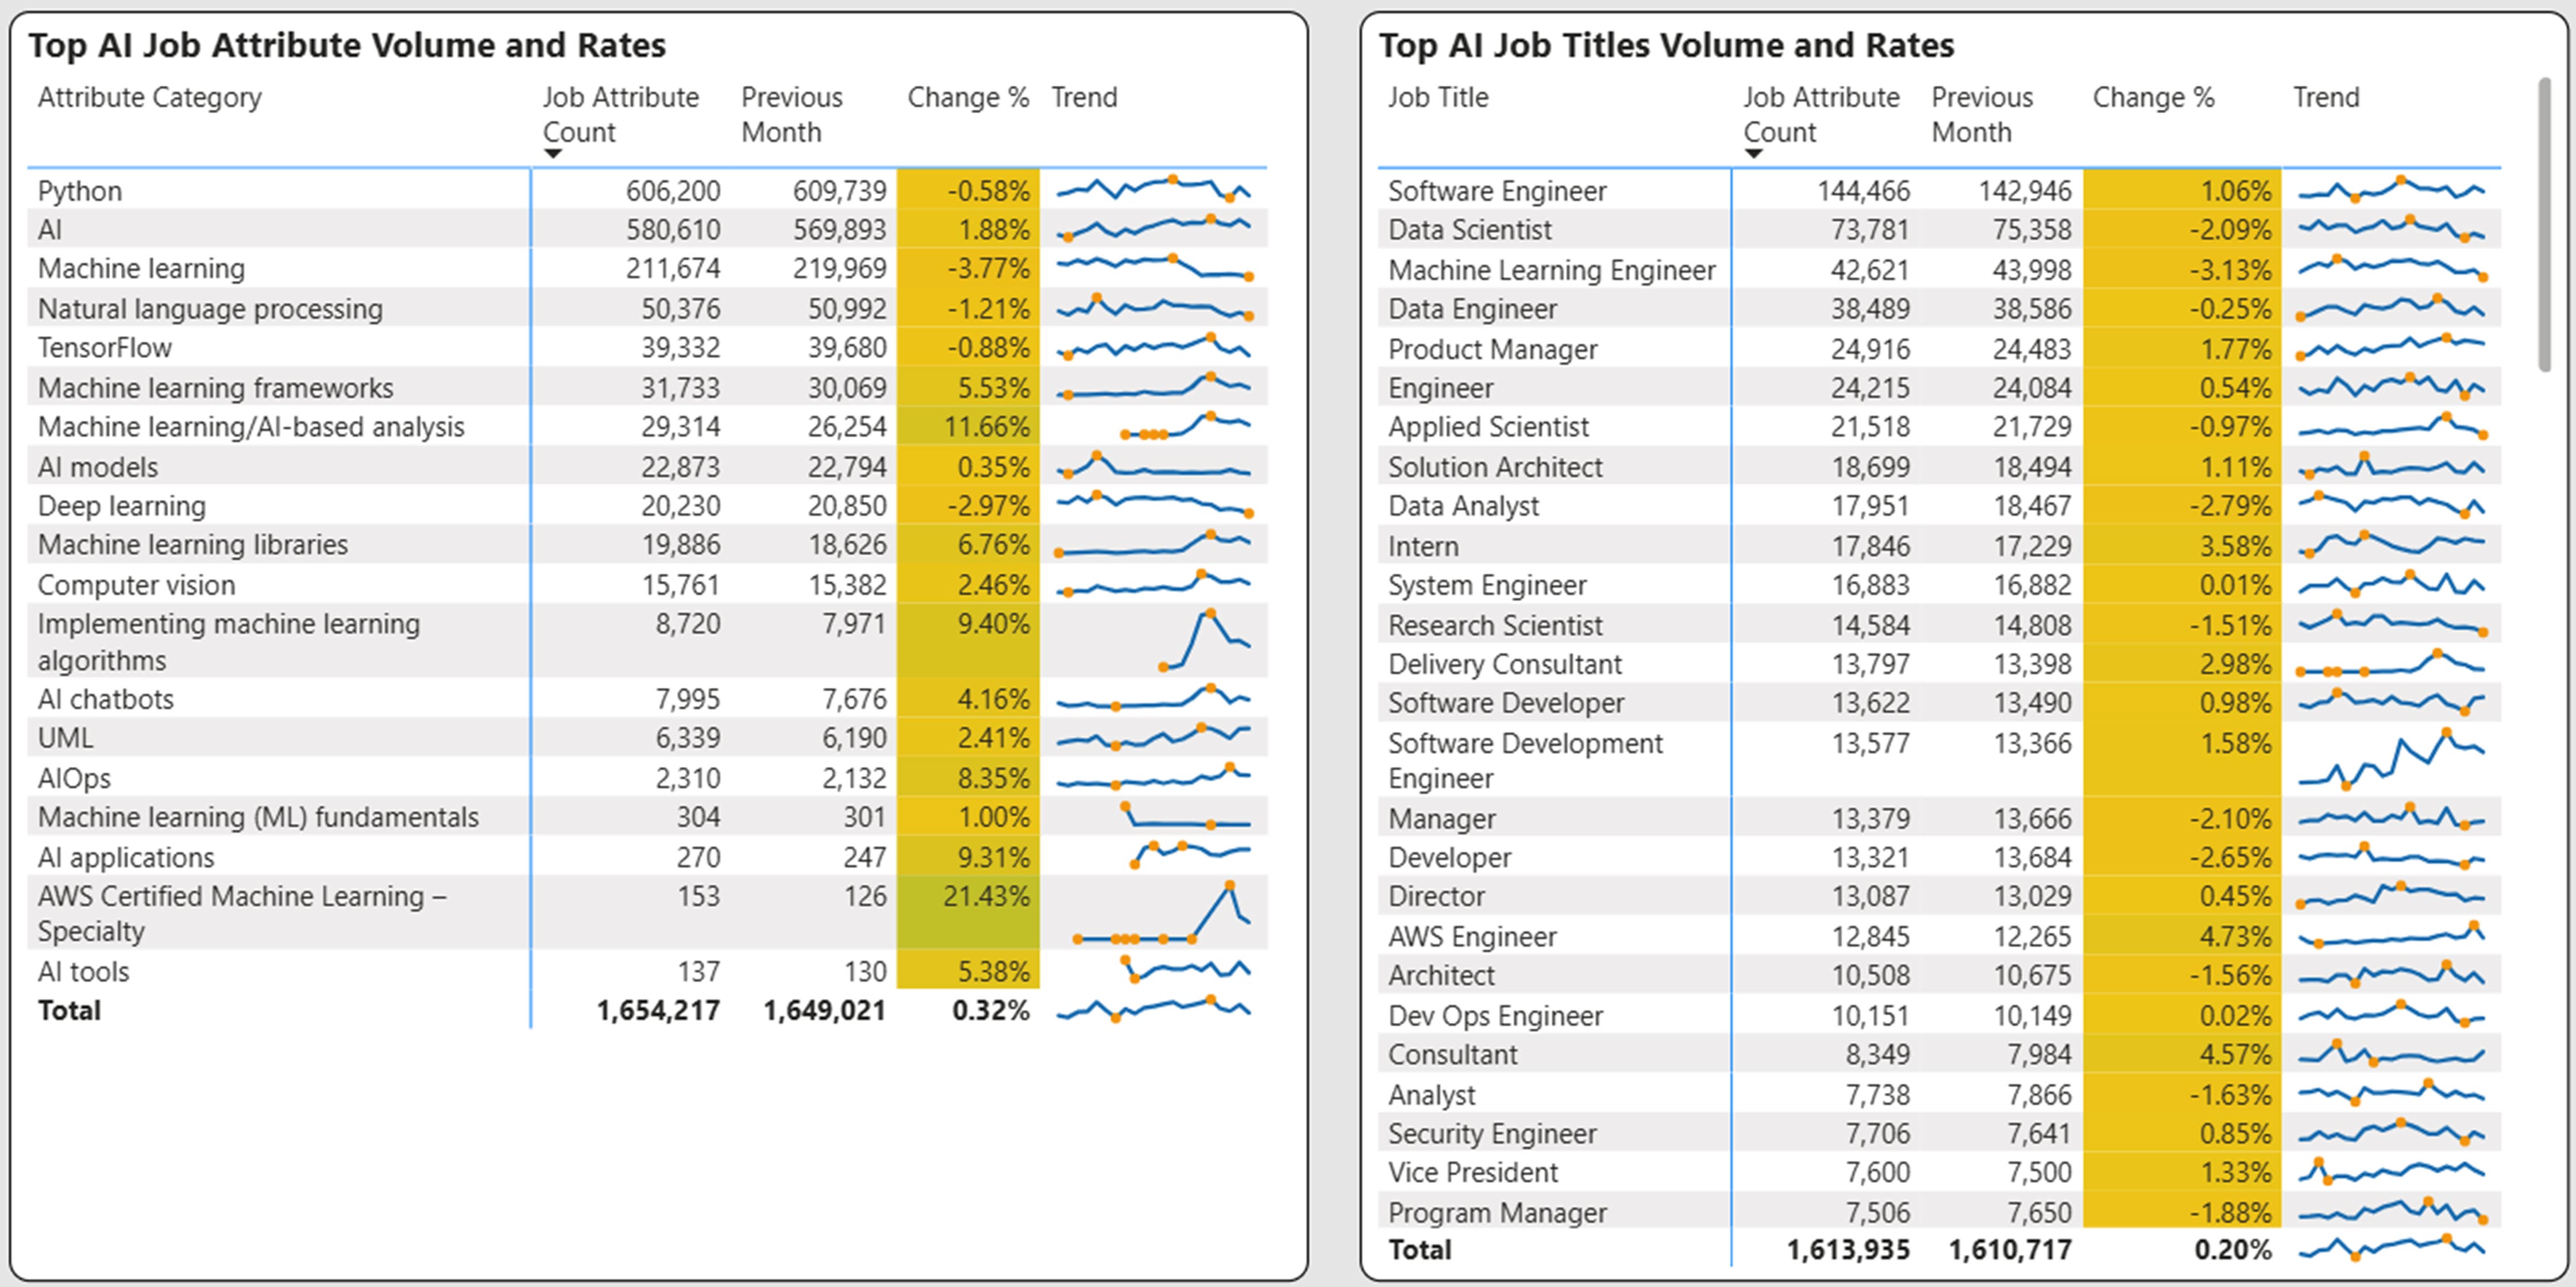
Job attributes are categories of skills, benefits or credentials that are included in a job posting. We have flagged AI related categories and plotted the trailing 19-month (earliest data available) growth as shown below. The top AI skills are shown below along with the corresponding job titles.
Python has remained the top mentioned attribute while machine learning related attributes and TensorFlow continue to show the most growth.
These attributes are infused across multiple technology job titles, but are also increasingly showing up in non-technical job titles. These titles include product manager and delivery consultant.
Fill Days are Flat Again
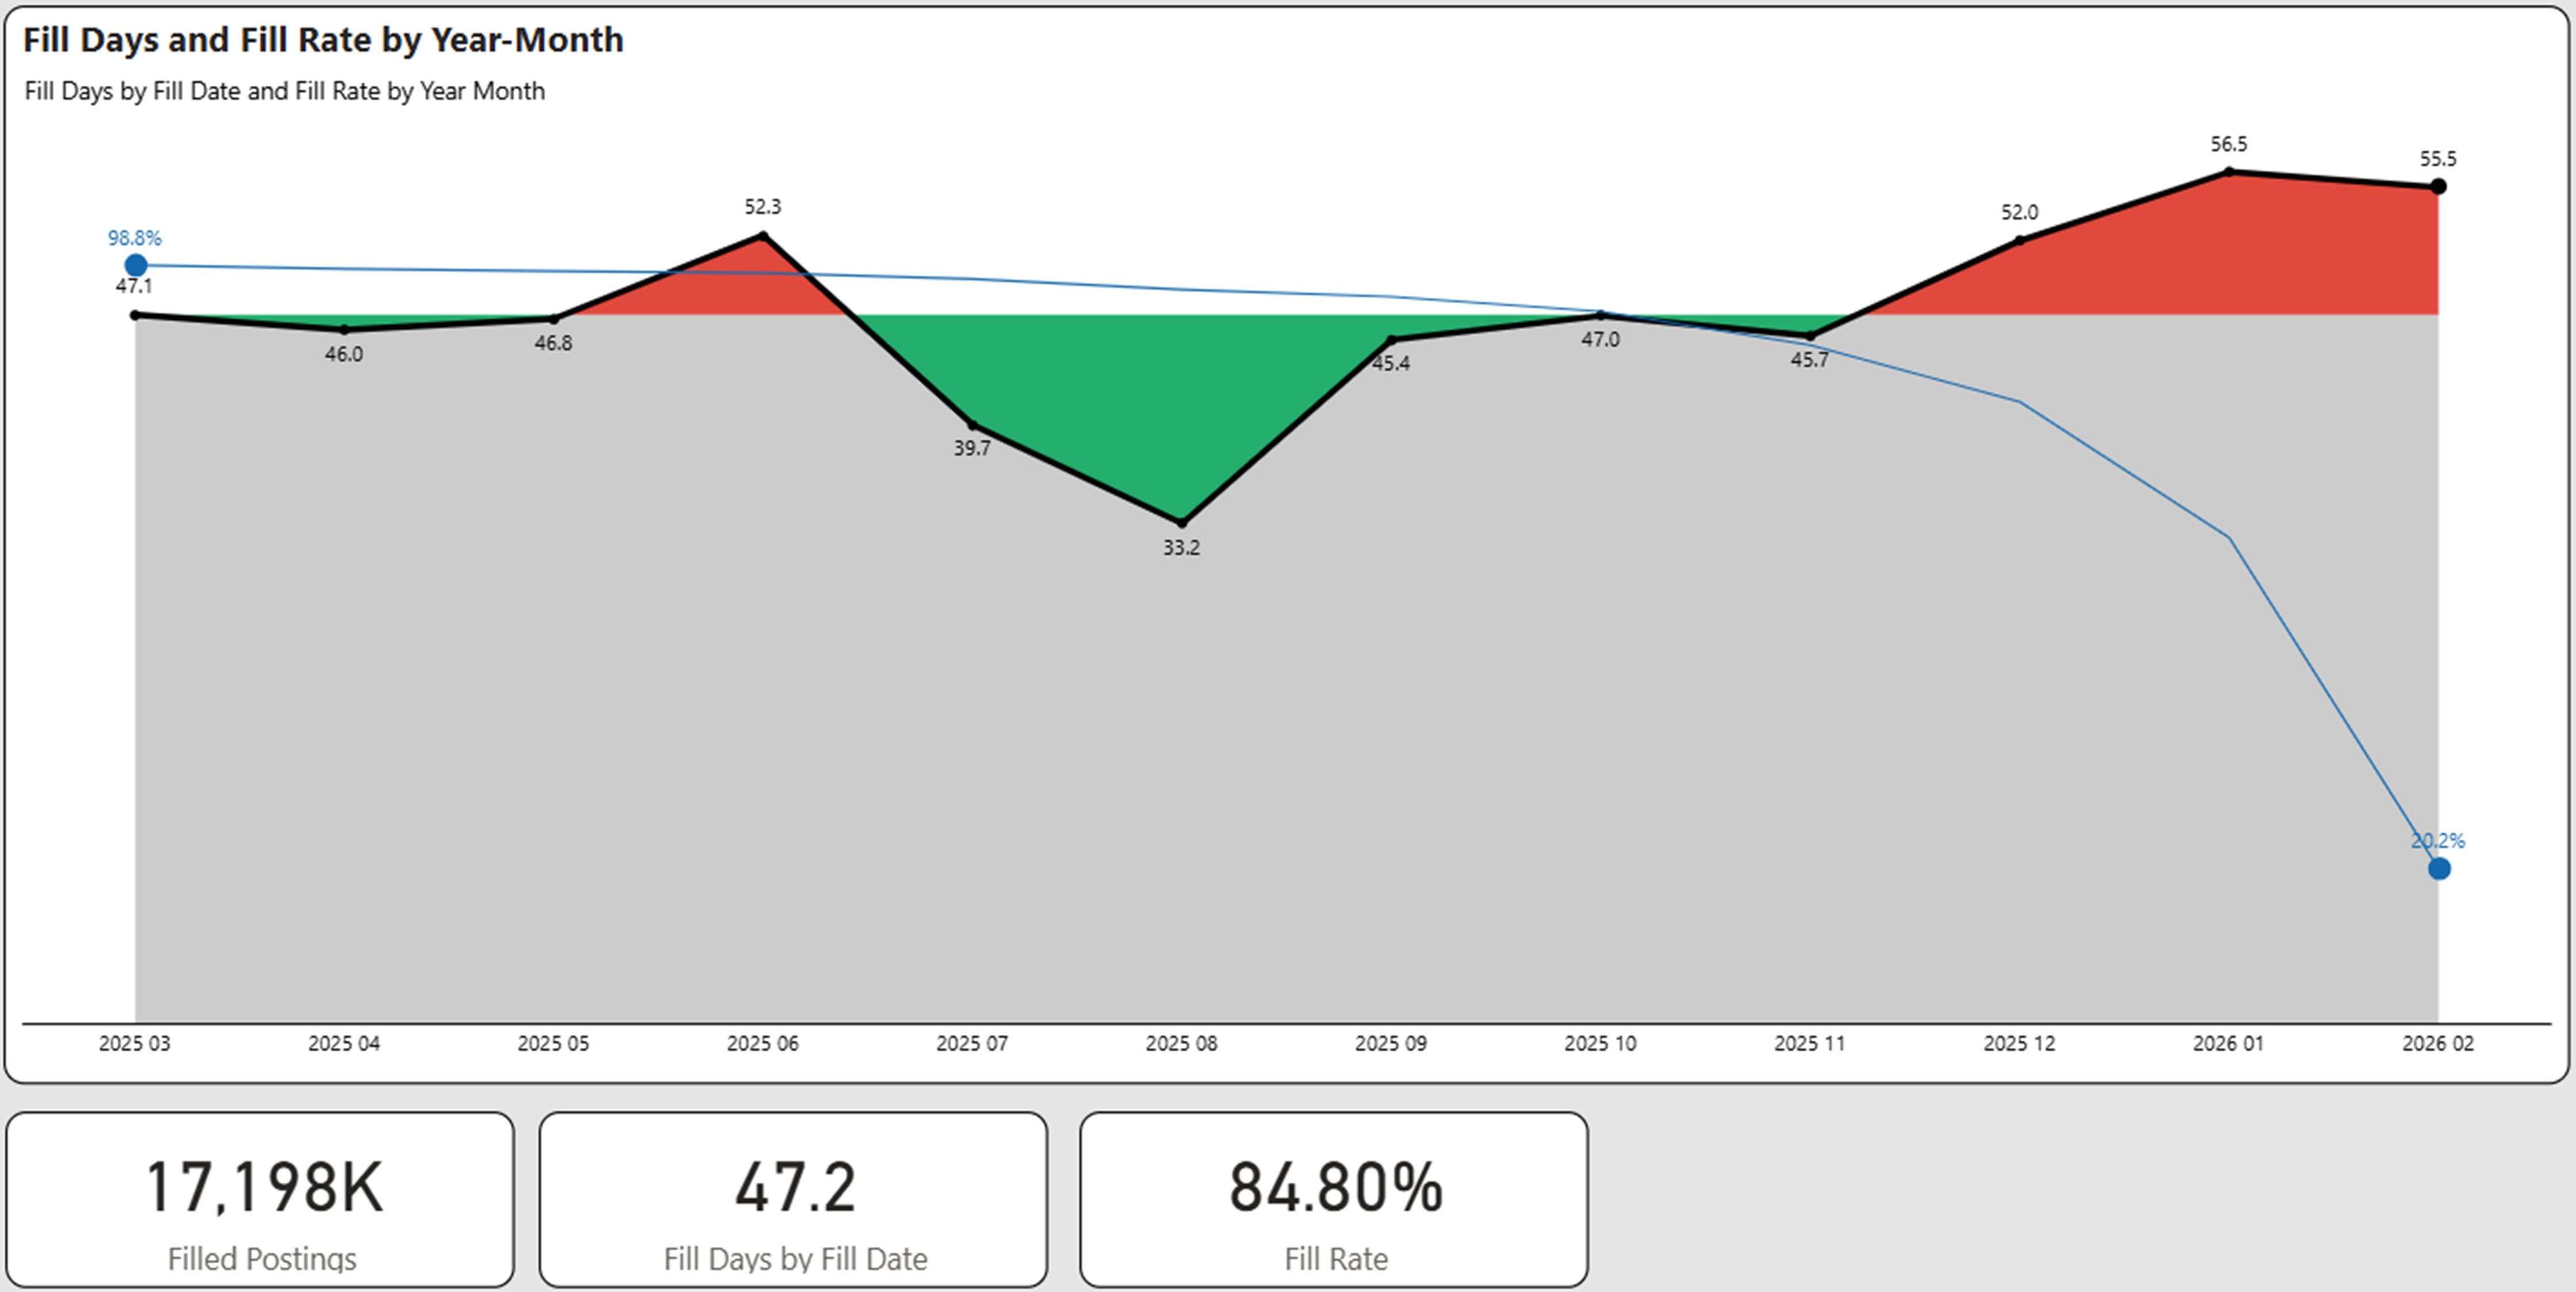
For fill days we use ad expiration and ad removal to determine a presumptive hire. When measured over a prolonged period of time and over millions of postings, this provides a strong view of the overall market. The trailing 12 months is used as a time period for our analysis.
In the graph below, we show the fill days by month along with the percentage of ads (blue line) that have been filled. Obviously, the newer ads have a lower fill rate.
Fill days were flat in February at 47 days. However fill rates increased modestly over the comparable time period from 82.3% to 84.8%. This rate is still below late 2025 levels of 86-87%.
Open Days Stays Flat and Open Jobs Declines
We track every job posting uniquely and ascertain its fill status on a weekly basis. Open days is the average age of postings that are still determined to be open. Generally, we have found that 12 months to be a suitable time period to evaluate the age of open days. Older postings may distort the open days as they may represent “evergreen” postings. For this reason we eliminate implied evergreen ads that are older than one year from our analysis.
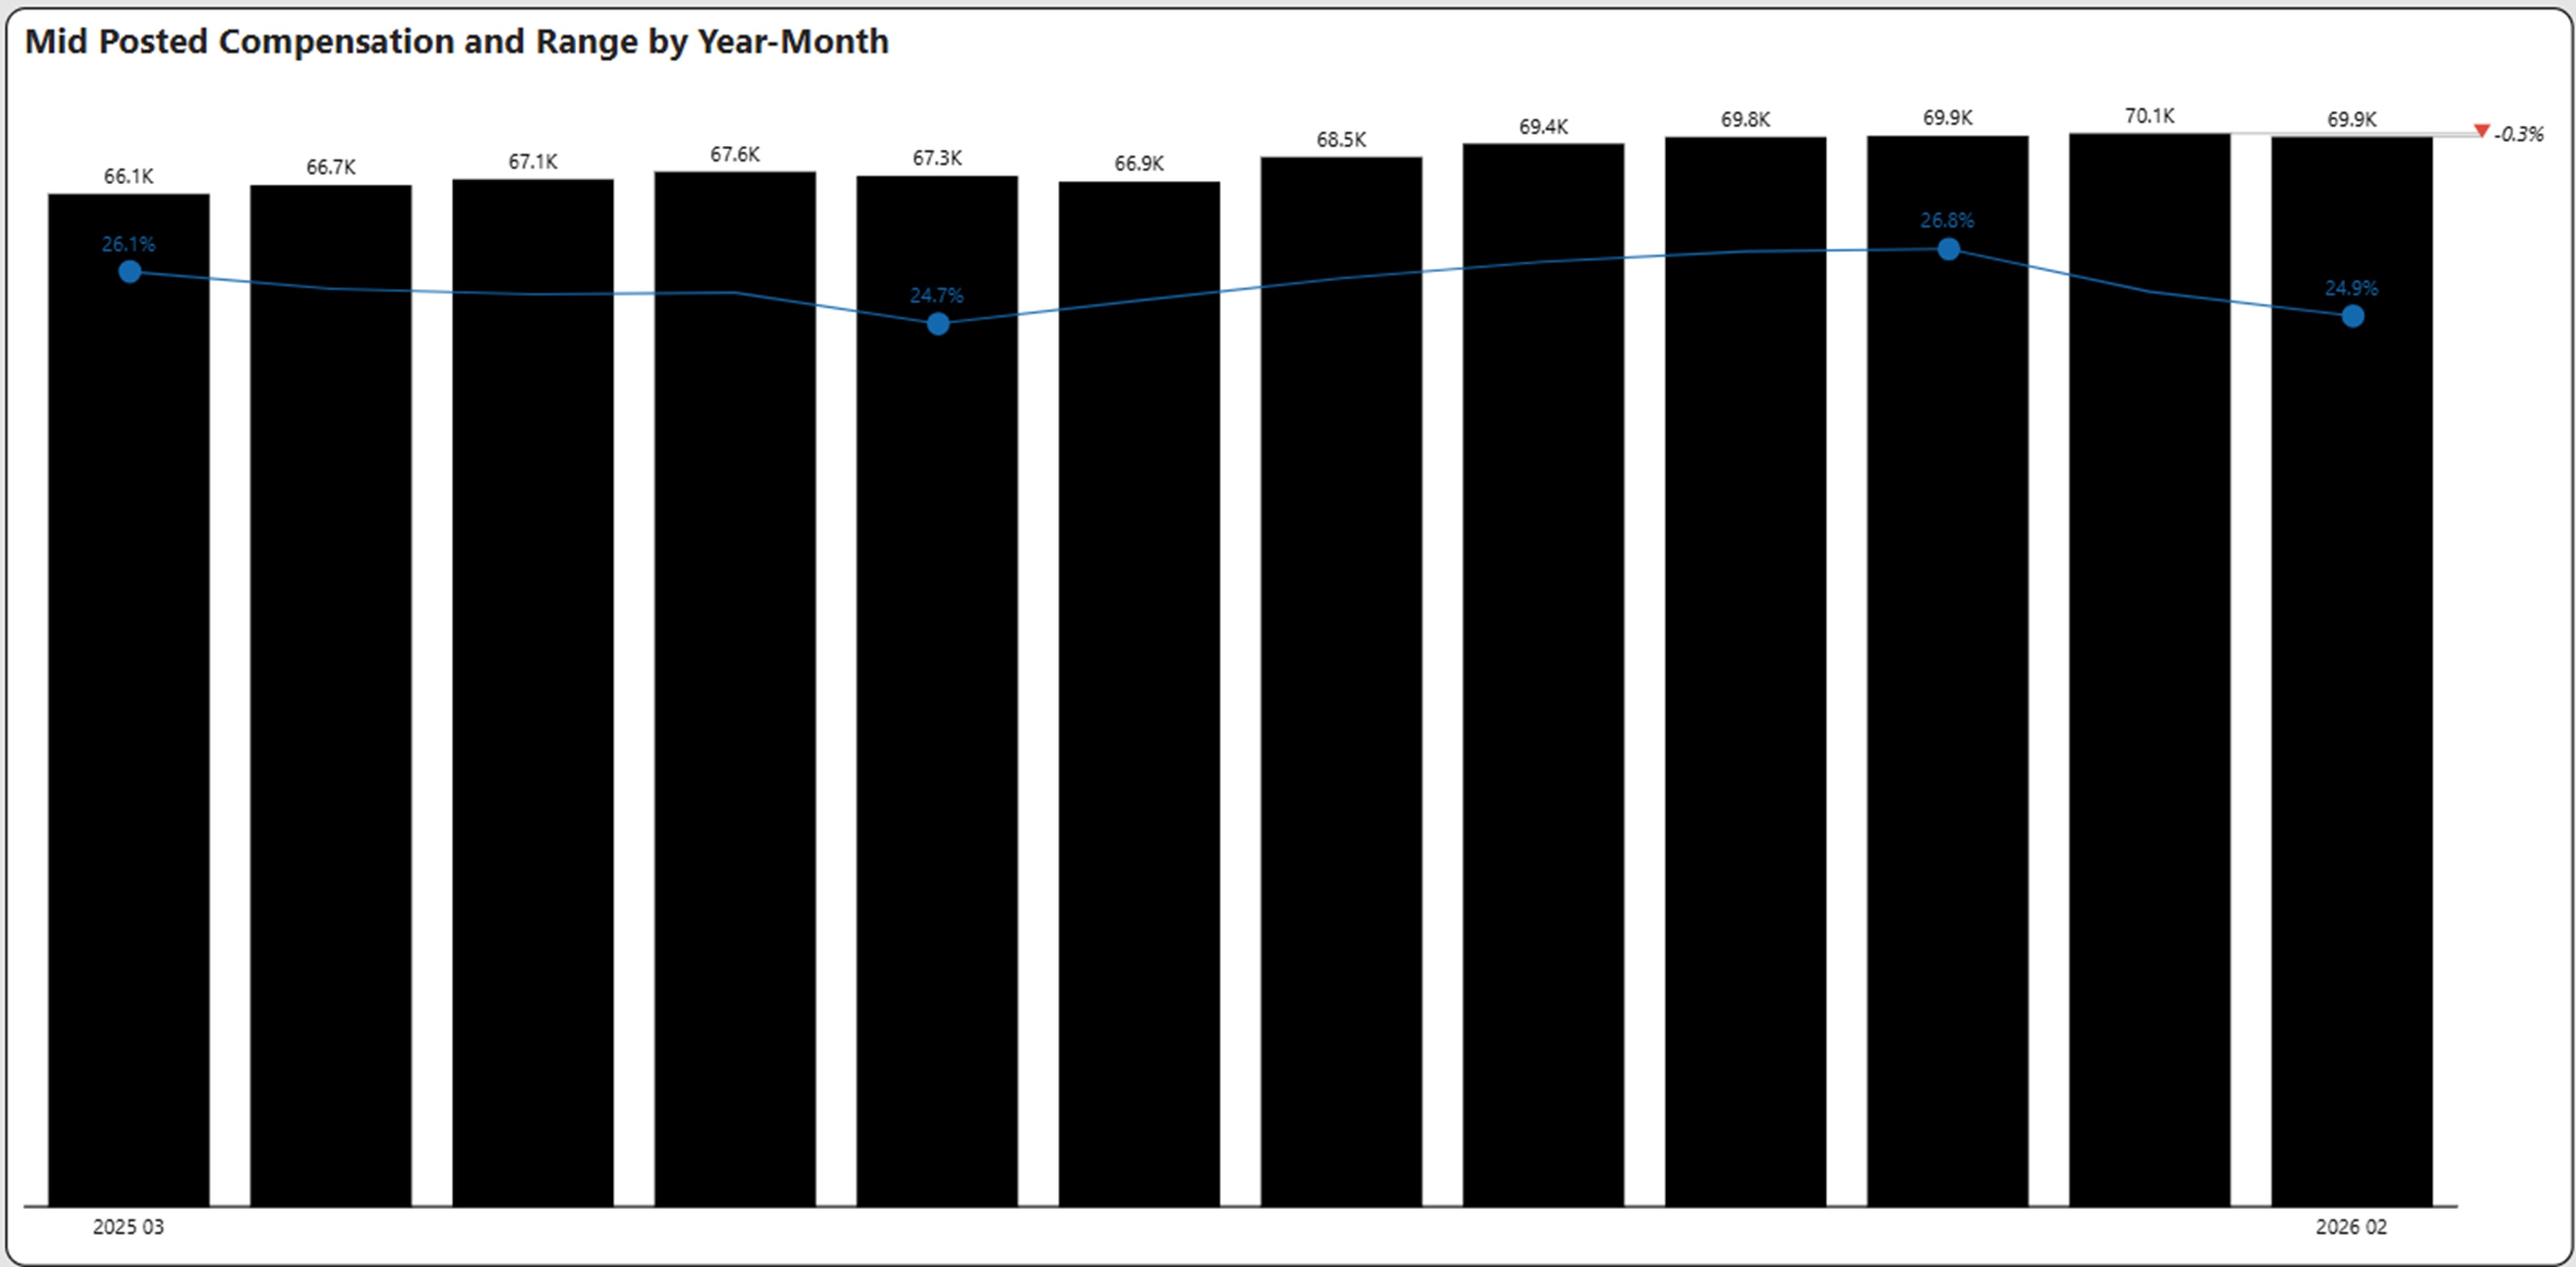
Compensation
Comp Remains Flat at $70k
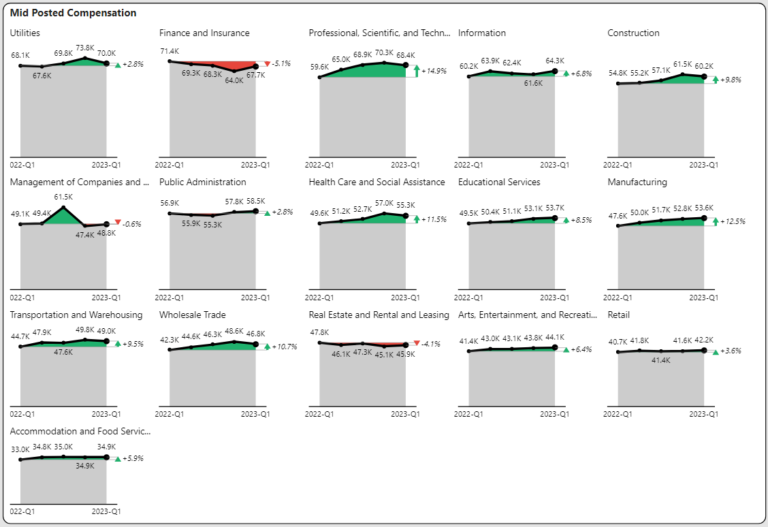
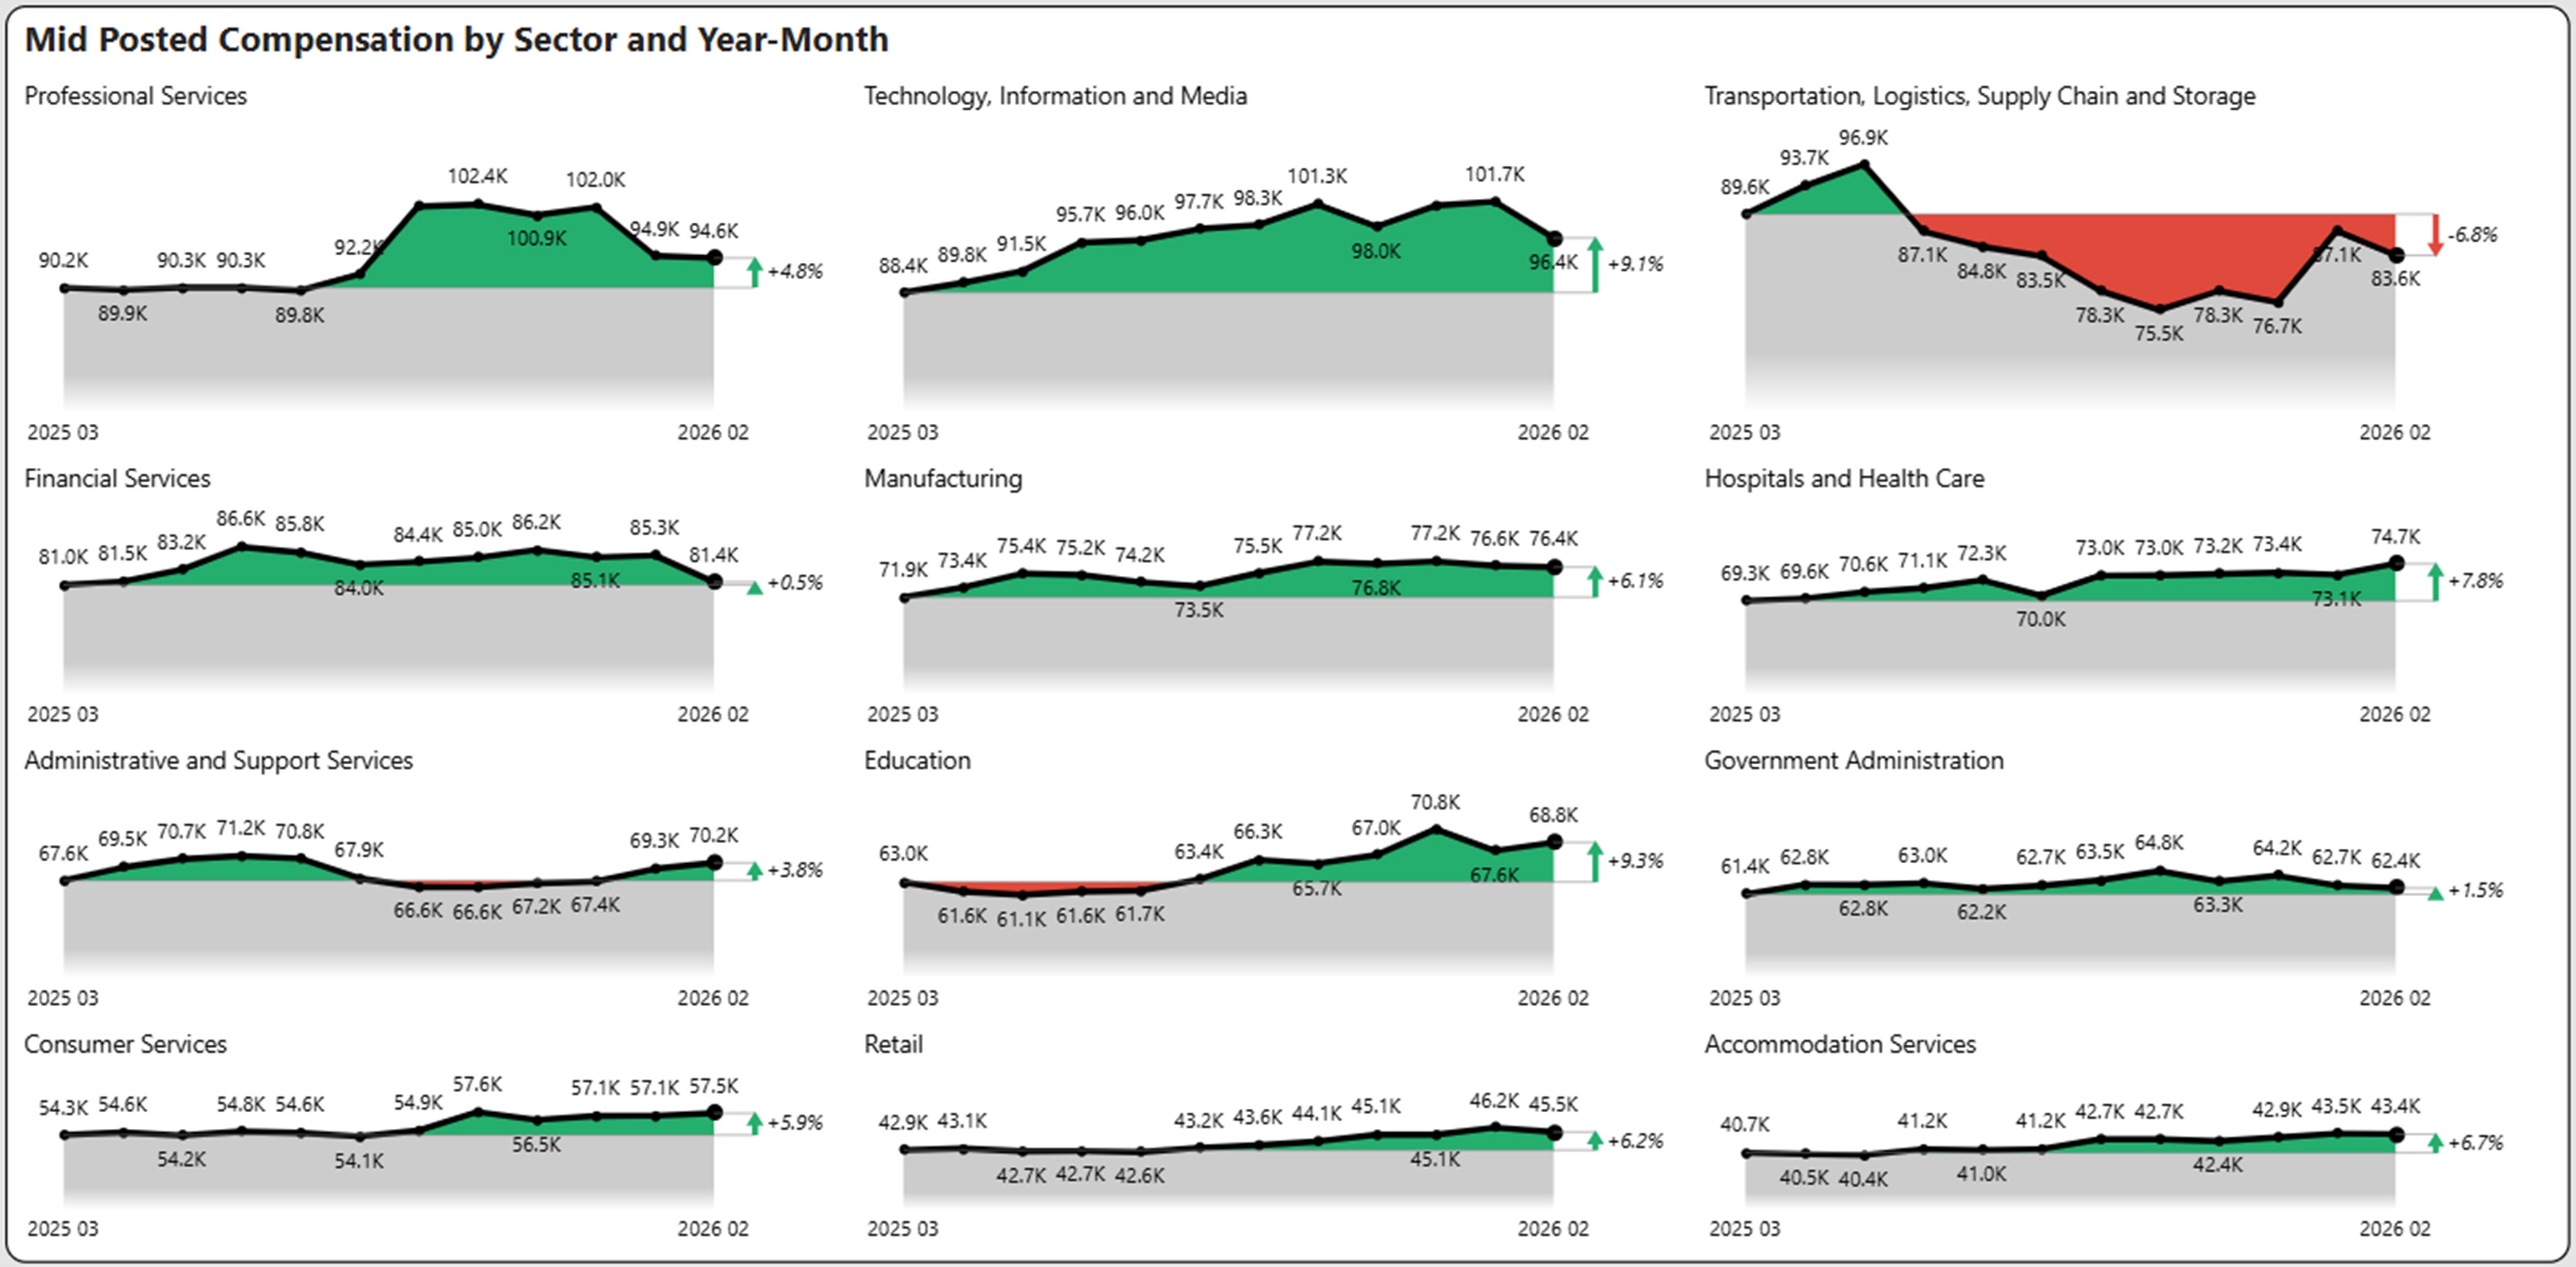
Industry Sector Compensation
The chart below shows the compensation by industry sector for the past 12 months, highlighting the winners and losers.
Supply and Demand
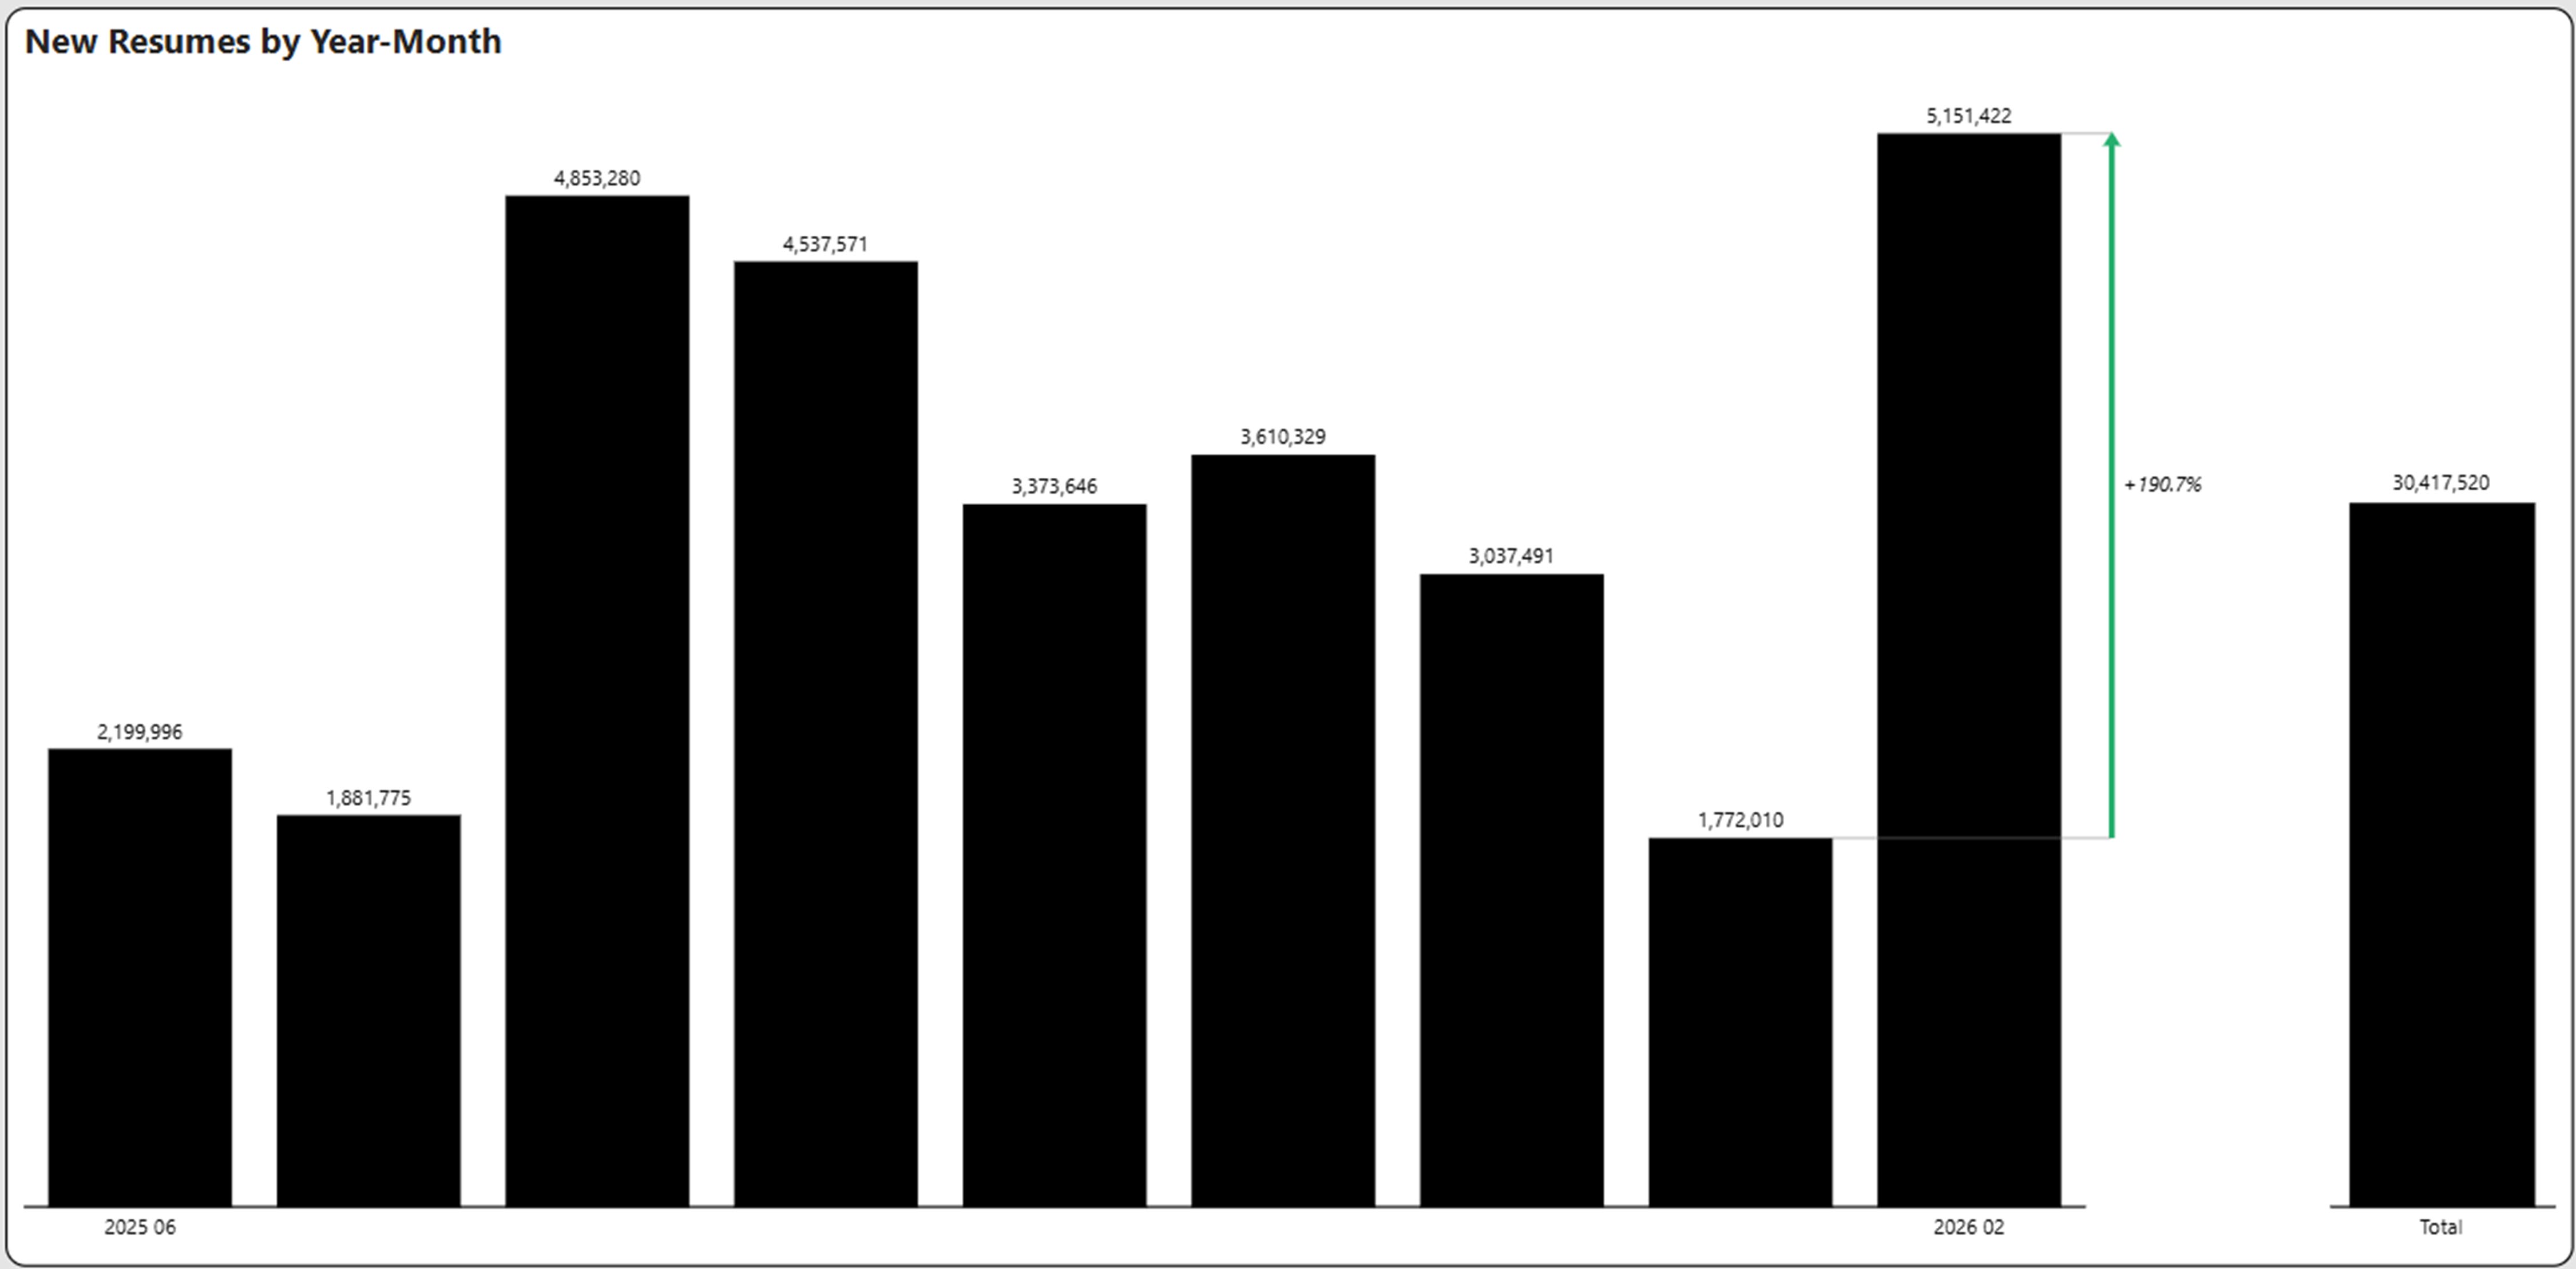
It’s an Employers’ Market Now – New Resumes Increase
We use total resumes over the trailing nine months as an indicator to measure overall job seeker interest. Trailing resumes jumped significantly in February and the trailing nine months now stands at 30.4 million compared to 27.3 million last month. This combined with the decline in net positions from 19.8 million to 18.9 million definitely indicates it’s an employer market. Resumes to Net Positions ratio has increased from 1.2 to 1.6 over the past four months. We are approaching twice as many job seekers as there are unique positions.
In a month-to-month comparison, total new resumes increased by 190.7% in February compared to January.
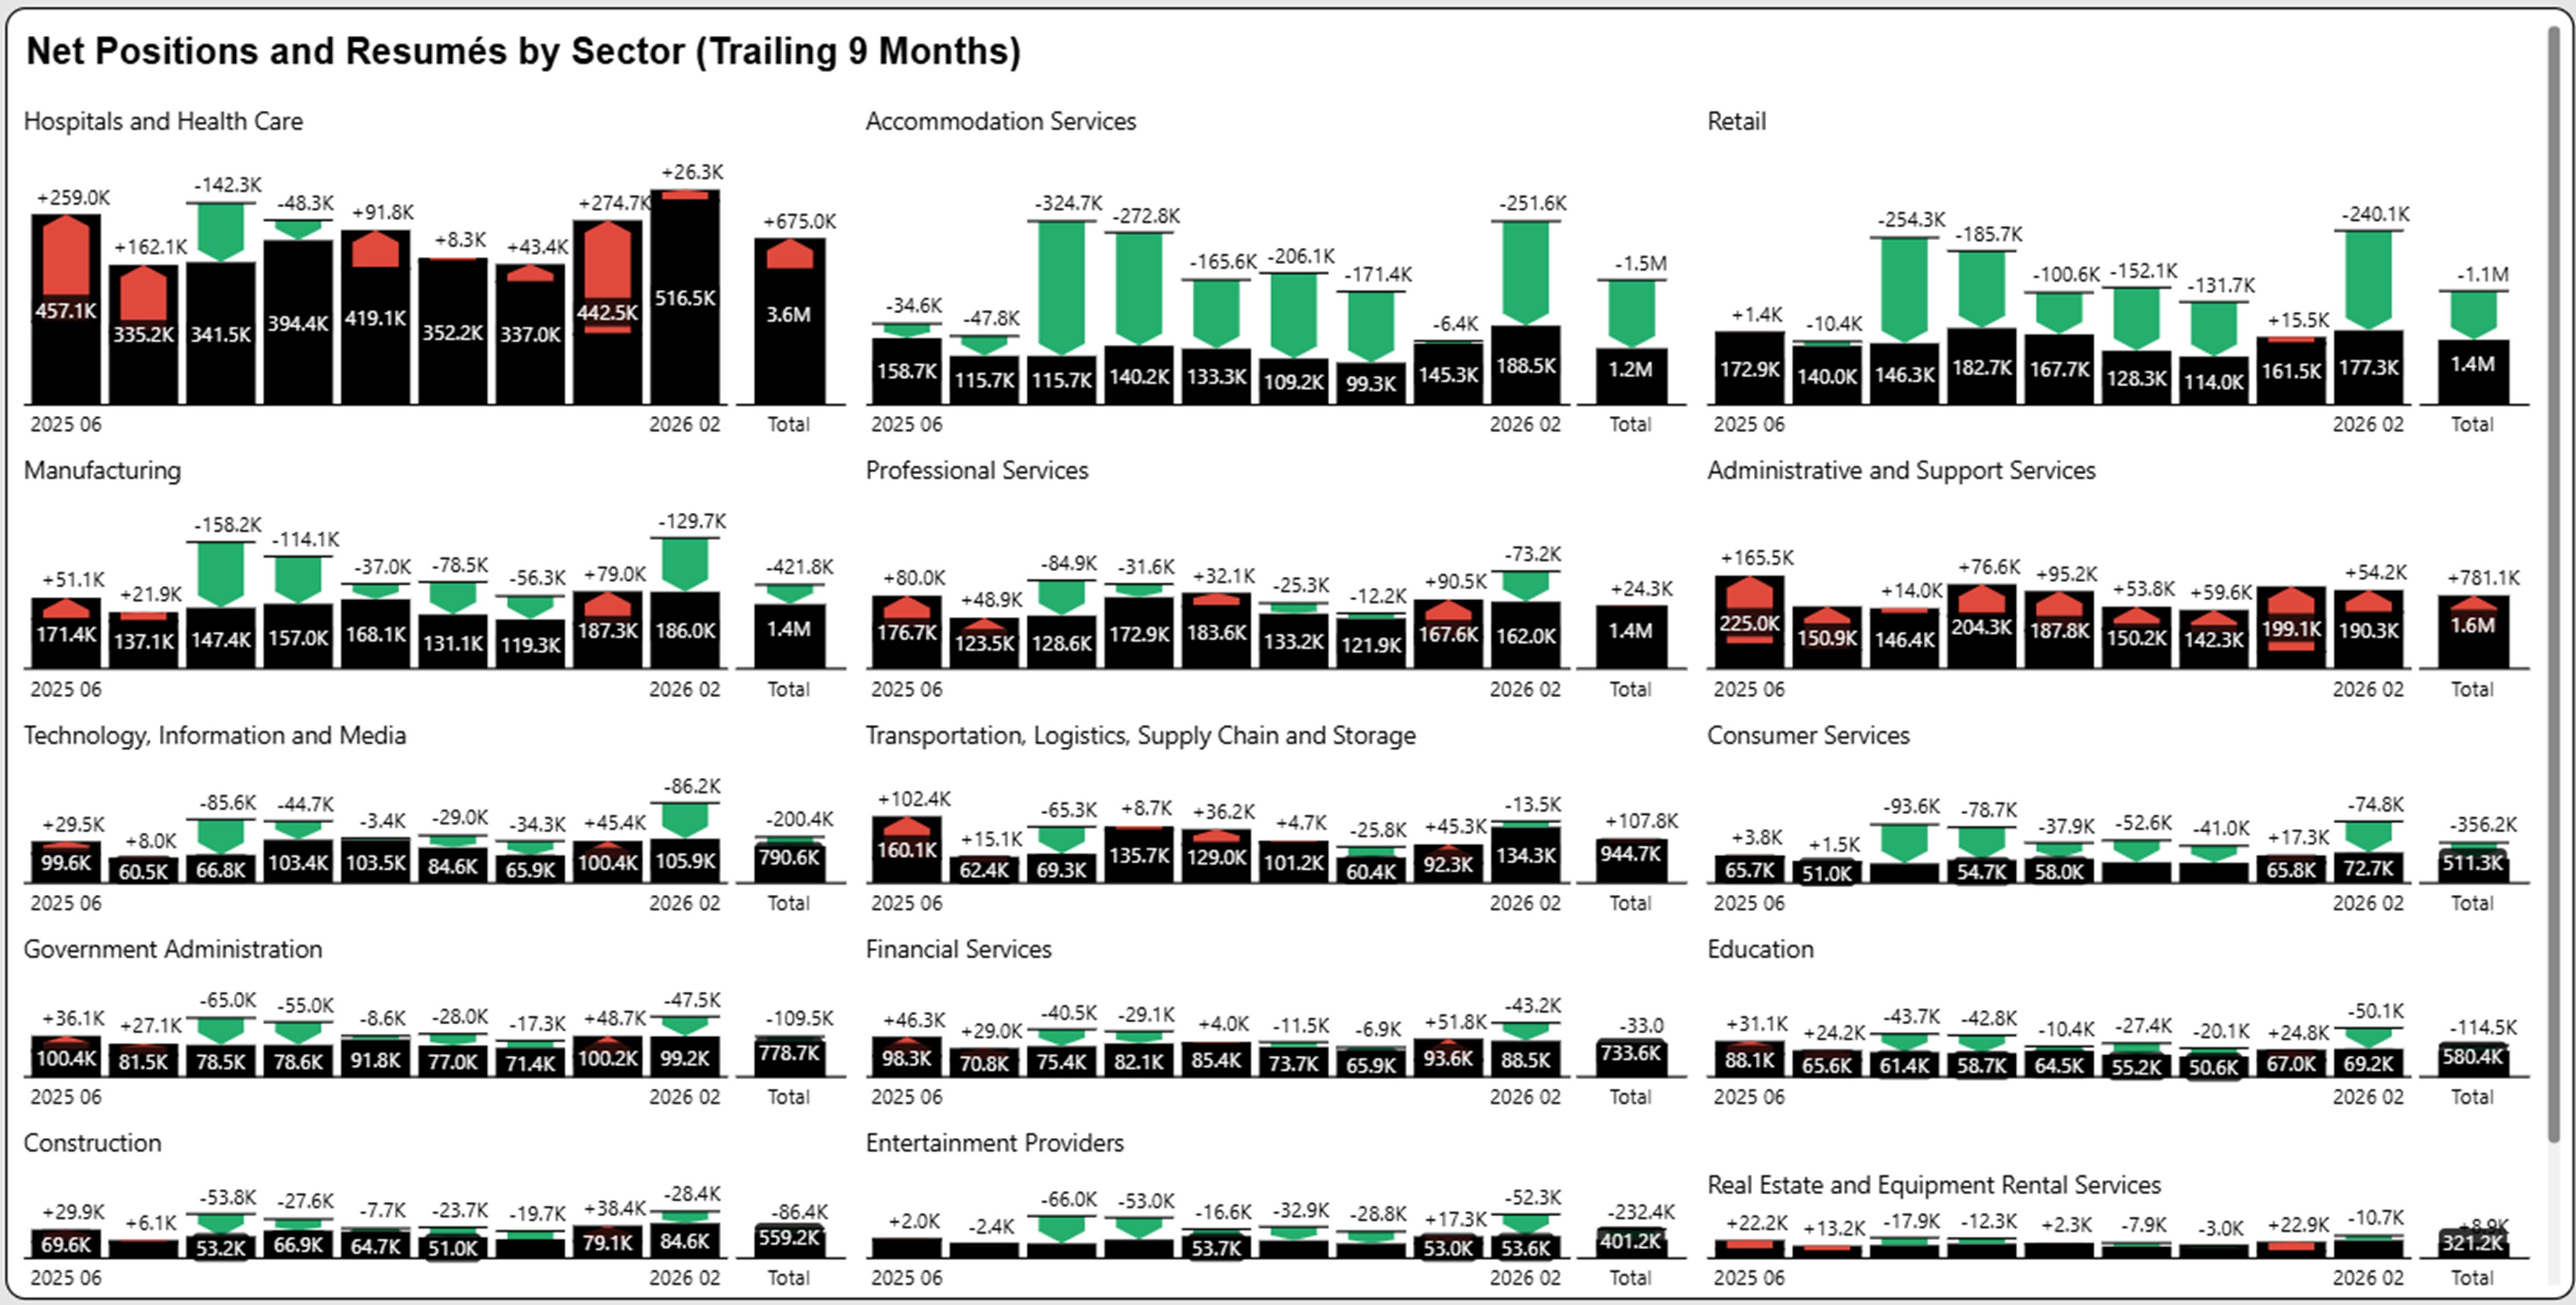
Supply/Demand by Industry Sector
To highlight supply/demand imbalances, we superimpose job seekers based on resumés against net job positions (hires based on unique postings) in black bar. The graphs highlight supply surplus (more job seekers than net postings) shown in green or supply shortage (less job seekers than net postings) shown in red. We picked a time period of nine months, which highlights the current market surplus or shortage. The total bar reflects the summaries of openings and resumés for that time period.
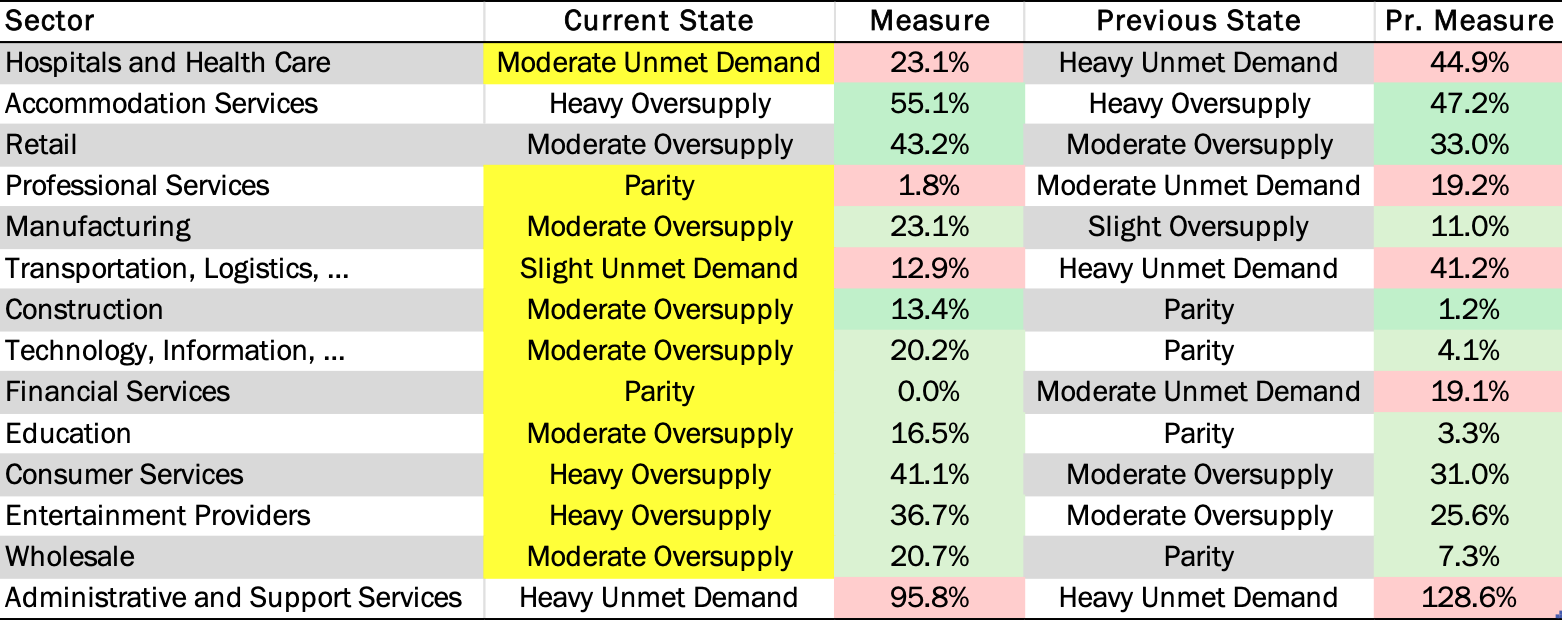
Supply/Demand Scorecard
We highlight the current state at the end of January as well as the most recent changes over the last nine months. Change is not necessarily good or bad, but we have highlighted changes in supply/demand gaps that significantly impact the current trends.
In the graph below, the Measure column shows the percentage of excess supply over demand (green) or demand over supply (red). The current monthly state is then compared to the previous monthly state with changes (if applicable) highlighted in yellow.
Most every sector has shown progression towards supply. Even Health Care has finally tilted from Heavy Unmet Demand to Moderate Unmet Demand.
Worker Sentiment
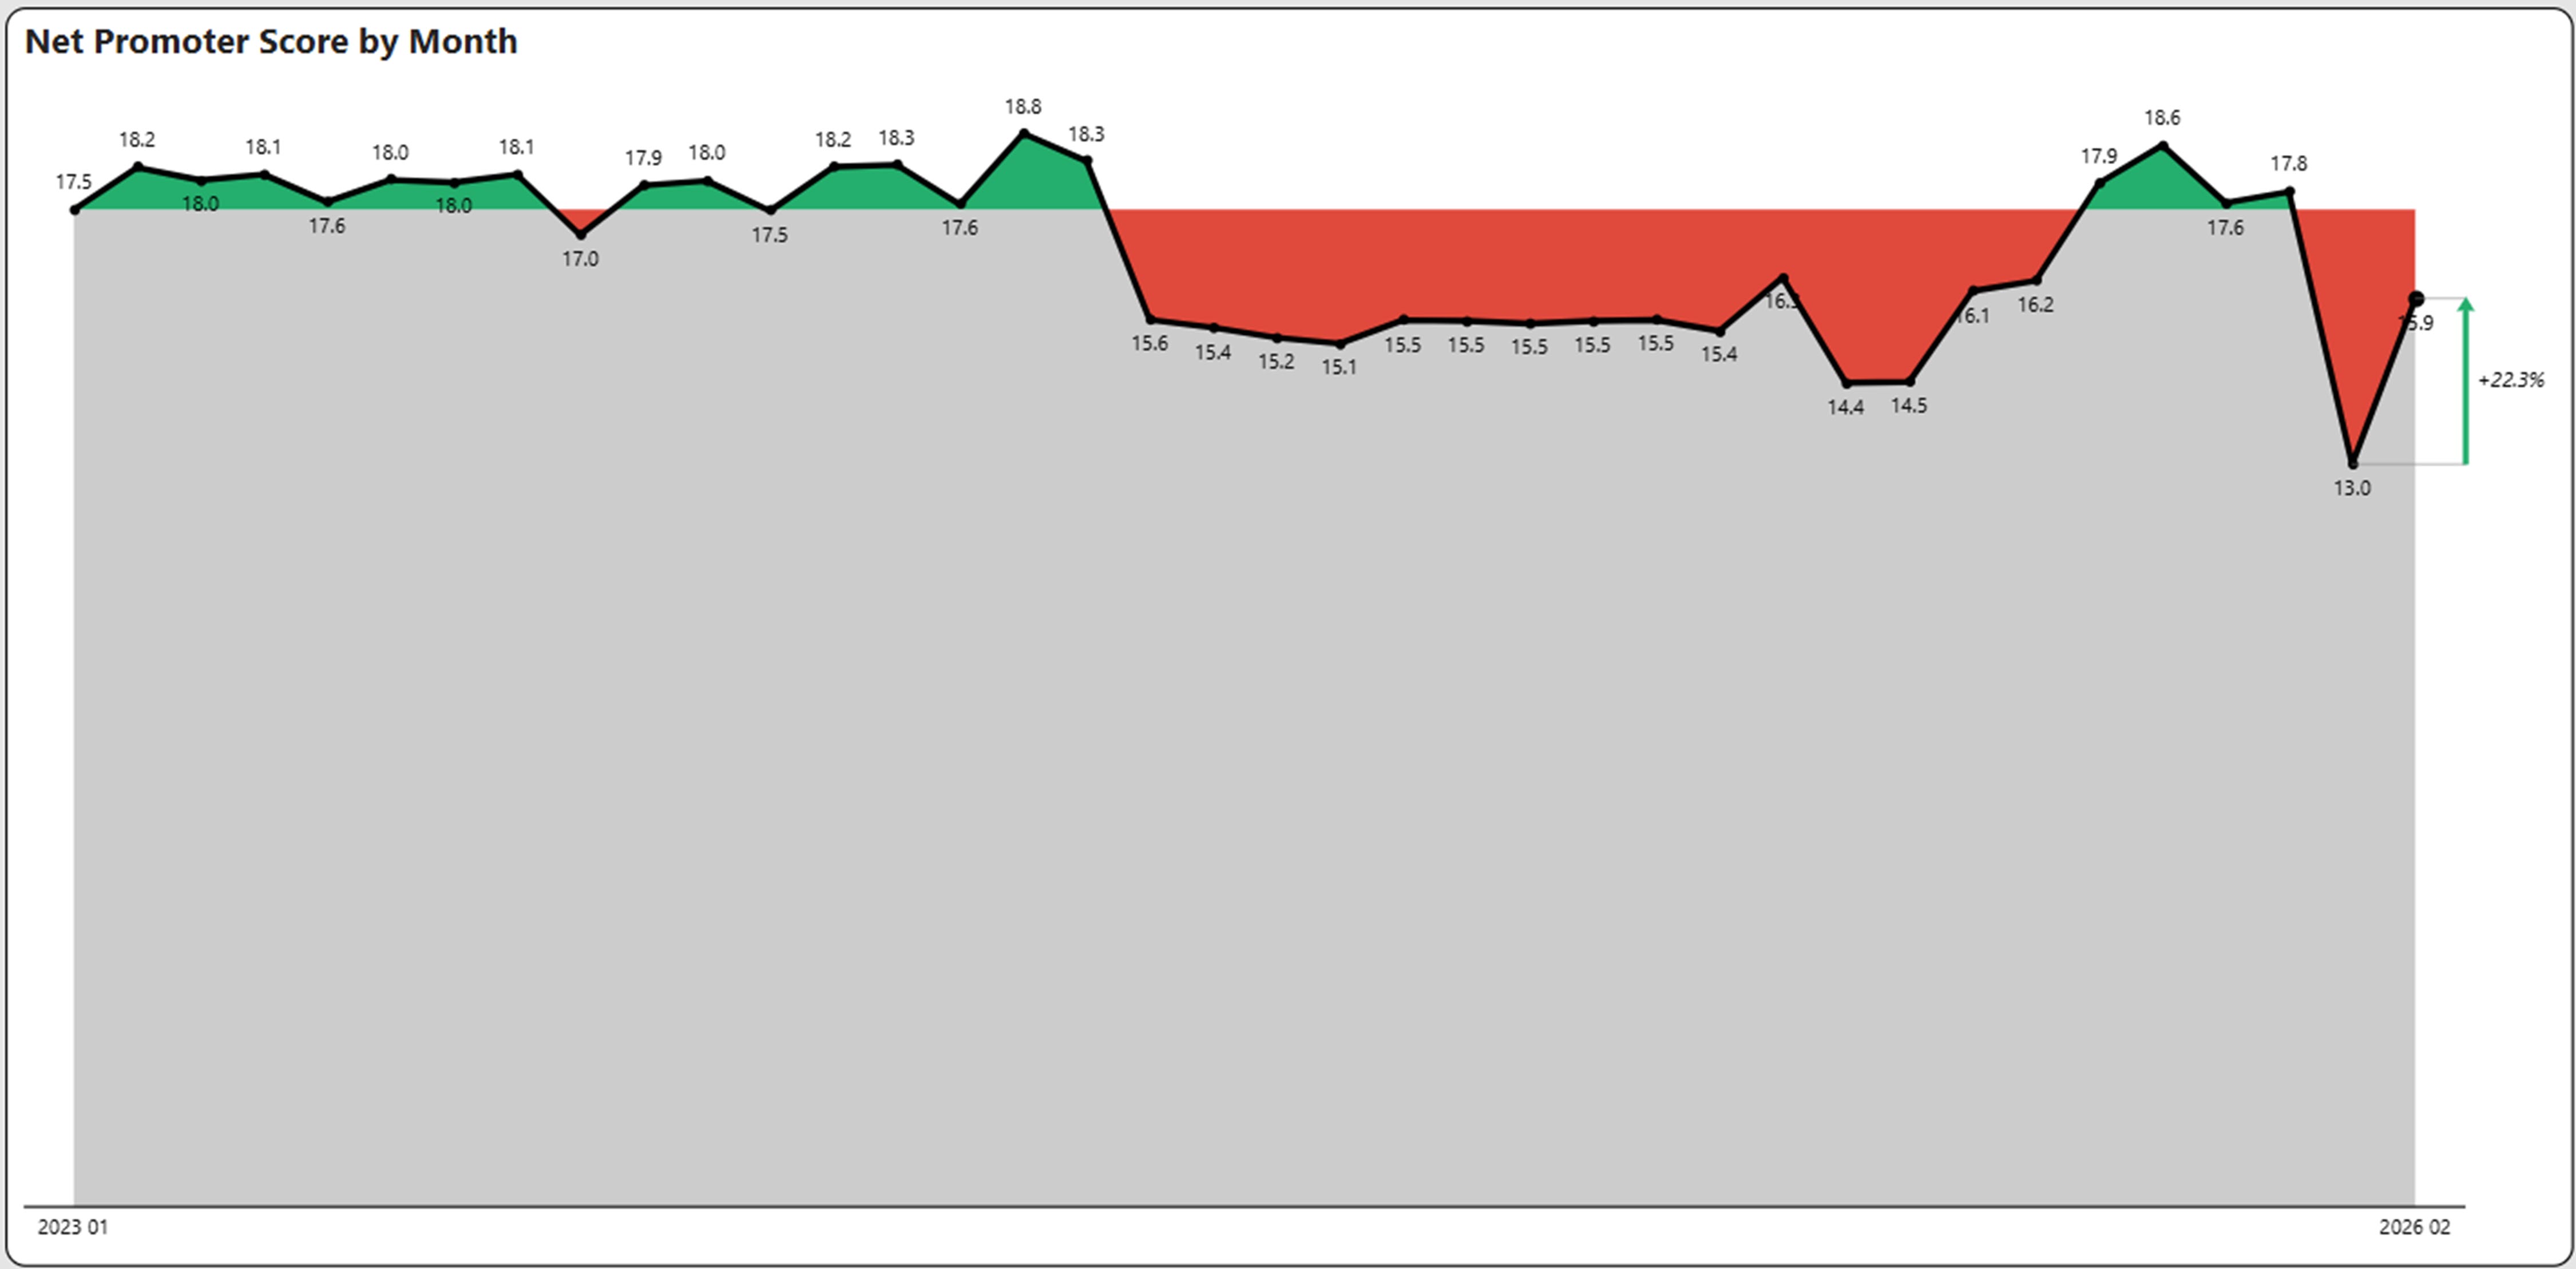
Net Promoter Score (NPS)
The Net Promoter Score (NPS) rebounded to 15.9 or a 22.3% increase in February after a significant January decline. Net Promoter Score is defined as the percentage of positive reviews over negative reviews.
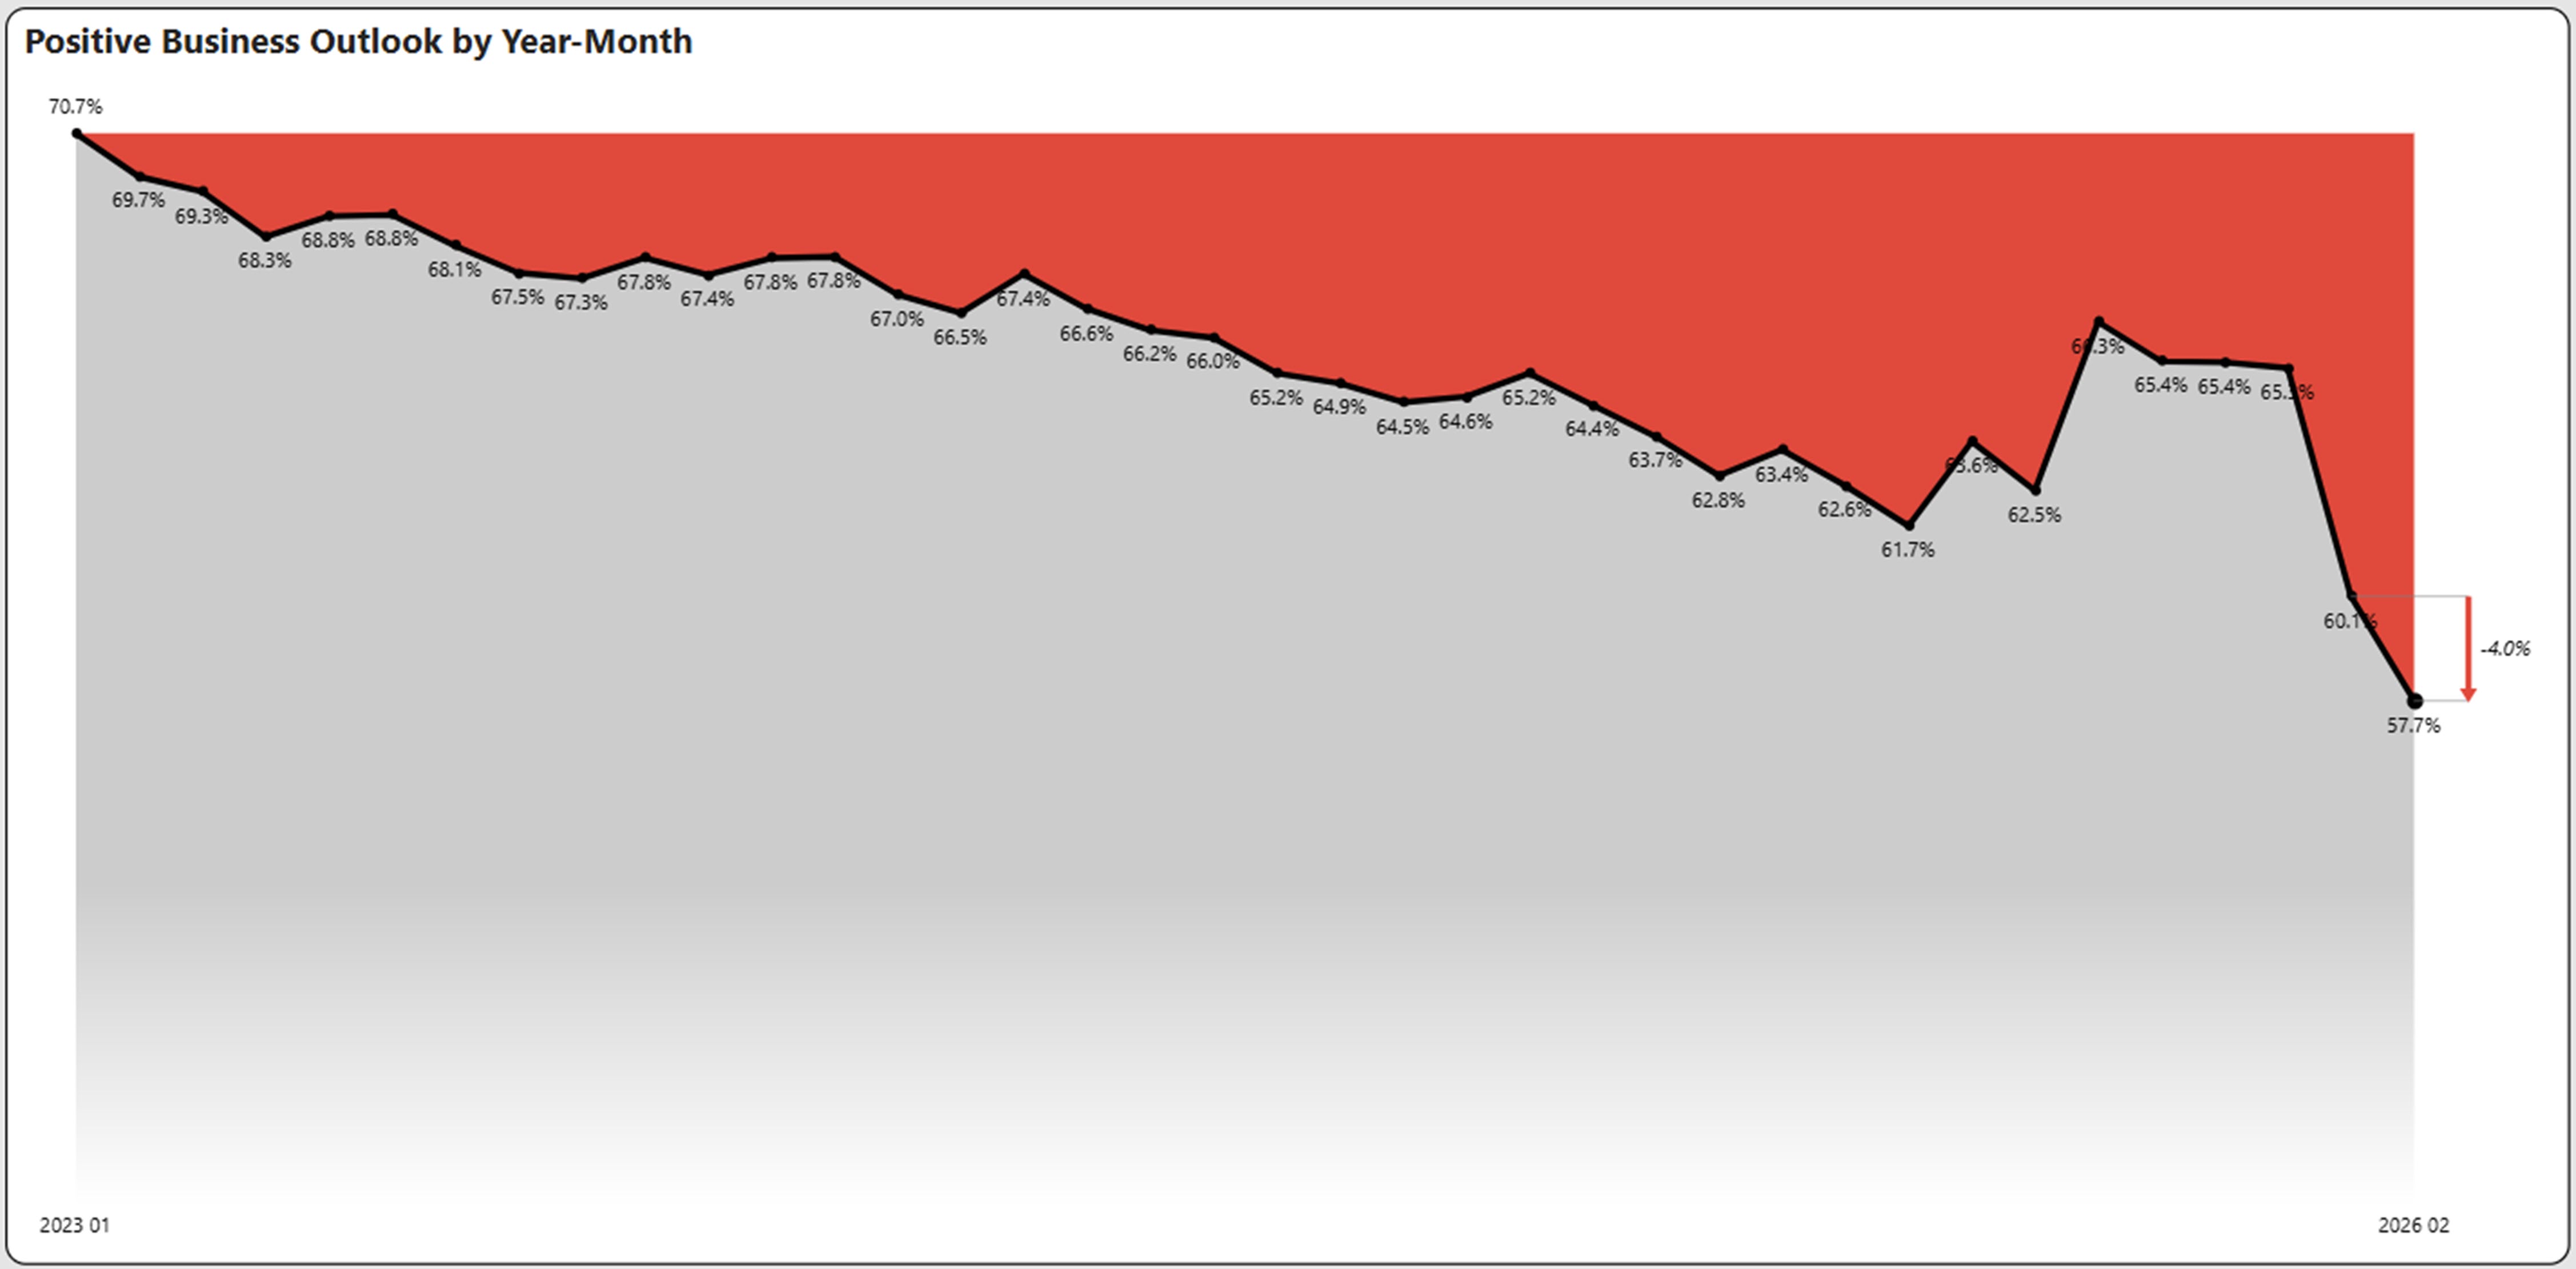
Positive Business Outlook
Positive Business Outlook aggregated from employer reviews data declined again in February to 57.7%. By comparison the “good old days” of early 2023 stood at over 70%. Now we see that nearly one out of two reviewers think that business outlook is negative.
Labor Market
Key Labor Market Takeaways
If You Liked the February 2026 Jobs Report – Get More Insights!
Try Our Free Version of TalentView to Get Instant Compensation, Postings, and Fill Days By Title, Company and Location (No Sign Up Required)
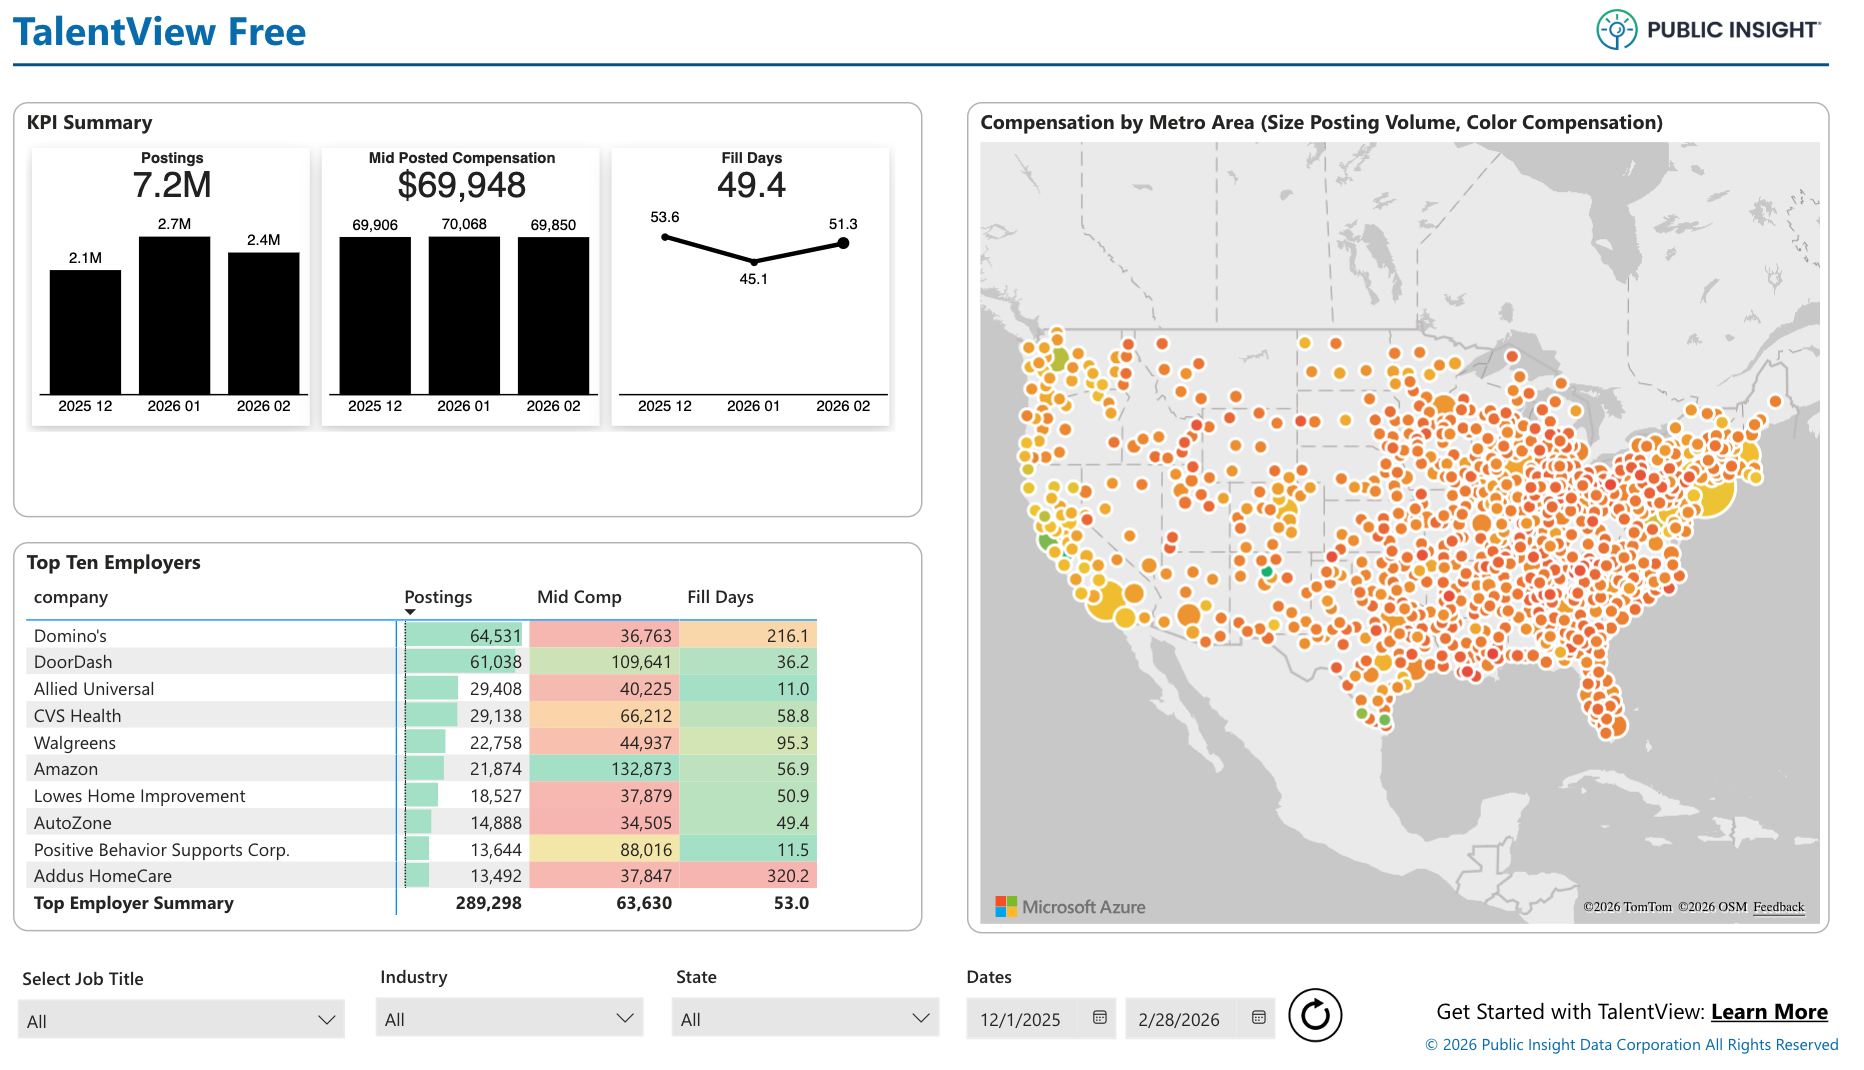
Example Insight: Top 10 Employers with the most job postings Dec 2025-Feb 2026.
Current Competitive and Market Talent Data is a Powerful Tool
What is TalentView?
Public Insight develops TalentView, a talent market intelligence solution that generated these insights. The most current and detailed insights are available by title, employer, location, industry and more. We provide flexible ways to utilize talent market intelligence, which include data licensing (API/feeds), interactive dashboards and reports.
How Can Our Must-Have Market Insights Help You?
- Justify Recruiting Decisions and Utilize Data to Tell Your Story
- Inform Recruitment Marketing Budgets, Strategies and Priorities
- Benchmark Employers Against Competitors
- Enhance Your Solution Offering (Solution Providers)
- Identify Business Development Opportunities (Solution Providers)
- Develop Content for Account Management and Marketing (Solution Providers)
Get Started!
Schedule a Call – Let’s discuss and demonstrate how you can leverage talent market data and insights
Sign Up for a Trial – Try out our interactive dashboards or get sample data