CDC Publishes 2016 Natality (Births) Data

The CDC recently released updated Natality (Births) data for 2016. State laws require birth certificates to be completed for all births, and Federal law mandates national collection and publication of births and other vital statistics data. The National Vital Statistics System provides access to statistical information from birth certificates and CDC makes this data available using the CDC Wonder tool. There are a wealth of category breakdowns of this data at national and regional levels subject to privacy suppression where the number of births is less than 10. 


We have curated the birth data into a new CDC Natality Interactive. We have aggregated all of the major category breakdowns including gender, race, age of mother, education, gestational period, and many more since 2000. We have applied this at the national, state, and county level (where data is available). This Interactive is automatically available to subscribers as part of our growing Community Health library.  


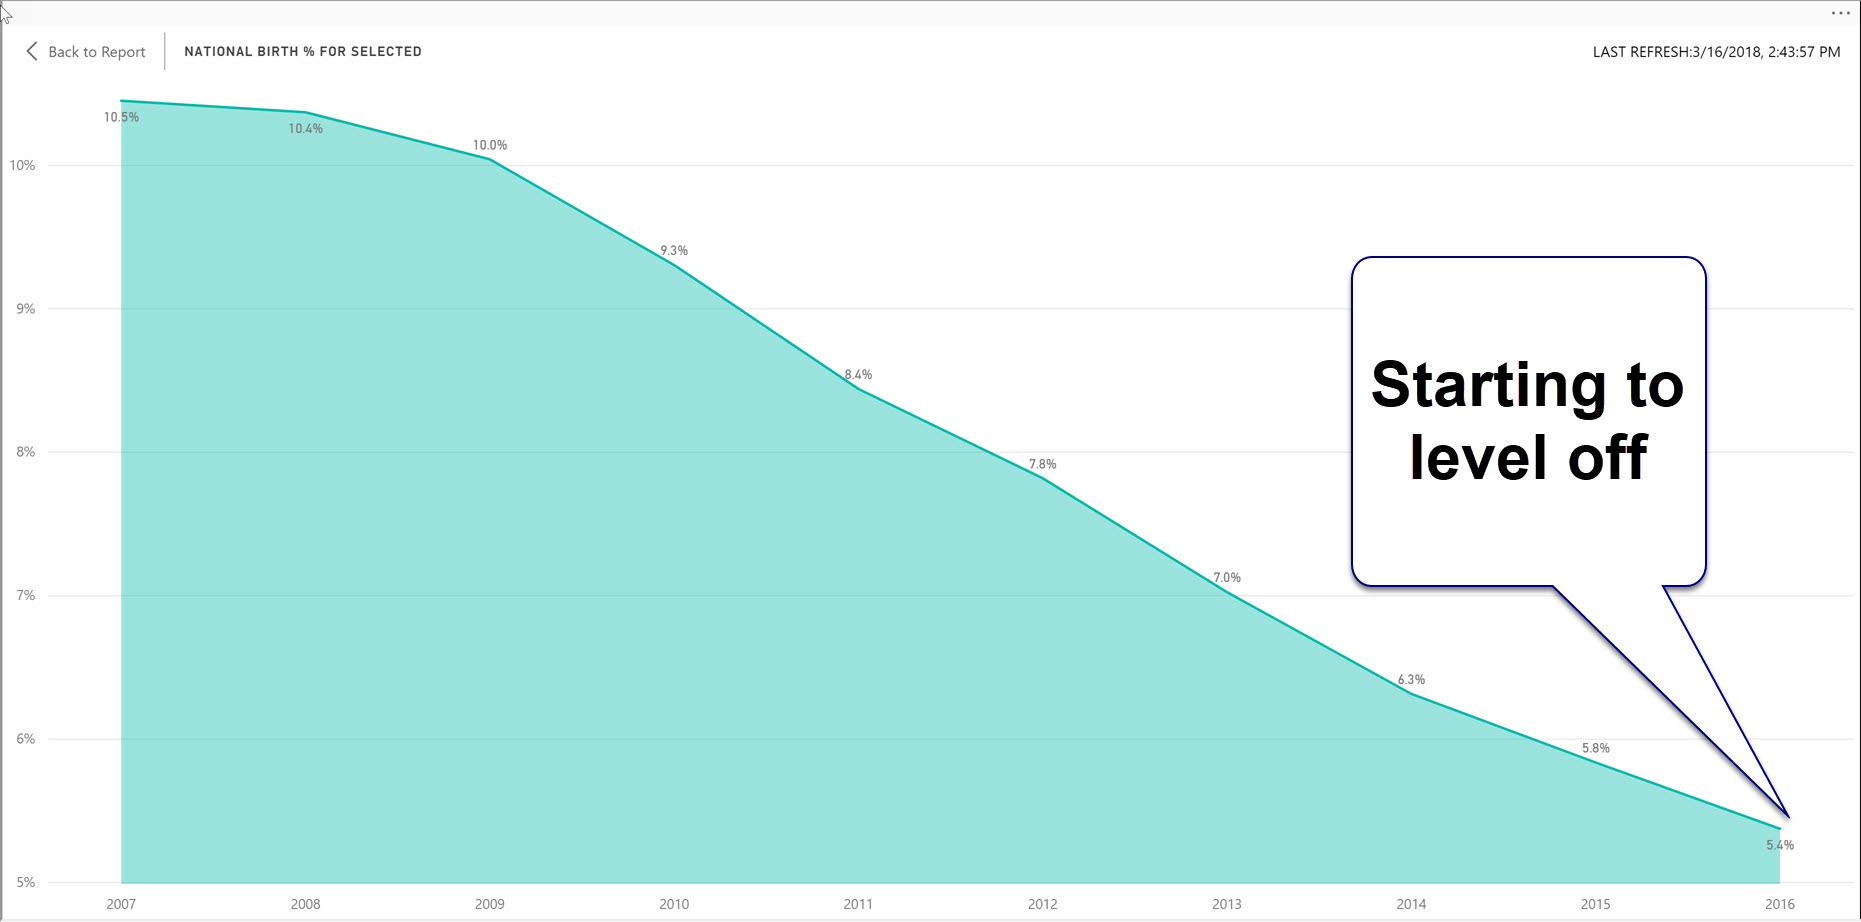
We will be diving into this data over the next several weeks and posting various video blogs and free Interactives. One topic sure to be interesting is teen birth rates. Teen birth rates continued to decline in 2016, but as you can see below, they have started to level off. In 2007, the teen birth rate across all races was 10.5%, but in 2016 it is now 5.4%. However the trend is not universal across all races. Asian teen births for example actually increased in 2016. We will look at this and other trends in the coming few weeks. 


Share This Story

Similar Posts

  • The States That Send Students Elsewhere

    IPEDS reports residency numbers for first-time undergraduates by state. This data can be challenging to work with from several perspectives. It is not collected every year by every institution and it does not summarize the students coming from out of the state of the institution.     The Enrollment Suite…

  • COVID-19 Dashboard with NYT Data

    Analyze COVID-19 Cases by National, State and County Level It is important for today’s business leaders to consider the impact of COVID-19 when making decisions and allocating resources. The accuracy of COVID-19 data reported by news sources and online publications goes beyond the numbers themselves, the interpretation of the statistics…

  • International Student Enrollment Visualized

    In last week’s blog, we talked about out of state enrollment and its potential impact on both the diversity and finances of the university. International enrollment is even considered a bigger potential bonanza to colleges and universities as many international students pay full tuition. According to the Institute of International…

  • Top 10 Projected Occupations in 2026

    Healthcare workers dominate the top 10 list for projected job growth. Nine of the top 10 jobs are projected to have greater than 30% growth over the coming 10 years. Using the new Degree-to-Jobs Interactive, we sorted the projections table by projected growth and isolated the top 10 jobs as shown…

  • Using AI to Break Down Head Count

    New Microsoft® Power BI Visual Dynamically Analyzes Categorical Data Like fashion goes in and out of style, so do visual ways of exploring data. Several decades ago I worked with a visual called the Decomposition Tree from an upstart company Proclarity from Boise, Idaho to analyze multi-dimensional data. That company…

  • Black Disparities in Premature Death

    County Health Rankings has always used Premature Death as a measure in deriving its ranking formula. Years of Potential Life Lost Before Age 75 (or YPLL) counts as 50% of the Health Outcomes score. Every death occurring before the age of 75 contributes to the total number of years of potential…