Public Insight’s September 2025 Jobs Report summarizes market insights from the millions of job postings, resumé updates and employer ratings/reviews available in our TalentView talent market intelligence platform.
Summary Dashboard
Comparisons of Key Metrics from September to August, July and June 2025 and to September 2024

Postings
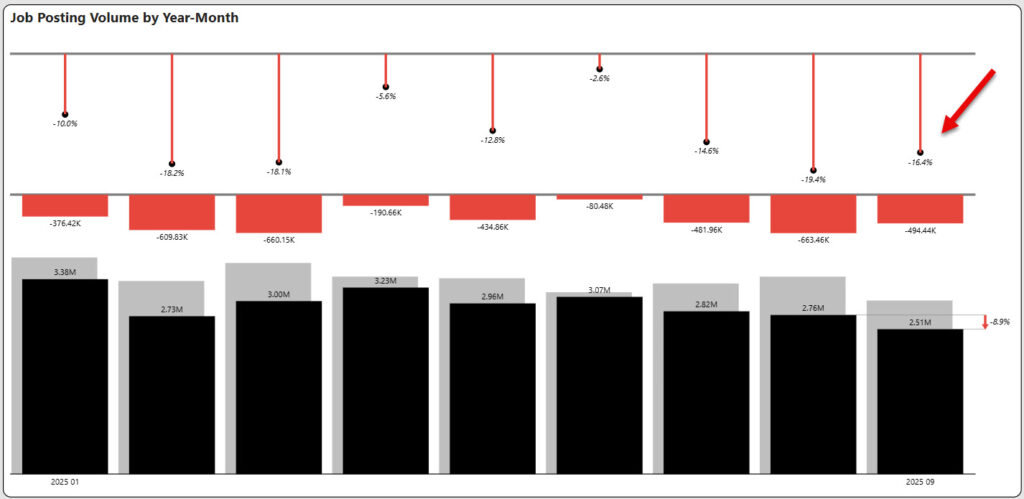
Posting Volume Declines Continue
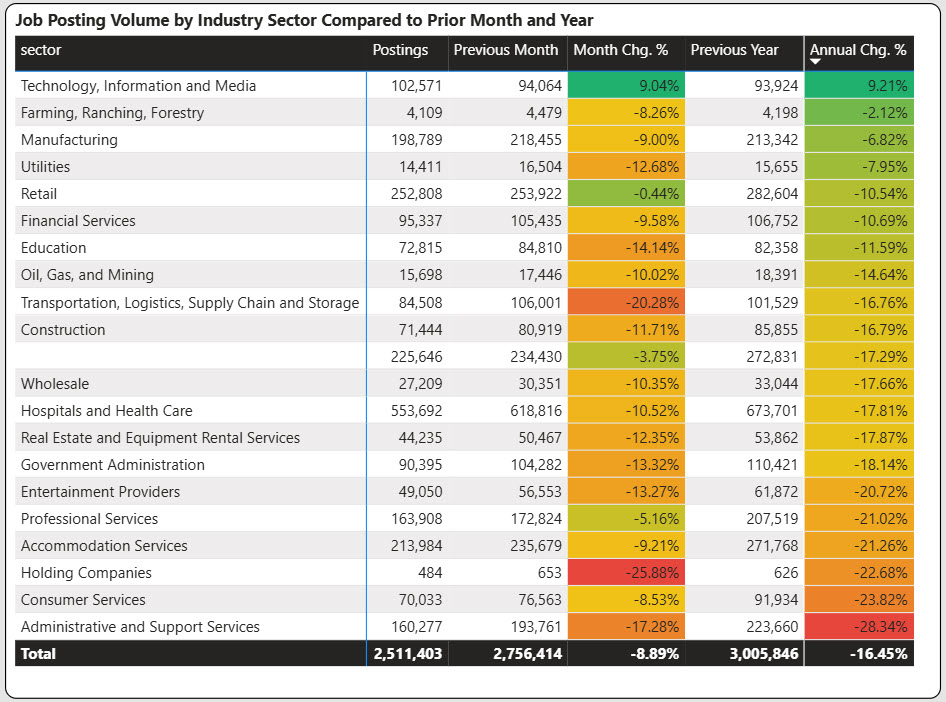
September job postings at 2.51 million declined 16.4% from the same period last year and sequentially 8.9% from August . Postings have declined from the prior year in each month in 2025.
Industry Analysis
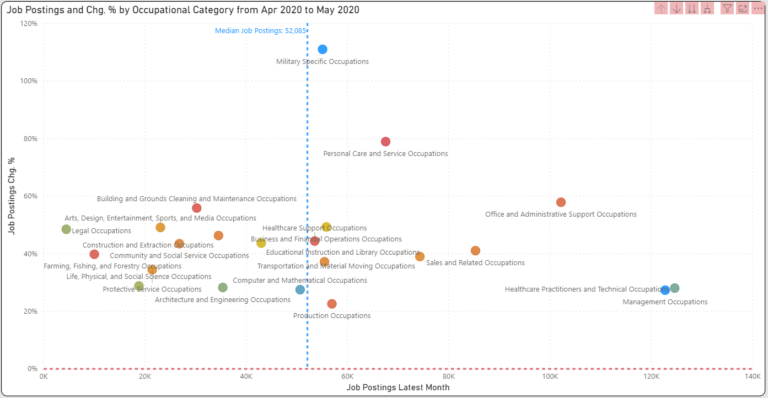
Year-over-year and month-over-month volume declines occurred in 19 of the 20 industry sectors. Highlights include:
- Only Technology, Information and Media has increased with a solid 9+% increase on both a year-over-year and a month-over-month basis. Retail was flat in September.
- Administrative and Support Services has experienced the greatest decline on a year-over-year basis of 28%. However this sector has experienced ups and downs throughout the year. Other major decliners were Consumer Services, Accommodation Services, and Professional Services.
- Transportation experienced the largest decline in September (outside of Holding Companies) at 20%.
- Hospitals and Health Care surprisingly remains challenging with a 10.5% decline in September and a nearly 18% decline from 2024.
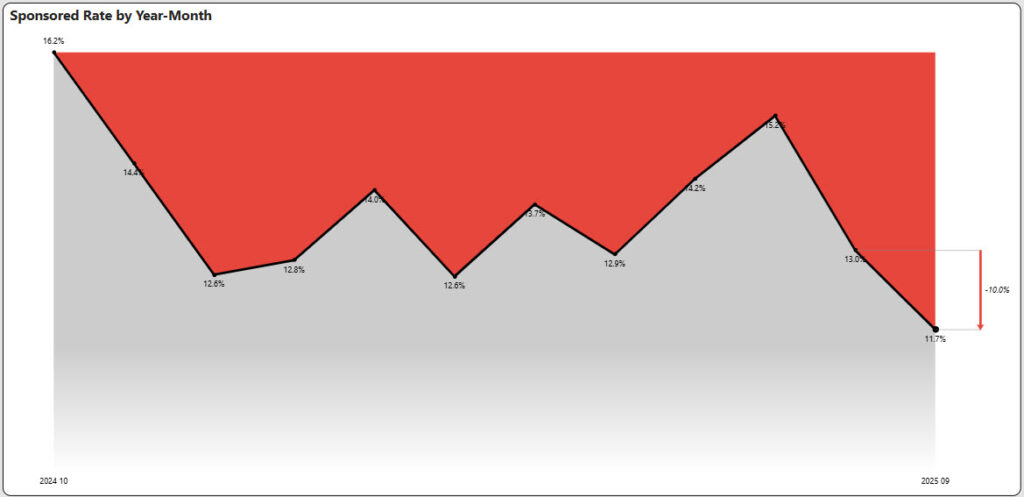
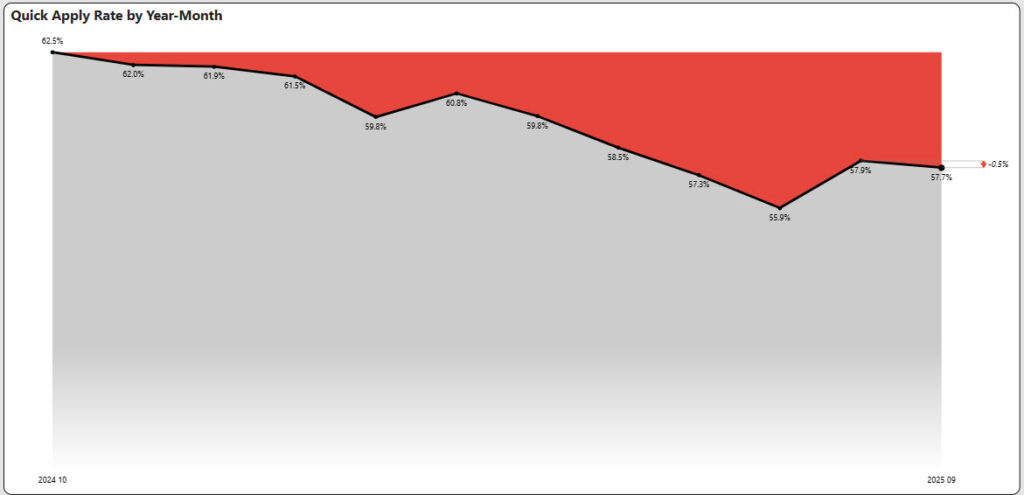
Sponsored and Quick Apply Rates Near Annual Lows
Sponsored rate is the percentage of job advertisements with a sponsor indicator. This is a measure of how active the job boards are. Sponsored rates started out the year above 16% but have now declined to 2025 lows at 11.7%.
Jobs ads’ Quick Apply Rate stayed flat at 57.7% and marginally higher than the 2025 low of 55.9%.
Artificial Intelligence (AI) Advertised Skills Growth
Job attributes are categories of skills or credentials that are assigned to an individual job posting. We have flagged AI related categories and plotted the trailing fifteen-month growth as shown below. AI skills while still a very small percentage of overall jobs show continued growth.
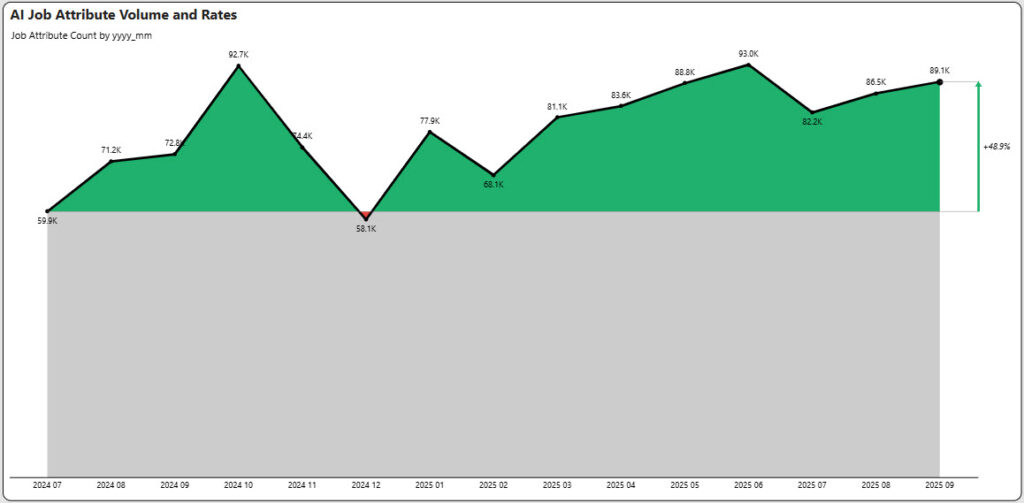
The top AI skills are Python, Machine Learning, Natural Language Processing, and TensorFlow. Most AI skills are wrapped into broader job titles such as Software Engineer or Data Scientist. The Machine Learning Engineer job title continues to grow and is the third highest job title with AI skills.
Fill Days Improves While Fill Rate Declines
Fill days use ad expiration and ad removal to determine a presumptive hire. When measured over a prolonged period of time and over millions of postings it provides a strong glimpse of the overall market. The trailing twelve months is used as a time horizon for our analysis.
In the graph below, we show the fill days by month along with the percentage of ads (blue line) that have been filled. Obviously, the more recent ads have a lower fill rate.
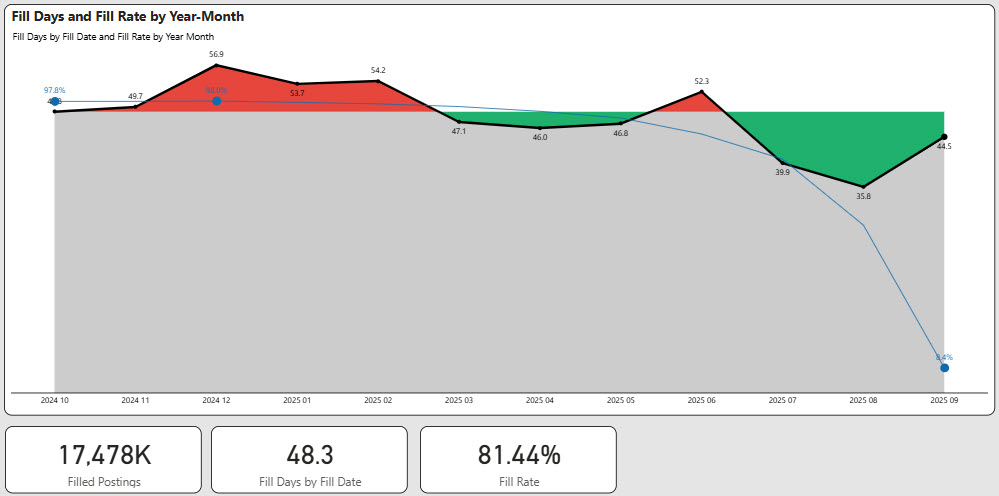
Fill days as a composite decreased slightly in the September analysis from 49.5 days to 48.3 days, a one-day improvement. The percentage of ads filled during the analysis timeframe however decreased from 83.2% to 81.4% indicating a bit less success in filling jobs over the time period.
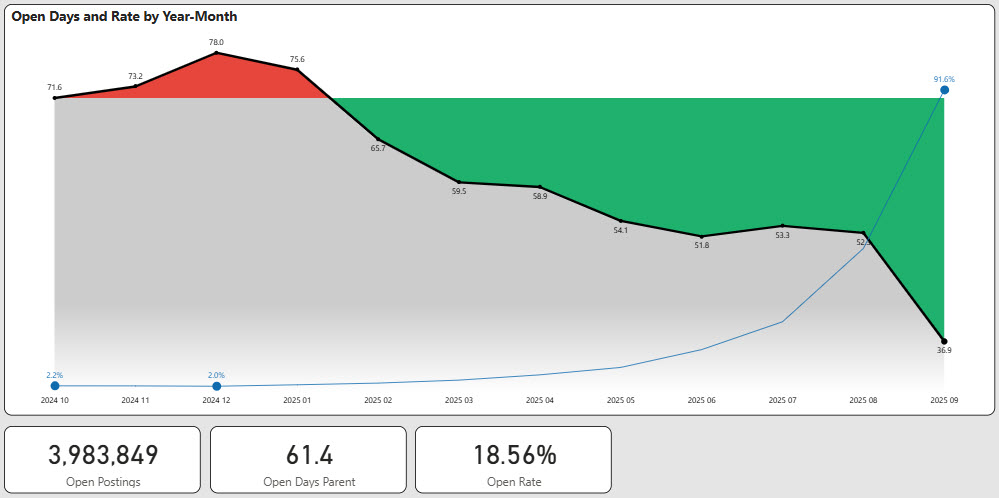
Open Days Declines While Open Jobs Increases
Open days are postings that are still determined to be open. We track every job posting uniquely and determine its fill status on a weekly basis. Generally, we have found 12 months to be a suitable time period to evaluate the age of open days. Older postings may distort the open days as they may represent “evergreen” postings. For this reason we eliminate implied evergreen ads that are older than one year.
The graph below shows the aging of open postings for the past twelve months. Open days declined from 65.1 in June to 61.4 in September, which is a significant improvement. However, the percentage of open jobs increased from 16.8% to 18.6%. The number of open jobs over a trailing twelve-month period increased from 3.6 million to nearly 4.0 million, suggesting a tightening of the labor market.
Compensation
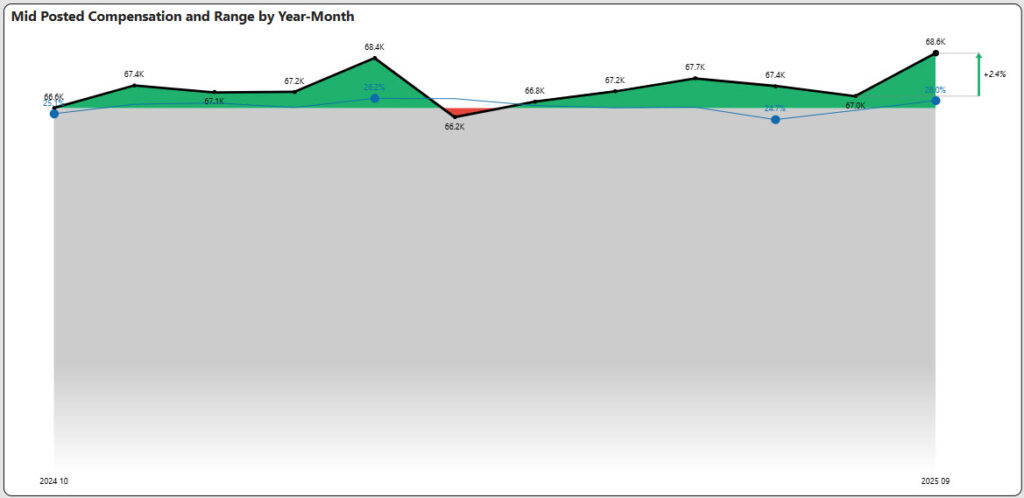
Compensation Finally Increases in September
In this September 2025 Jobs Report, we see that mid-posted compensation increased 2.4% to $68,600, a twelve-month high. This is the first meaningful increase in the past six months. In addition, the range of pay between max and min as a percentage of the midpoint increased from 25.3% to 26.0%, suggesting some flexibility in negotiated pay.
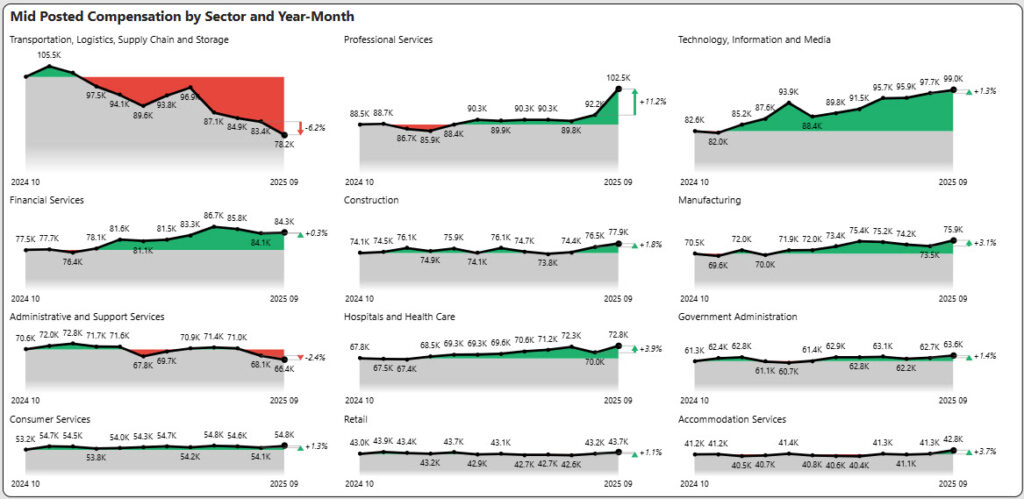
Compensation by Industry Sector
- Transportation continued its decline with an additional 6.2% and is now down nearly 26% compared to last year.
- Professional Services surged 11.2%, driven primarily by increases in lawyers, software developers, and management analysts.
- Technology and Financial Services after a prolonged slump in 2023-2024 continues to set new twelve-month highs.
- Administrative and Support Services comp declined 2.4%, the third straight declining month.
- Manufacturing, Hospitals and Health Care, and Accommodation Services all experienced increases of greater than 3% after previous sluggishness.
Supply and Demand
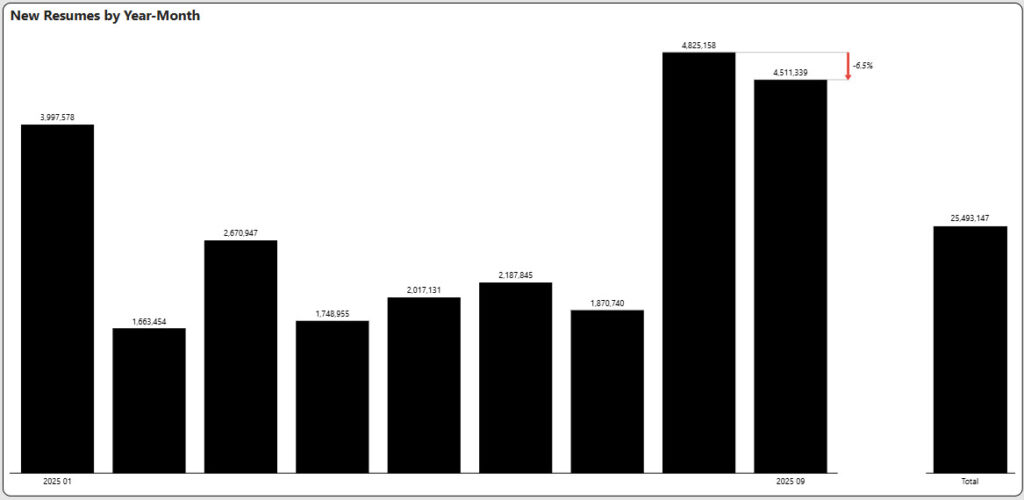
Late Summer Influx of Resumes
The total number of resumes over the trailing nine months declined from 26.1 million to 25.5 million. However, nearly one-third of these resumes were published in the late summer indicating renewed job seeker interest. This does not mean that these individuals do not have a current job. In fact as noted in the Labor Market section, Quits are at five-year lows while Layoffs and Discharges also remain low by historical standards. What this does reveal however is that job seekers are nervous and getting more aggressive in their outreach.
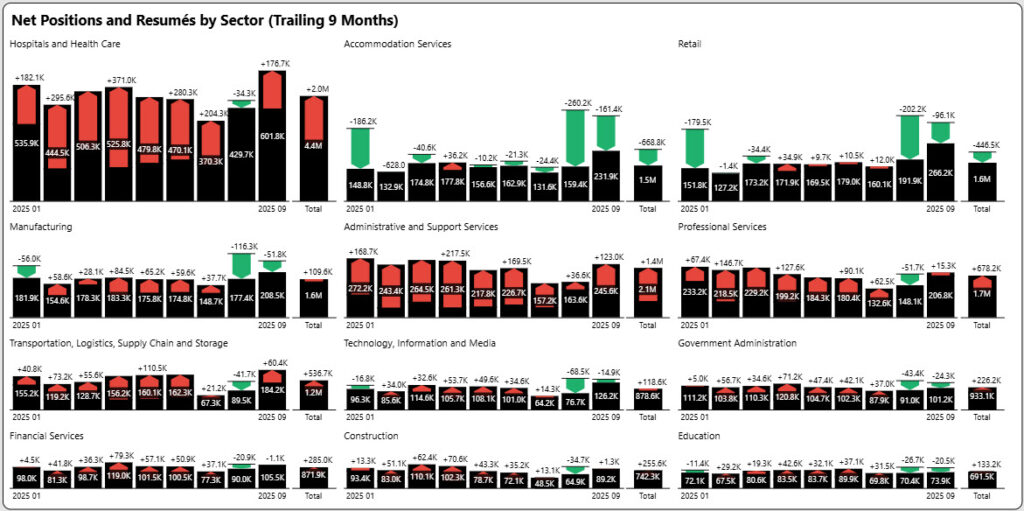
Supply/Demand Imbalances Tilt Towards Demand
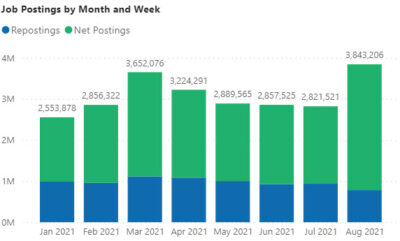
To highlight supply/demand imbalances, we superimpose job seekers based on resumés over net job postings (black bar). We can then look at this supply and demand in diverse ways. The graphs highlight a supply surplus (more job seekers than net postings) shown in green, or a supply shortage (less job seekers than net postings) shown in red. We picked a time period of nine months which highlights the current market surplus or shortage. The total bar reflects the summaries of openings and resumés for that time period.
In the graph below, we see that Administrative and Support Services maintains its shortage trend, and Professional Services and Transportation after a brief oversupply in August, came back to a shortage in September.
Supply/Demand Scorecard
We highlight the current state at the end of September as well as the most recent changes over the last nine months. A change is not necessarily good or bad, but we have highlighted changes in supply/demand gaps that impact the current trends.
Overall net positions for the trailing nine months increased slightly from June to September while resumes declined slightly. Thus, little has changed in the supply/demand positions from June to September. Those sectors with unmet demand continue to have unmet demand. However, the resumes are very backloaded as we noted in the previous section. If this trend continues, we would expect these indicators to tilt more and more towards supply exceeding demand.
| Sector | Current State | Previous State |
| Hospitals and Health Care | Heavy Unmet Demand | Heavy Unmet Demand |
| Accommodation Services | Moderate Oversupply | Moderate Oversupply |
| Retail | Moderate Oversupply | Moderate Oversupply |
| Professional Services | Heavy Unmet Demand | Heavy Unmet Demand |
| Manufacturing | Parity | Parity |
| Transportation, Logistics, … | Heavy Unmet Demand | Heavy Unmet Demand |
| Construction | Heavy Unmet Demand | Heavy Unmet Demand |
| Technology, Information, … | Slight Unmet Demand | Moderate Unmet Demand |
| Financial Services | Moderate Unmet Demand | Moderate Unmet Demand |
| Education | Moderate Unmet Demand | Moderate Unmet Demand |
| Consumer Services | Parity | Slight Oversupply |
| Entertainment Providers | Parity | Parity |
| Wholesale | Moderate Unmet Demand | Moderate Unmet Demand |
| Administrative and Support Services | Heavy Unmet Demand | Heavy Unmet Demand |
Worker Sentiment
Net Promoter Score Maintains Improvement
After a brief setback in May, Net Promoter Score resumed its upward trend.
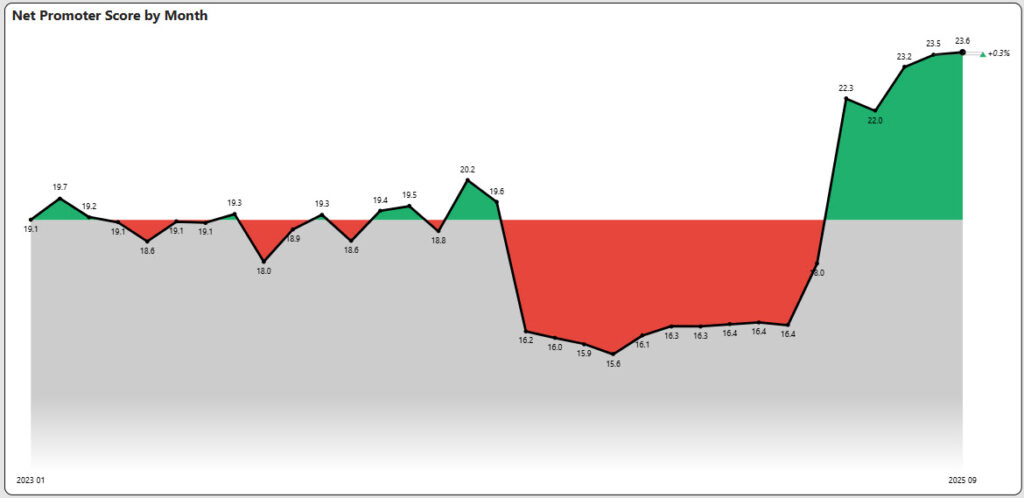
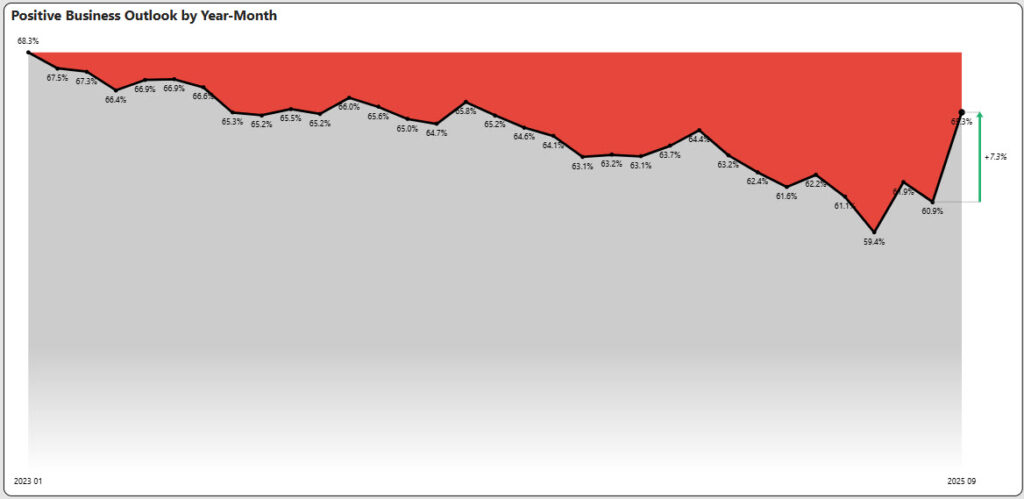
Positive Business Outlook based on Glassdoor reviews finally increased in September after a long downward trend. Both are encouraging signs that worker attitudes are improving.
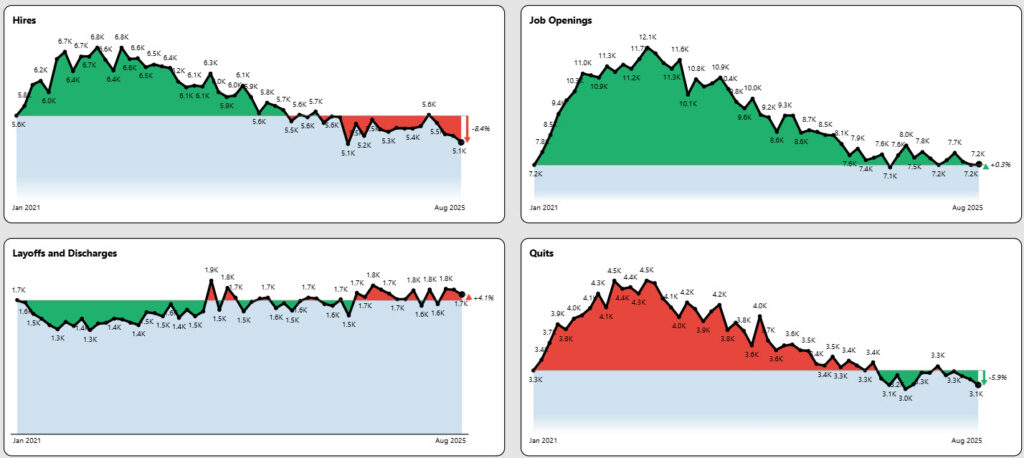
Labor Market
Key Labor Market Takeaways
- Job Hires declined 2.1% in August from 5.2 million to 5.1 million. This ties with June 2024 for the low water mark over the past five years.
- Job Openings stayed flat at 7.2 million also tying the five-year low water mark.
- Layoffs and Discharges declined 3.5% in August and has remained in a tight range since early 2023. Layoffs and Discharges are still well within historical levels.
- Quit rates decreased from 2.0% to 1.9% and are now about 20% below historical levels. These rates are also nearly 40% below the quit peak of 3.0% in November 2021.
If You Liked the September 2025 Jobs Report – Get More Insights!
Try Our Free Version of TalentView to Get Instant Compensation, Postings, and Fill Days Insights By Title, Company and Location (No Sign Up Required)

How Would Your Company, Competitors, Industry and Job Titles Compare?
Wouldn’t you want these insights for your industry, job titles, locations and to compare against competitors?
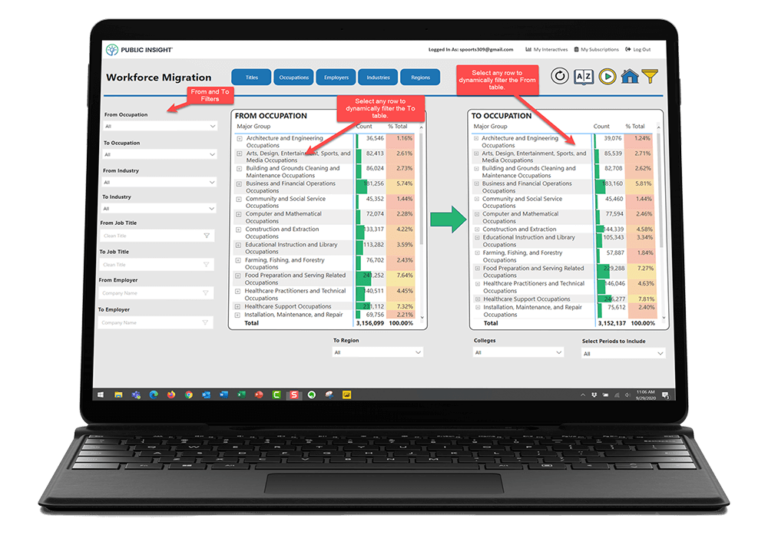
What is TalentView?
Public Insight develops TalentView, a talent market intelligence solution that generated these insights. The most current and detailed insights are available by title, employer, location, industry and more. We provide flexible ways to utilize talent market intelligence, which include data licensing, interactive dashboards and reports.
How Can Our Must-Have Insights Help You?
- Inform/Justify Recruiting Decisions and Prepare For Hiring Manager Discussions
- Inform Recruitment Marketing Budgets, Strategies and Priorities
- Benchmark Employers Against Competitors
- Enhance Your Solution Offering (Solution Providers)
- Identify Business Development Opportunities (Solution Providers)
- Develop Content for Account Management and Marketing (Solution Providers)
Get Started!
Schedule a Call – Let’s discuss and demonstrate how you can leverage talent market data and insights
Sign Up for a Trial – Try out our interactive dashboards or get sample data