When nursing home incidents occur, they receive big news. Just this week, a Pinellas Park, Florida nursing care center resident died after appearing to have been left outside in the sun. The nursing home had been cited for various deficiencies and had received a one-star rating. In fact, the nursing home had 96 deficiencies cited going back to 2010 including 33 in 2015 alone based on data compiled from CMS in Public Insight.
State inspectors work as agents on behalf of the U.S. Centers for Medicare and Medicaid Services (CMS). CMS provides guidelines as to what constitutes deficiencies and deficiencies must be documented in a consistent manner. CMS documents nursing home deficiencies quarterly as part of the public reporting process. Because nursing home inspections occur over time, it would be inconclusive to look at any particular nursing home for any individual quarter. However, over time we can gauge the magnitude of deficiencies and the rate at which they are assessed.

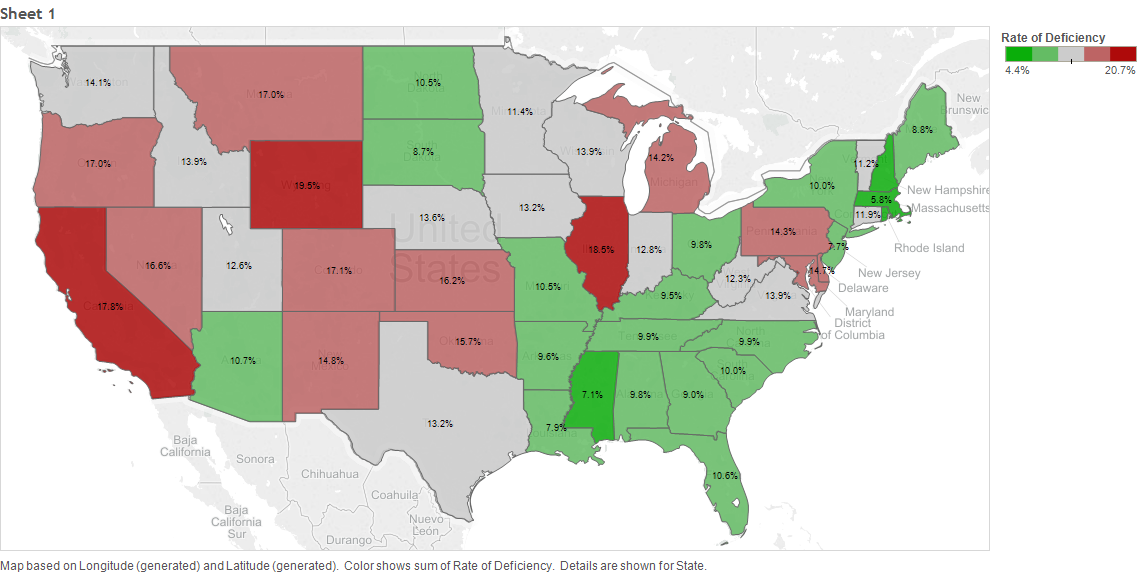
We used Public Insight OmniView (see video blog) to aggregate the number of deficiencies over the trailing five quarters (Q1 2016 and all of 2015) for 14,710 nursing homes. We then compared the number of deficiencies to the cumulative number of residents in nursing homes for the state to create a deficiency rate which we used as a benchmark indicator. This takes advantage of the regional linkages available coming soon OmniView. The map below in Tableau shows the range of deficiency rates by state.

-
The average deficiency rate (total number of deficiencies/current number of residents) was 12.5% through this five quarter period.
-
Deficiency rates range from 4.4% (Rhode Island) to 19.4% (Wyoming) in the continental US. Of the large states, California has a 17.8% deficiency rate.
Deficiency rates in Public Insight can go further down to severity and type. Deficiency rates alone do not indicate the quality of nursing homes in a particular state. Nor does it mean that any particular state is over-zealous or not zealous enough in its inspections. For example, high police violations do not signal a lower crime rate. However, it does reinforce the range of potential quality enforcement that does exist across the U.S. despite the best of intention.
As with every analysis done in our blog posts, you can conduct the same type of research using Public Insight’s Premium Tools like OmniView. A subscription to Public Insight Premium includes a 30-day, risk-free guarantee. If you don’t like the analysis features of Public Insight, contact us for a full refund. To find out more about Public Insight’s Premium Tools and how they can benefit you and your organization, click HERE.