Is Education Required for Fast Growing Jobs?

A hot topic, especially when new job projections come out, is whether the high growth jobs require much in the way of education. Jed Kolko at Indeed Hiring Labs did a very thorough job of analyzing projected occupational growth against their respective education requirements. His conclusion was that the slower or negative growth jobs require minimal education but the growth areas require further education. The article focuses on the typical education required, but the Bureau of Labor Statistics also provides educational attainment percentages for each occupation. We can blend the educational attainment rates against the projected growth rates and the median wage.


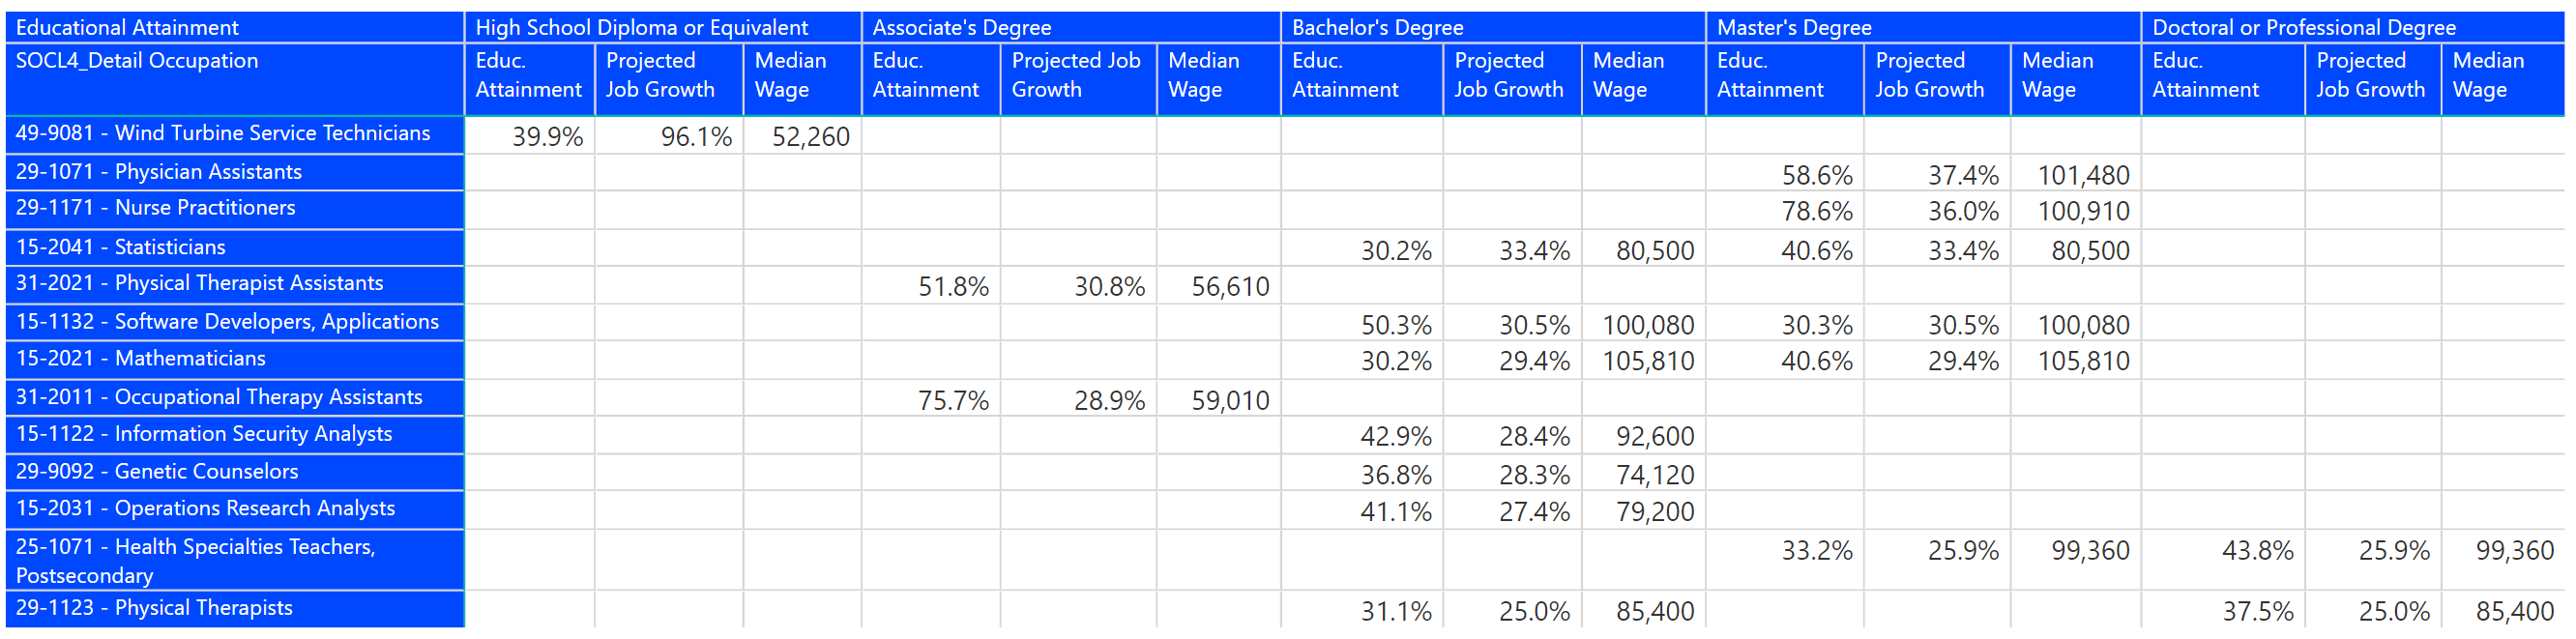
I modified the Degree-to-Jobs Interactive to organize the occupations into educational attainment buckets and looked at job growth and median wage. For example, I filtered for only those occupations that are expected to grow 20% without regard to median wage. This brought 12 occupations that only require a high school education. If I increase the minimum median wage to $40,000, I still get five occupations requiring no college education.  However, if I increase the job growth rate to 25% and the minimum median wage to $50,000, 11 out of 12 occupations require a college education as shown below. This threshold seems to knock out high school only education levels.


We have created a new Free Interactive called Job Projections and Education on our site.  You can fine-tune the filtered selections to select the parameters of the table. You can also sort and export the table. To access Free Interactives, you simply have to register.  Free Interactives will show up at the bottom of the Interactives page as shown below. Simply click the view link to launch the Interactive.


Share This Story

Similar Posts

  • Hot Jobs, Growing Wages, and Weird Titles

    I love looking at the Bureau of Labor Statistics Occupational Employment Statistics data. This data produces employment and wage estimates annually for over 800 occupations and estimates for states and metropolitan areas. I especially enjoy looking at this data from both a job growth and a wage growth perspective. That…

  • Visualizing Student Debt and Earnings

    Leveraging Scatterplots to Analyze the New College Scorecard Data There has always been a symbiotic relationship between student debt and student earnings. As student debt has creeped up in recent years, there has also been a data gap with post-graduation earnings. The most recent College Scorecard data is a first…

  • Regional Disparities in Health Insurance

    We all know that health insurance is a moving target. According to the most recent ACS survey data, the national uninsurance rate declined from 13.0% to 11.7% in 2016. Public insurance coverages increased slightly more than private coverages (increases of .9% and .6%) respectively. This change was short-lived as Gallup…

  • Outpatient Medicare Hospital Costs up 13%

    The 2016 outpatient procedure data shows overall hospital volume up 11% from 2015. Using data from the Outpatient Procedure Analysis Interactive, we also found that the volume times the average full cost (weighted average cost) on a procedure basis has increased 13.3%. We ran the numbers several ways – first…

  • Regional Variations in Opioid Prescribing Rates

    Given the state of the opioid crisis, any meaningful data is valuable. So when CMS released three years of Opioid Part D prescription data in November, we all rejoiced. CMS also released a mapping tool to analyze the data. While mapping tools can be effective, they can also get in…