Infection Procedures Top Inpatient Volume Growth

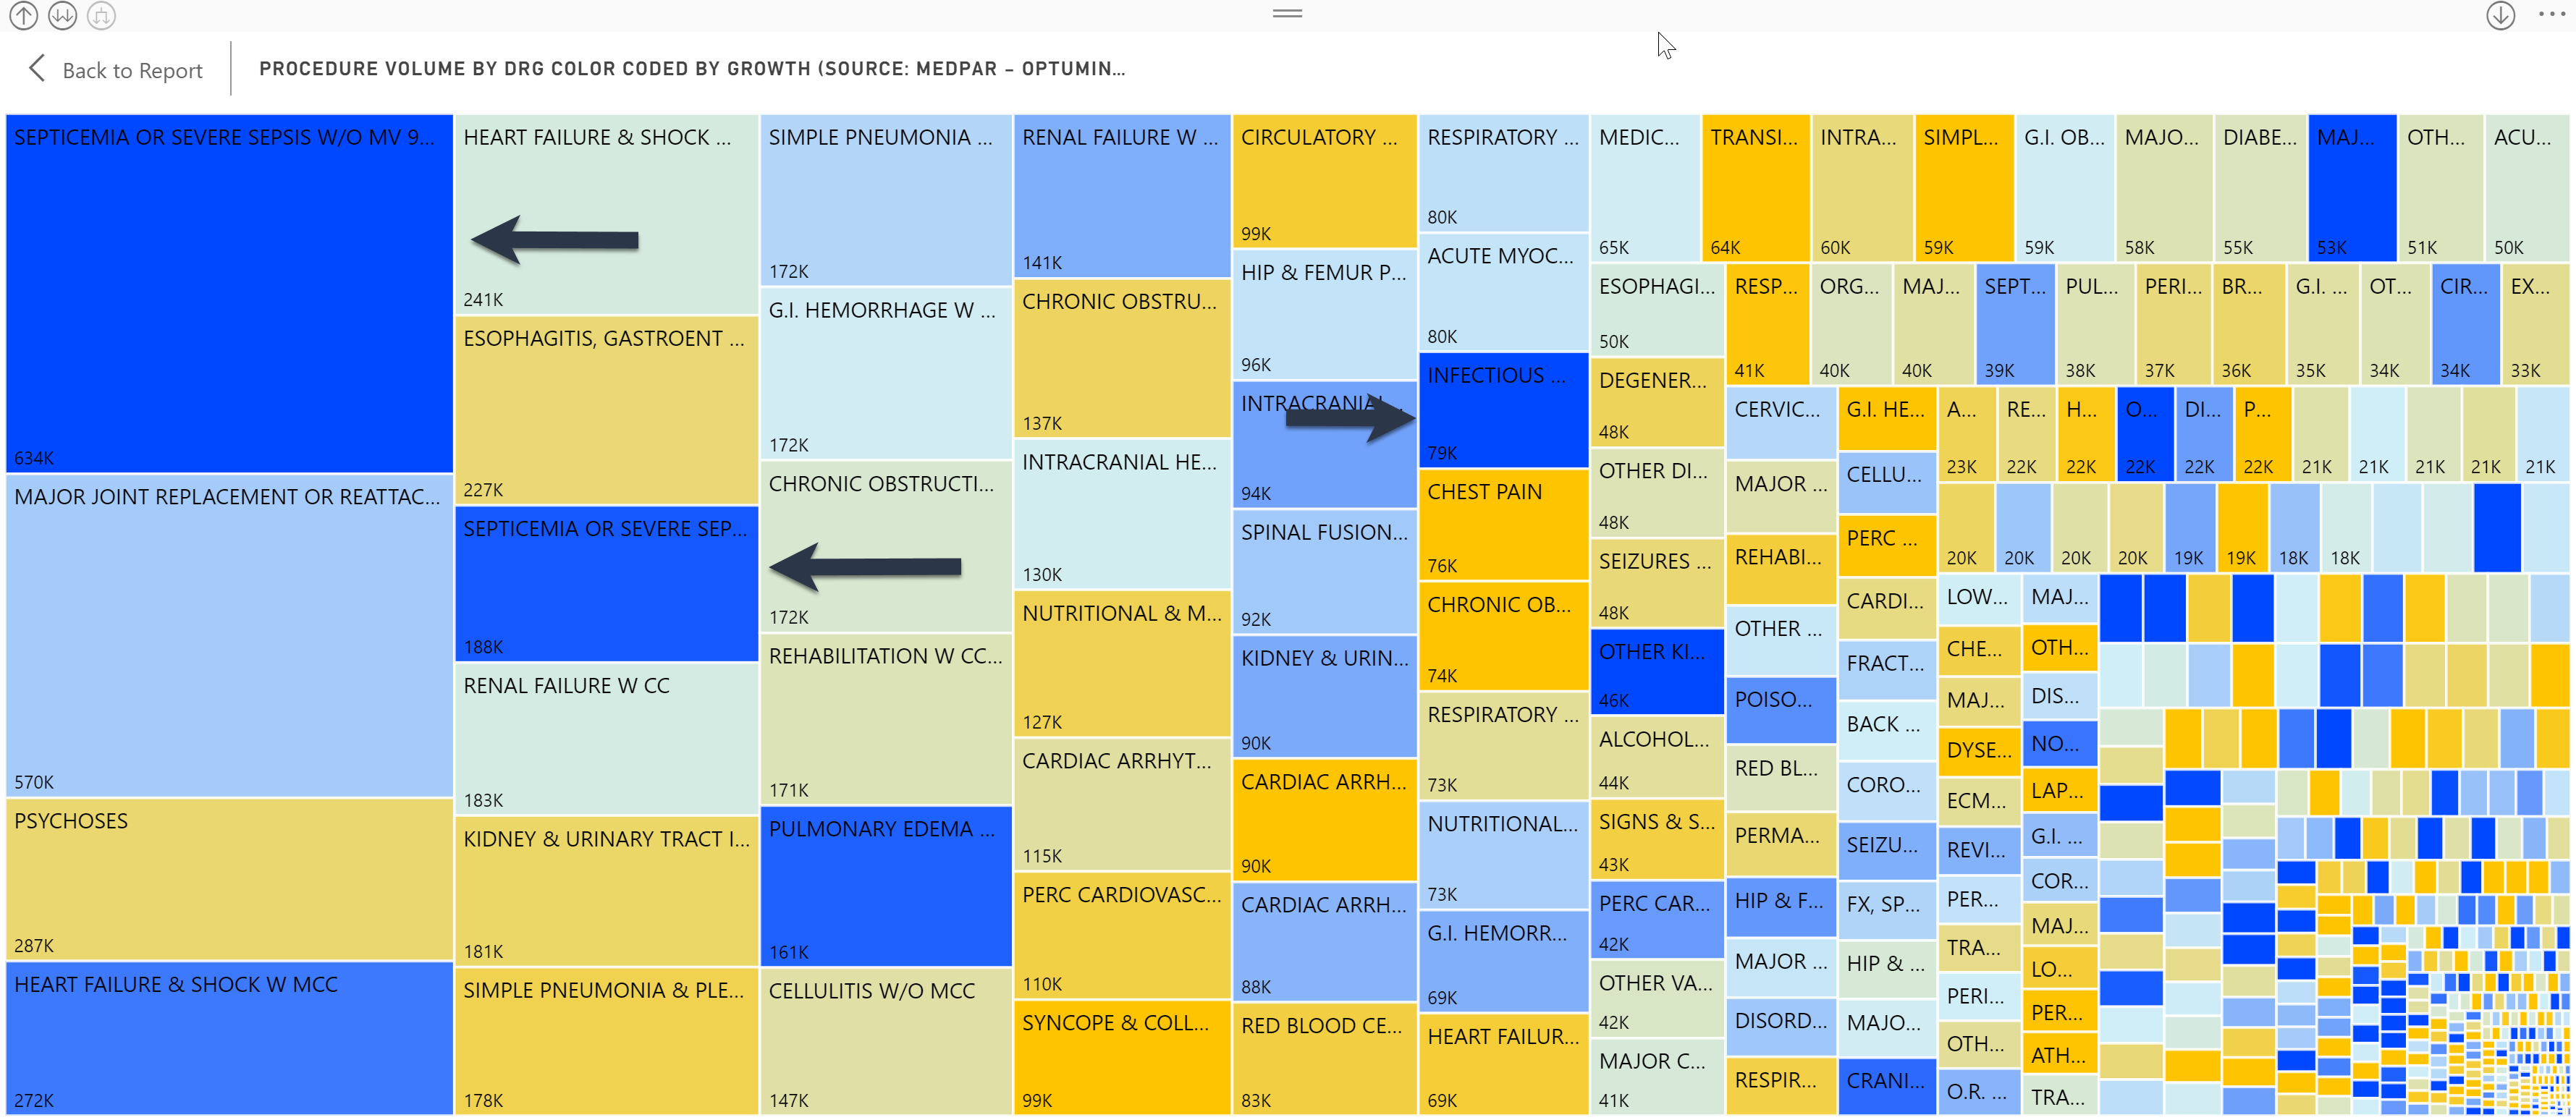
While Medicare inpatient procedure volume has remained flat since 2013, infections are a significant area of high volume change. The treemap below from the Inpatient Procedure Analysis Interactive shows the inpatient volume growth by procedure with color coding by volume change from 2013-2015 using the Medicare Provider and Analysis Review (MedPAR) file. The size of the data square indicates the relative number of procedures while the dark blue color indicates the highest growth.


Septicemia or Severe Sepsis with major complications provided both the highest number of procedures at 633,593 or about 6% of all inpatient procedures AND the highest volume growth at 33%. Further, other infections and infectious diseases have exhibited high inpatient volume growth.


Reasons for the rise in Septicemia or Severe Sepsis procedures vary. According to the Washington Post, this increase may be related to several causes, including an increase in the number of invasive surgeries, the rise of antibiotic resistant bacteria, and those who have compromised immune systems such as people with AIDS or those receiving chemotherapy.

Share This Story

Similar Posts

  • Violence Against Women Offenses Up 9.5%

    This is the third year that the Campus Safety and Security (CSS) data has released separate violence against women (VAW) offenses. This data captures three types of offenses; domestic violence, dating violence, and stalking and analyzes it for both on campus and off campus locations. Overall, there were 16,183 VAW…

  • Is Bureau of Labor Statistics Data Adequate?

    Several weeks ago, the Bureau of Labor Statistics (BLS) released updated Occupational Employment Statistics (OES) survey data. BLS OES is one of those foundational programs and datasets that are used for comprehensive occupational analysis. It produces employment and wage compensation estimates annually for nearly 800 occupations. These estimates are available…

  • Where the Vets Live

    As we approach this Memorial Day Weekend, we pause to remember the sacrifice made on our behalf by our veterans. Nationwide veterans comprise 8% of the population. But there are clusters of populations where veterans comprise much higher percentages of the population. This article from Trulia published in Forbes back…

  • Self-Funded Research Remains the Trend in Higher Education

    Research and development expenditures continued their flat growth since 2011 according to the most recent data from the National Science Foundation Higher Education Research and Development Survey (HERD). Research expenditures increased 1.66% for all reporting institutions from 2013 to 2014 and have increased cumulatively only 4.76% since 2011.  The primary…