Black Disparities in Premature Death

County Health Rankings has always used Premature Death as a measure in deriving its ranking formula. Years of Potential Life Lost Before Age 75 (or YPLL) counts as 50% of the Health Outcomes score. Every death occurring before the age of 75 contributes to the total number of years of potential life lost. For example, a person dying at age 25 contributes 50 years of life lost, whereas a person who dies at age 65 contributes 10 years of life lost to a county’s YPLL. The YPLL measure is presented as a rate per 100,000 population and is age-adjusted to the 2000 US population.


The 2018 County Health Rankings has disaggregated this measure to Black and Hispanic populations. On average, U.S. counties have a YPLL of 8,194. Whites have a YPLL of 8,206 or right around the overall average. The Black or African American YPLL on average is 10,688 or 30% higher than the white population. Interestingly, the Hispanic YPLL is on average 6,162, or 25% less that the white population. This phenomena has been studied by a number of researchers. The YPLL measure is part of the County Health Rankings Interactive. You can now purchase these Interactives individually or as part of the Community Health Library


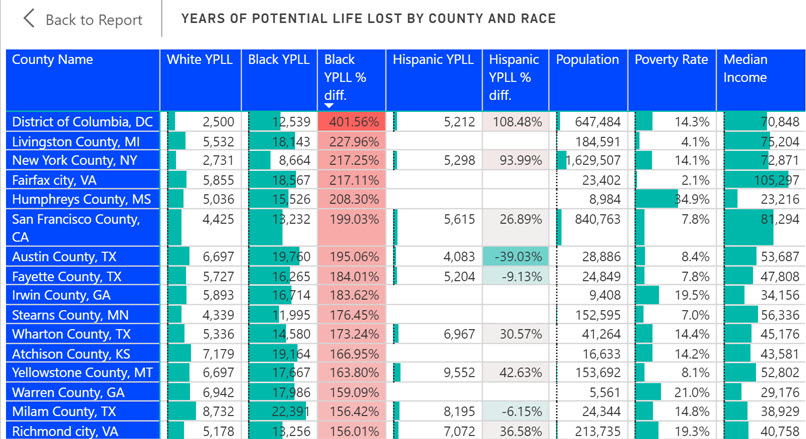
Regionally, YPLL is literally all over the map. The Black YPLL in Washington, D.C. is 4x higher than white and dwarfs the next highest county as shown in the following table. While the Black/White YPLL disparities do seem more likely in urban areas, it is not always absolute as noted by the county population and poverty rate. Clayton County, GA for example has a Black YPLL of 7,723 compared to White YPLL of 12,525 or Black/White YPLL of -38.4%. Clayton County is urban (near Atlanta), has a 68% black population and a 21% poverty rate. 


We have created a free Interactive which you can use to interact with this data which I have found to be fascinating. The table can be sorted by any of the columns and you can filter on any state. Keep in mind that this data is not available for all counties.  


Share This Story

Similar Posts

  • STEM Enrollment Fields Show Strong Growth

    The IPEDS Enrollment by Major Fields of Study is collected every other year and 2016 is a new reported year. IPEDS collects nine major fields of study and the enrollment is disaggregated by attendance status (full-time, part-time), level (undergraduate, graduate), race, and gender.   There are numerous ways to breakdown…

  • CMS Releases 2016 Opioid Prescription Data

    This week, CMS released 2016 Opioid Part D Prescribing Rates data which follows on the heels of the original release several months ago. This data release includes Opioid prescriber, claims, and extended release claims at the national, state, county, and zip code level. We have updated our Opioid Prescribing Rates…

  • Student Earnings Experience a Sluggish Recovery

    College students are earning 8% less in 2013 than in 2008 per the most recent data published by the US Department of Education College Scorecard database. Students earned $31,382 in 2013 compared to $34,119 in 2008. The earnings were ostensibly flat from 2012 earnings of $31,528.   The College Scorecard…

  • Distance Education Programs Growth Up 18%

    After a few weeks break, we are back with this week’s edition of the Insight for Education blog. In my previous blog on distance enrollment, we cited that distance enrollment exclusive growth was up nearly 15% and more and more schools were offering distance education. In this analysis we wanted…

  • Room and Board Cost Increases Slowing

    After three straight years of 3-5% increases, room and board annual growth has finally slowed to a more pedestrian 2-3%. In recent years, universities have invested heavily in on-campus facilities and presumably passed these costs to the students at a rate greater than inflation. One administrator once told me that on-campus facilities…

  • Is the Federal Work Study Program Working?

    Over 4,000 institutions participate in the Federal Work Study Program. This program provides funds for part-time employment to help needy students finance the costs of postsecondary education. For the fiscal year ending June, 2016, $1.16 billion was paid to students under this program. This was roughly the same as the…