Spring is Here! Which Counties are Physically Active

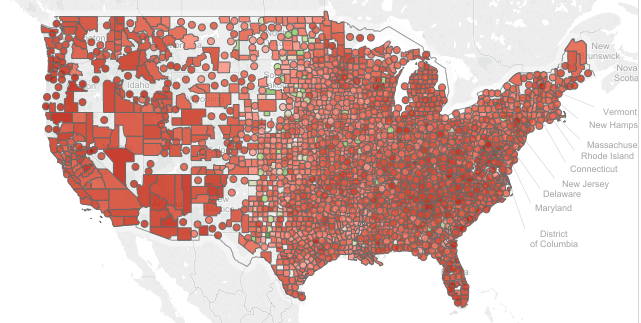
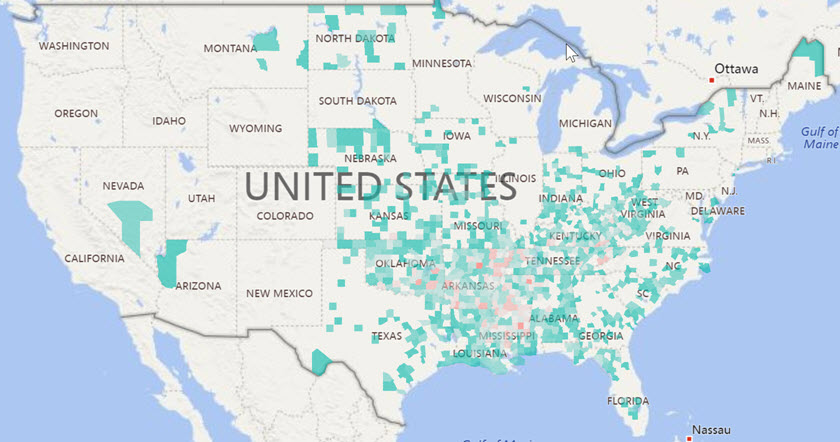
I love spring!  As a warm weather person living in the Northeast, I can’t wait to get outside and be physically active. While many are like me, still 29% of the U.S. remains by and large physically inactive and it is very regionally concentrated. The County Health Rankings uses a measure of physical inactivity as one of the ranking measures using data from the CDC Diabetes Atlas. The map below shows the counties where 30% or more of the population is physically inactive. 


There are 937 counties where 30% or more of the population self-identifies as being physically inactive, or approximately 29% of all counties in the U.S. Nearly half of these counties are in the states of Mississippi, Arkansas, Oklahoma, Tennessee, and Kentucky. This does not appear to be related to age, poverty, or access to exercise facilities. Michigan and Illinois for instance have only 2 counties that have greater than 30% inactive populations. These regional anomalies appear to be very complicated and deeply entrenched. Much has been studied about socio-demographics of physical inactivity with few conclusions.


Share This Story

Similar Posts

  • Is Bureau of Labor Statistics Data Adequate?

    Several weeks ago, the Bureau of Labor Statistics (BLS) released updated Occupational Employment Statistics (OES) survey data. BLS OES is one of those foundational programs and datasets that are used for comprehensive occupational analysis. It produces employment and wage compensation estimates annually for nearly 800 occupations. These estimates are available…

  • Breaking Down Net Price, Tuition, and Aid

    Reports by College Board and others have indicated that net price, the true measure of what a student pays to attend college, continues to rise. College Board has maintained that the actual net price has been increasing for six to eight straight years.    Net price is defined as the…

  • Villanova vs. Michigan in Athletic Costs

    Villanova clearly dominated Michigan on the basketball court and has now won the NCAA Men’s basketball tournament two of the last three years. But how has that success translated to other sports and to the athletic costs in general.    The Equity in Athletics data is released annually by the…

  • Inpatient vs. Outpatient – What the Numbers Show

    Analysts in health care don’t agree in unanimity very often, but most seem to agree that there will continue to be a quantum shift in healthcare from inpatient to outpatient. In this two part series, we will attempt to quantify and support this important trend. We utilized the Beds and…

  • Have Student Debt Repayment Rates Bottomed?

    Student repayment rates continues to decline, although the trend seems to be slowing, according to the most recent College Scorecard data. This data measures repayment rates at 1,3,5, and 7 years. Repayment rates and default rates are very different. Repayment rates are the percentage of students who have made progress…