When I graduated from high school, I couldn’t wait to go to a university that was far away from home. I landed in NE Indiana at Valparaiso University, which was far from my home state of New Jersey. For students, parents, and institutions, out of state enrollment is a double-edged sword. For students, it is a way of living the dream of college life without even the perceived shackles of home. That is balanced against the costs and inconvenience of being far from your home residence.
For institutions and regions, out of state students bring more money into the economy. Out of state students pay more, especially to state schools and spend more time on campus. Of course, out of state students also take up a slot that could be taken by an in-state student. Last year, California announced caps on the number of out-of-state students that would be accepted. Some have even argued that affluent out of state students crowd out poor and minority students.

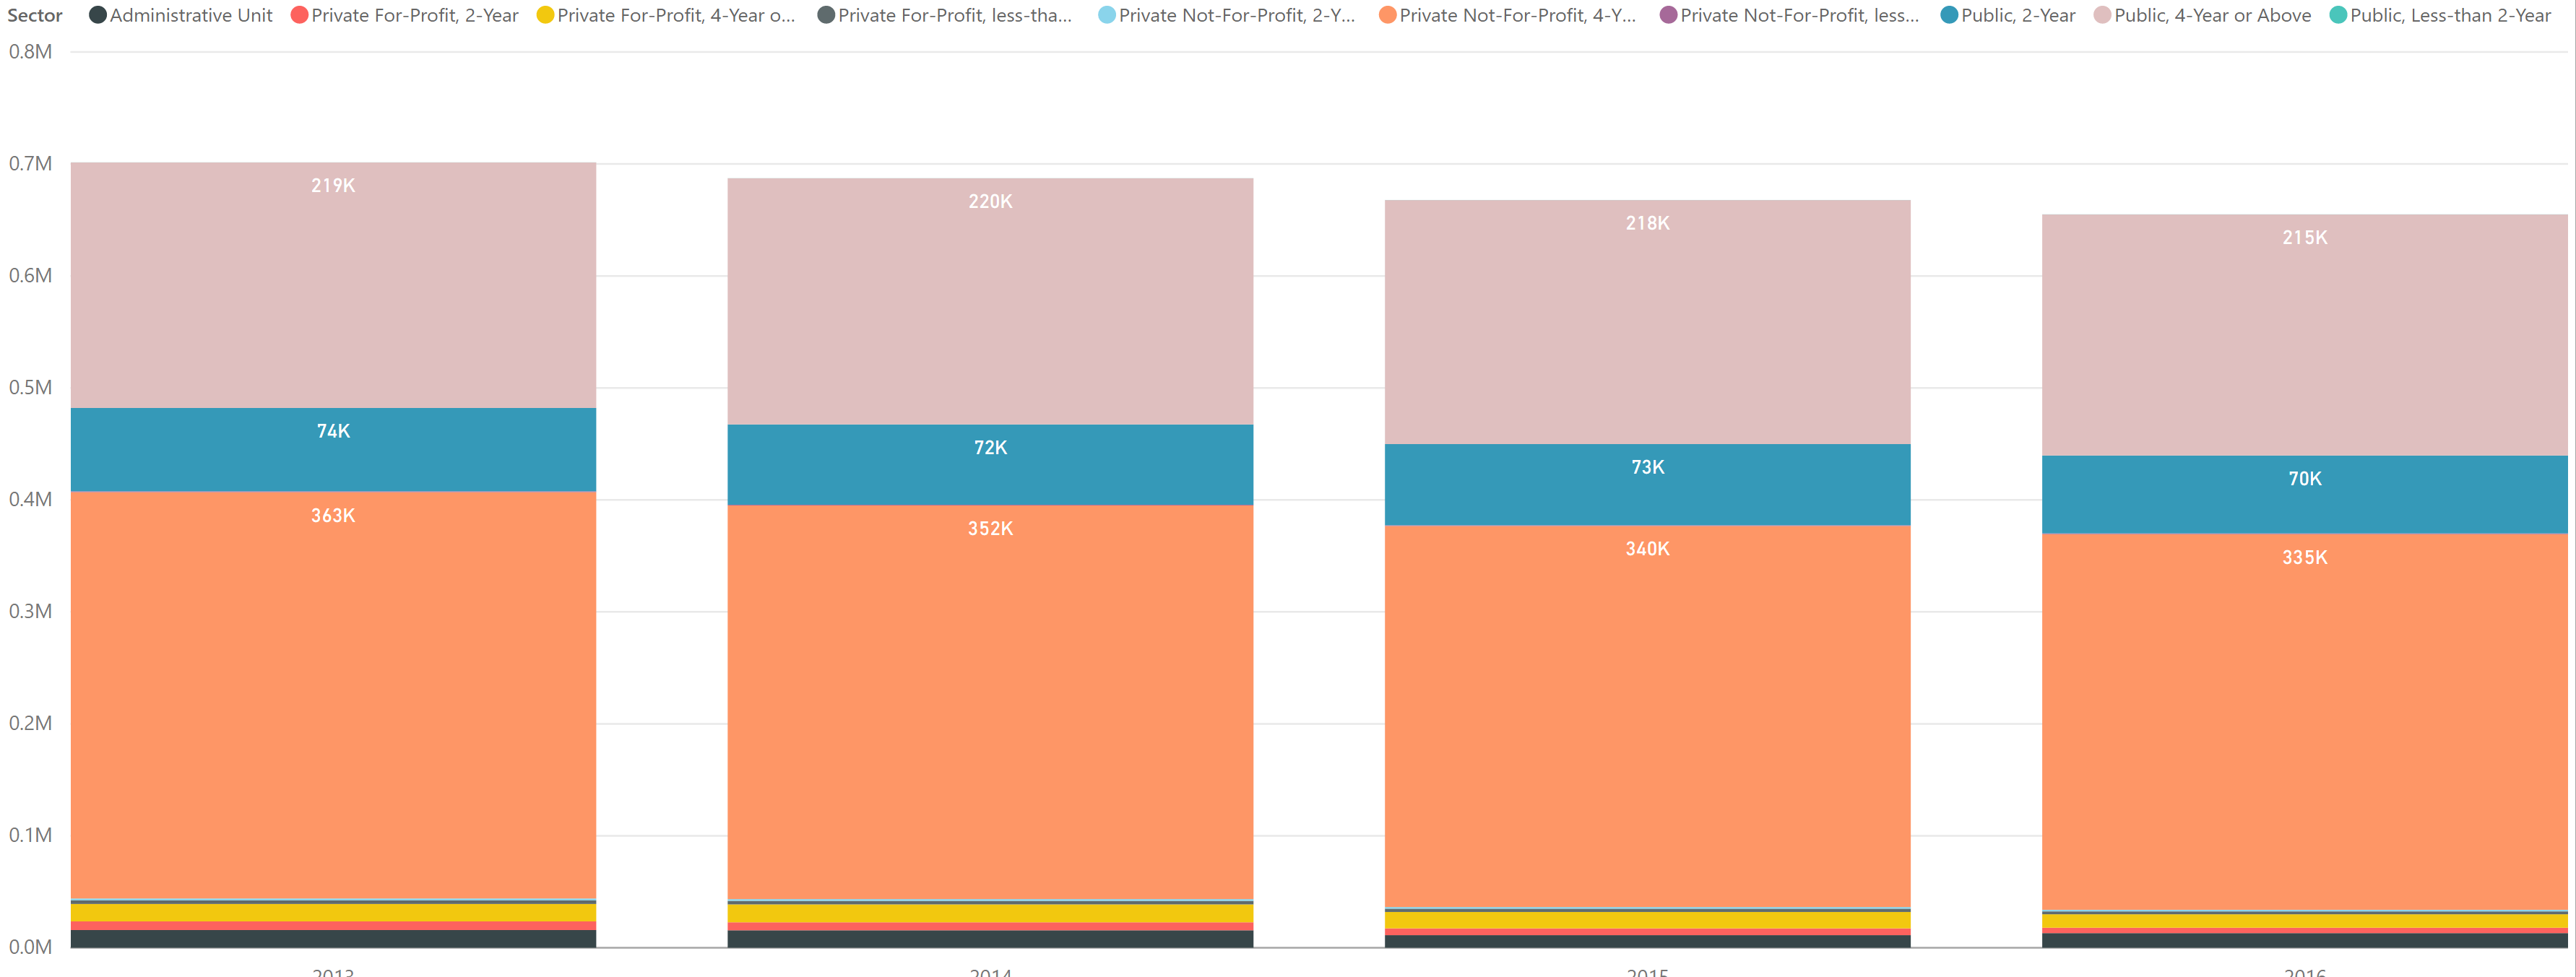
We were interested in looking at out of state enrollment at both an institutional and state-wide level. We used Public Insight OmniView to extract enrollment by state of residence for 2014 and matched up the state of the institution to the enrollment for that particular state. We then calculated the difference and an out of state enrollment value.
-
Across the country, out of state enrollment represents a little over 20% of all enrollment
-
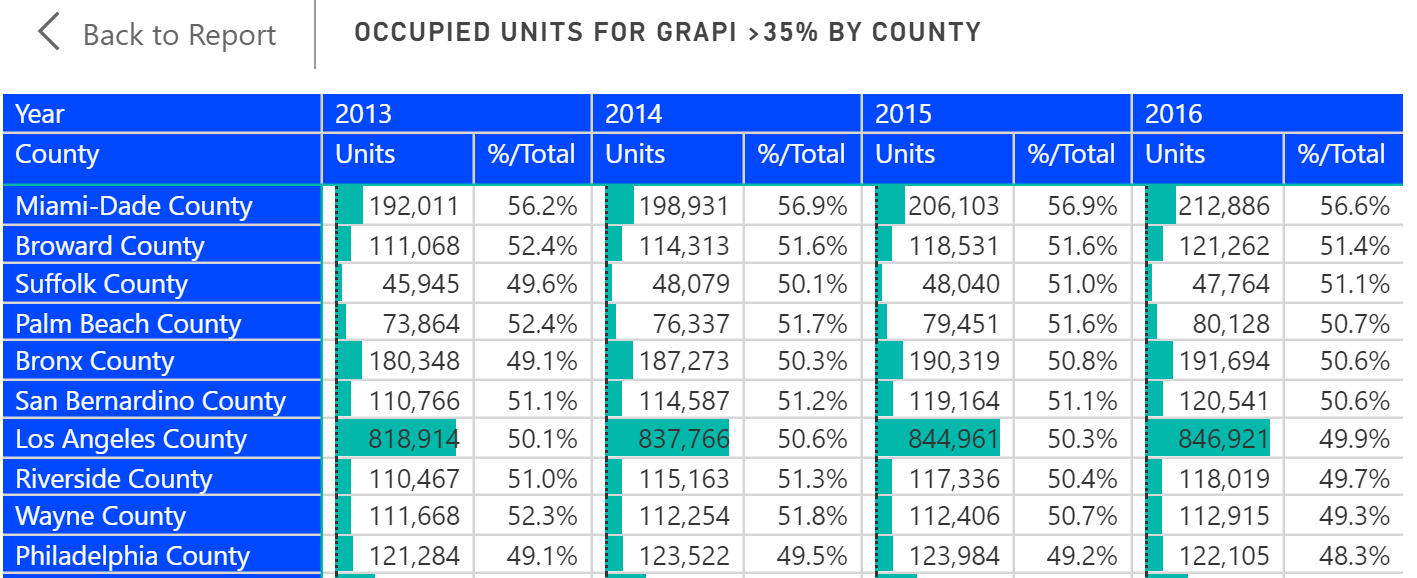
Percentages can range from 7.5% (Texas) to over 50% (Vermont, New Hampshire)
-
Online programs of course can influence out of state enrollment when reported
With this blog post, we are rolling out our content in a new Tableau Public site. You can access this site for free, by simply filling out the form on the following page (click hyperlink). We hope that you will enjoy this content and please send us feedback. We would love to hear more about what you think is valuable and what is not. Click HERE to go to the Tablea Public Site.
As with every analysis done in our blog posts, you can conduct the same type of research using Public Insight’s Premium Tools like OmniView. A subscription to Public Insight Premium includes a 30-day, risk-free guarantee. If you don’t like the analysis features of Public Insight, contact us for a full refund. To find out more about Public Insight’s Premium Tools and how they can benefit you and your organization, click HERE.