Inpatient vs. Outpatient – What the Numbers Show

Analysts in health care don’t agree in unanimity very often, but most seem to agree that there will continue to be a quantum shift in healthcare from inpatient to outpatient. In this two part series, we will attempt to quantify and support this important trend. We utilized the Beds and Utilization Interactive, which leverages numerous reporting metrics from the AHA Annual Survey Database™ over a five year period. 


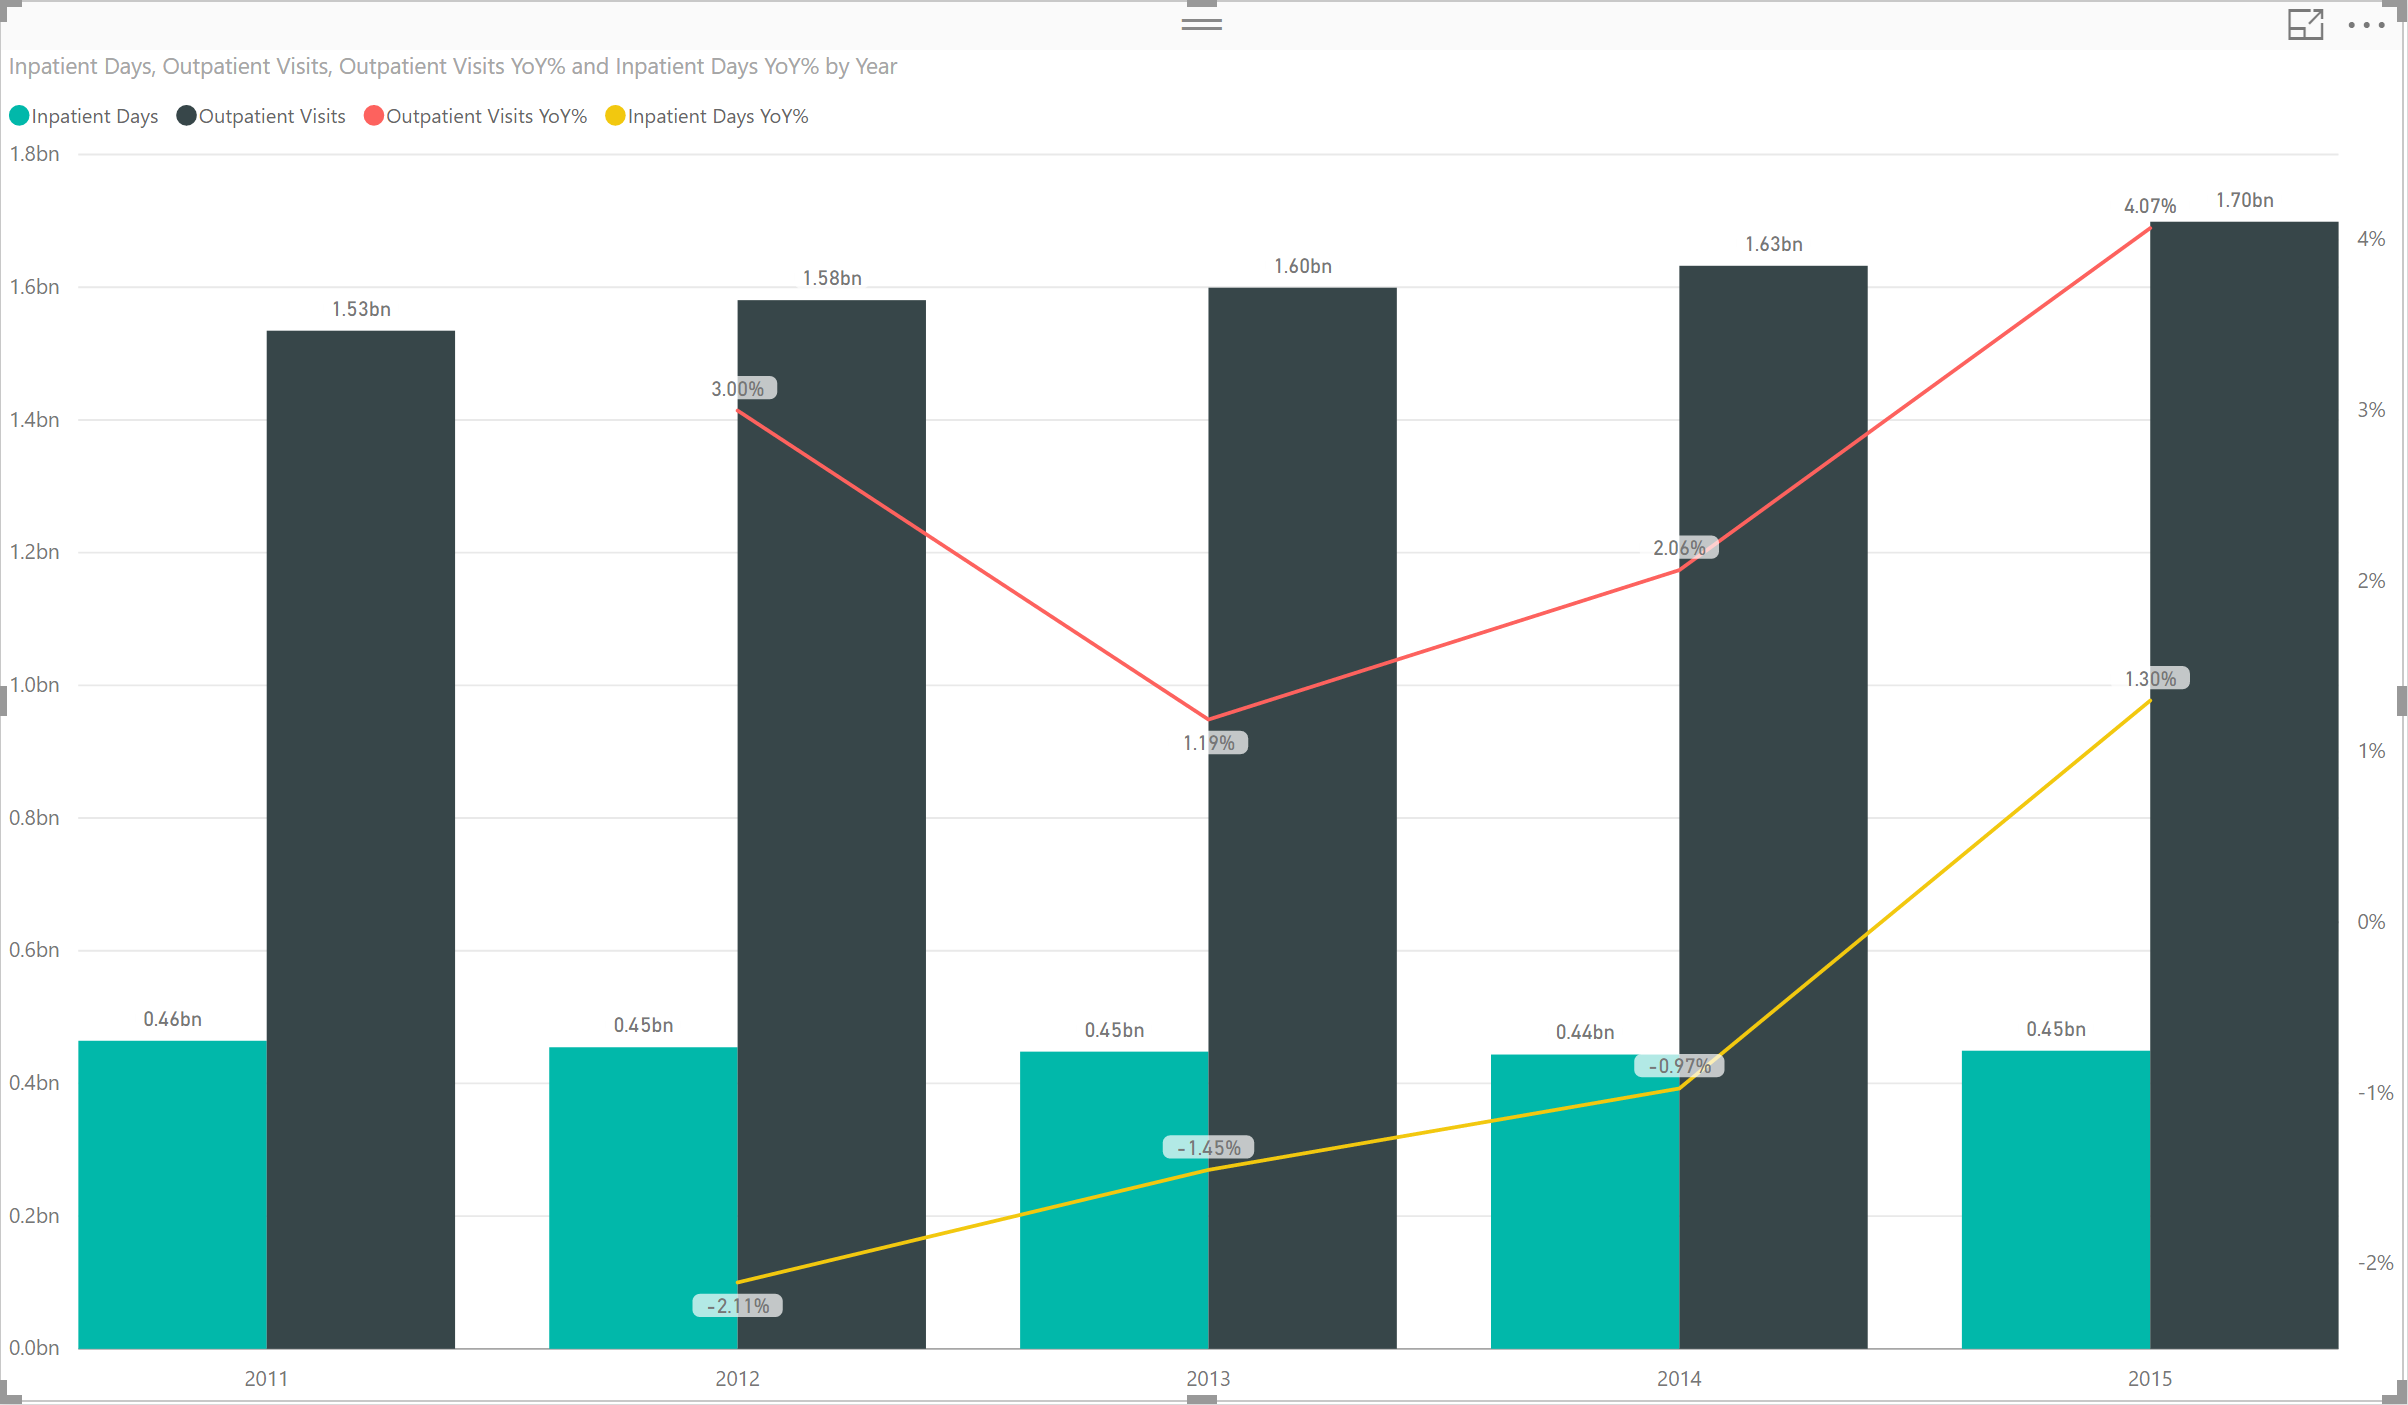
We superimposed inpatient days over outpatient visits over five years. Inpatient days has declined 3.2% while outpatient visits have increased 10.2% over the same time period. The most recent year available, the 2015 survey shows that outpatient visits made its largest annual gain yet of 4.2% while inpatient eaked out a small positive change for the first time in three years. The viz below shows these changes over the five year period.


Share This Story

Similar Posts

  • Hot Educational Programs in 2018

    Econometrics Programs Show Nearly Triple Digit Growth I am delighted to return to the blogosphere community. It has been a few months since we have published a blog, but not for a lack of work going on behind the scenes here at Public Insight. You will notice that our blog…

  • 12 College Programs with 100+% Growth

    Johnny Nash wrote an award winning song in 1972 called “I Can See Clearly Now”. It was one of those one-hit wonders that still is around today. Johnny would be proud to learn that the field of Vision Science and Physiological Optics topped our findings for emerging program growth with…

  • Death Rates Rise Sharply for Millenials

    The new CDC mortality data continues to paint a rather grim picture. Last week we focused on the external causes of the rise in death rates. This week we analyzed the mortality (death) rate among age groups using over 1.8 billion data points over 17 years from the CDC. You…

  • Hot Growth Industries

    The building boom is officially back after a long hiatus. The number of construction employees increased 5% in 2016 according to the most recent County Business Patterns released by the U.S. Census.  The sector however with the most number of new establishments is the Information sector (NAICS 51) which increased 5%….

  • Lower Student Default Rates – Calm Before the Storm?

    Loan repayment rate data may trigger resurgence in default rates The most recent Federal Student Aid student default rate data indicates that the composite student default rates declined from 10.8% in 2015 to 10.1% in 2016, a decline of 6.5% and continuing a seven-year post-recession trend. In 2010, the default…