Student Debt Rises 13%

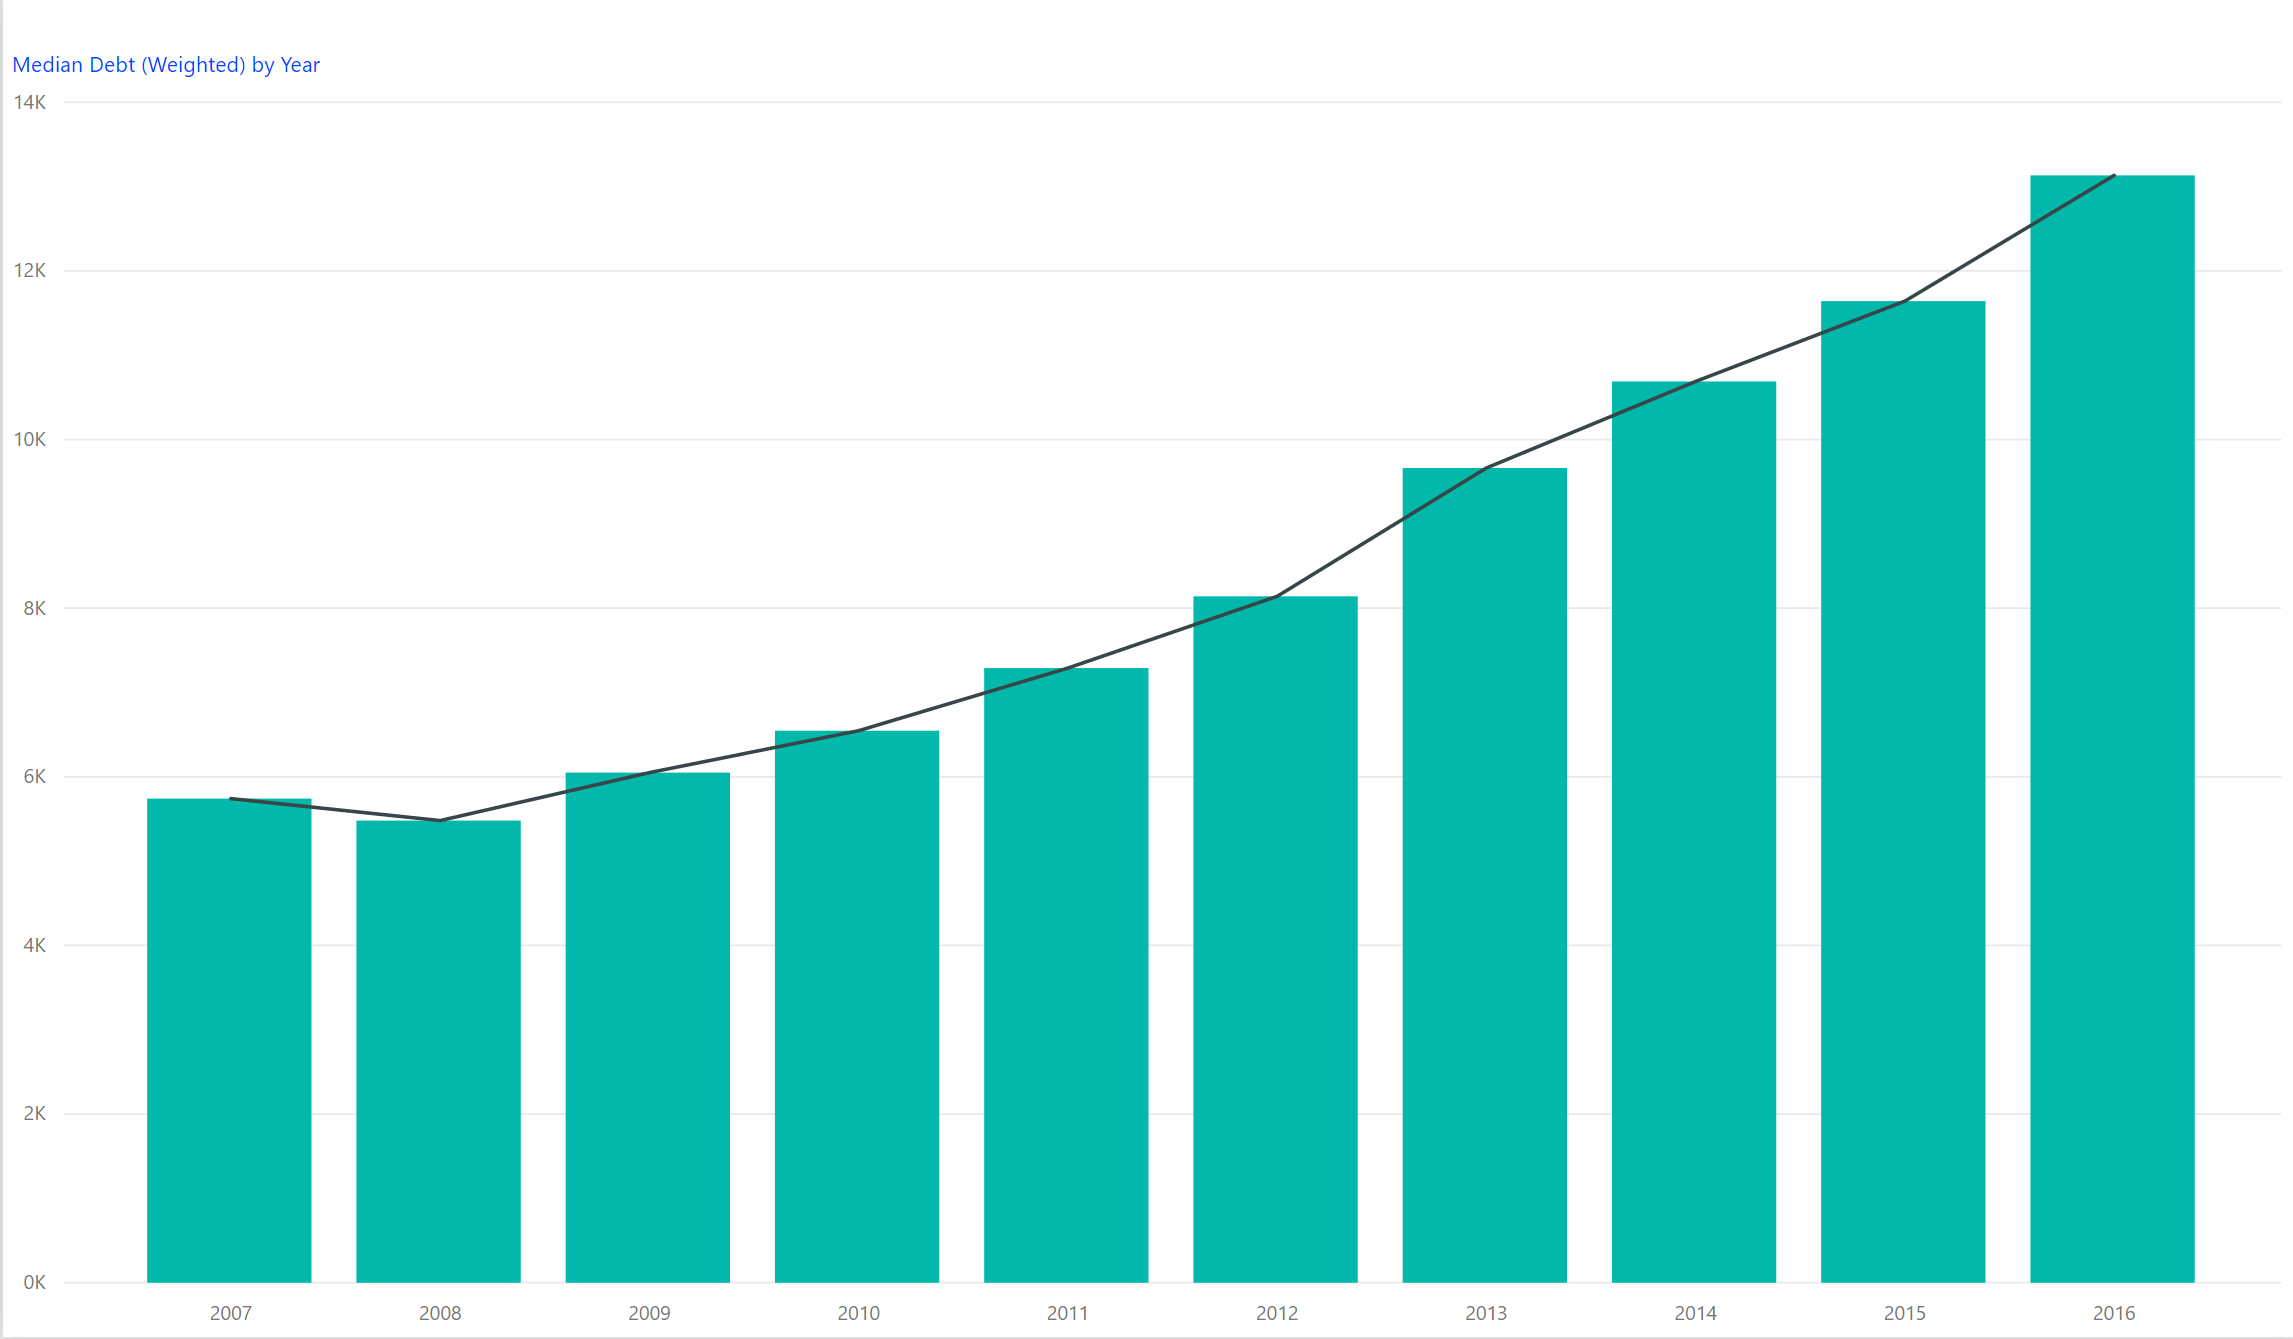
The newest College Scorecard data released several weeks ago reveals an ongoing trend in student debt. The median student debt increased 13.1% from 2015 to 2016. The median student debt has now more than doubled since 2007 as shown by the following graph. We calculated this using a weighted average of the number of students in the cohort times the median debt by institution. There are over 37 million students in 2016 reflected in this calculation.  You can browse the new College Scorecard data for free using our Data Browser tool.


Median Debt is defined within the College Scorecard documentation as the debt accumulated at the institution by all student borrowers of federal loans who separate (i.e., either graduate or withdraw) in a given fiscal year, measured at the point of separation. More specifically, the measure represents the sum of all undergraduate federal loans over students’ college education at the institution for which the median debt is reported for —e.g., if a student receives a federal loan for $2,000 for each of eight semesters at one institution, their cumulative debt is recorded as $16,000 for that institution. Median Debt does not represent all forms of debt, but only subsidized forms of loans. 


The student debt data is disaggregated by a number of criteria such as gender, completion status, pell recipients, or family income.  

Share This Story

Similar Posts

  • Endowments per Student Down in 2016

    How financially fit is your institution? One of the measures that Forbes has used in assessing the financial fitness of postsecondary institutions is endowment assets per FTE. This metric takes the value of endowment assets at the end of the year and divides it by the number of FTE’s. In…

  • Will Voter Unpredictability Continue in 2018?

    Much has been written about the increased polarization of America and its collective impact on communities. There were many surprises in the 2016 election and people are bracing for a potentially tumultuous 2018 mid-term election. Ohio, where I live, is one of the swing states. The average county in Ohio…

  • Death Rate Continues to Inch Up

    The mortality (or death) rate increased nominally from 2016 to 2017 going from 844 to 849 deaths per 100,000. This probably is not earthshaking news but based on the overall crude rate, it has actually been increasing since 2009 as noted by the following graph.   Advances in medical care…

  • How Healthy Are U.S. Hospitals?

    If we said that 20% of any industry was at financial risk, we would all be up in arms. However, a recent Morgan Stanley report citing that statistic was met with some degree of yawning. The report cites that 450 hospitals are at risk of closure and another 600 are…

  • CMS Introduces New Hospital Returns Measure

    The most recent batch of Hospital Compare data has expanded the whole area of readmissions, returns, and deaths. There are now separate measures for mortality rates, readmissions, and hospital returns. The hospital returns measure is brand new, with the most recent data through June 2016, and applies to heart attack…