BLS Releases New 10-Year Employment Projections

Last month, the Bureau of Labor Statistics released its 10-year employment projection data. This data is updated every other year. The new data shows a projected increase over the next decade of 7.4% which is a noticeable increase over the previous 6.5% 10-year projections in 2014. These projections are not so much driven by economic growth as population growth. Implicit in the forecast are assumptions about future fertility and mortality rates of the U.S. population. Also included are assumptions about immigration, the most uncertain but important factor affecting the size of the future labor force.


BLS produces occupational employment projections by analyzing current and projected future staffing patterns (the distribution of occupations within an industry) in an industry−occupation matrix. Changes in the staffing pattern for each industry are projected and applied to the final industry projections, yielding detailed occupational projections by industry. Employment growth is projected for nearly all occupational groups, from healthcare to transportation occupations. The only occupational group projected to decline from 2016 to 2026 is production occupations, at a rate of 4.1 percent.


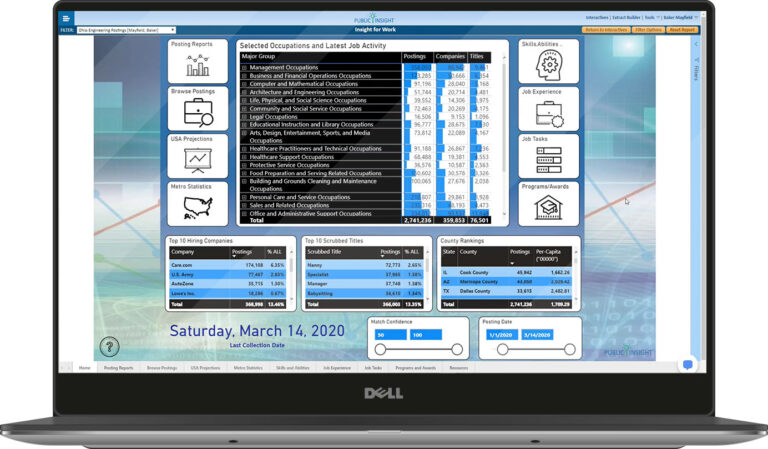
The Degree-to-Jobs Interactive leverages these employment projections as part of this unique program planning tool. The updated 2016 projections will be incorporated into the Degree-to-Jobs Interactive shortly. The data is now also available for free for registered users to browse in Data Browser


The BLS Employment Projections has some new information that we will spend the new few weeks discussing. Note there will be no Weekly Insights next week for the Thanksgiving holiday. 


Share This Story

Similar Posts

  • Student Financial Aid up 6.2%

    Postsecondary institutions gave over $17 billion in financial aid in 2015. This represented a 3% increase from 2014. However, the number of student receiving the financial aid declined 3% so the average financial aid per student when looked at over the entire postsecondary landscape actually increased 6%. We used data…

  • The Debt Service Cost of PLUS Loans

    Last week, we observed that the PLUS loan program continues to escalate both in terms of dollars borrowed and in terms of recipients. Using the newly published Financial Aid Interactive, we projected the number of dollars borrowed by PLUS loan borrowers will increase 1.25 billion for the year ending June,…

  • Fringe Sport Participation

      In this Data Dan video, Dan uses data from the Equity in Athletics data set from Title 9 Participating schools to look at fringe sports at colleges across the country.  

  • What is the Newly Released Carnegie Data?

    The Carnegie Classificationâ„¢ has been the major institutional framework for describing higher education institutions since 1970. This classification system comes out approximately every five years with the latest rendition released on February 1, 2016. This release represents the initial data provided by the Indiana University Bloomington Center for Postsecondary Research…

  • Infection Procedures Top Inpatient Volume Growth

    While Medicare inpatient procedure volume has remained flat since 2013, infections are a significant area of high volume change. The treemap below from the Inpatient Procedure Analysis Interactive shows the inpatient volume growth by procedure with color coding by volume change from 2013-2015 using the Medicare Provider and Analysis Review…